Displaying 1 - 10 of 31
Dr A Röschl's picture

Ventricular Tachycardia After Inferior Myocardial Infarction

76-year-old man, with a history of inferior wall myocardial infarction. He experiences recurrent episodes of brief palpitations, often lasting only 5-15 seconds. In this ECG, at the beginning, the last part of a wide-complex tachycardia is visible. After 2 sinus beats, another wide-complex tachycardia begins (with the same QRS configuration).

Dawn's picture

Inferior Wall M.I. With Subtle ST Elevation

This ECG is a good example of an inferior wall M.I. that was confirmed and treated in the cath lab.

The ST segments are elevated in Leads II, III, and aVF, but the amount of elevation may look subtle to some.   When the amount of elevation seems small, what other signs can help us recognize acute ST-elevation M.I.? 

PATIENT HISTORY AND PRESENTATION   This patient had acute chest pain, and was over the age of 50. We do not know his past medical history. His chest pain was described as substernal and epigastric, radiating to his back.  He had nausea and diaphoresis.  His past medical history is unknown, but it would be significant if he had a history of coronary artery disease, past M.I., smoking, metabolic syndrome, strong family history of heart disease, etc.

ST SEGMENT ELEVATION DISTRIBUTION   In acute STEMI, the elevation will be seen in “related leads”. That is, the leads that are affected will reflect a region of the heart that is supplied by the same artery. Some M.I.s are larger than others, affecting more leads, because some obstructions are more proximal than others in the artery.  This ECG shows STE in the inferior wall leads:  II, III, and aVF.  The culprit artery for this patient was the right coronary artery, which supplies the inferior and posterior wall of the left ventricle, the right ventricle, and the right atrium in the majority of people.

RECIPROCAL ST DEPRESSION   Finding reciprocal ST depression in the leads that are OPPOSITE the affected leads is a very reliable sign to confirm that the STEs are due to an acute M.I.  In fact, often the reciprocal depression is “stronger” or easier to see than the elevation.  It is important to teach your students how the standard leads are oriented to the heart, so they will recognize the 12-Lead ECG as a “map” of the heart.  The reciprocal ST depression in this ECG is seen in Leads aVL and I (subtle), which are across the frontal plane from Lead III.   We also note reciprocal ST depression in the precordial leads, especially notable in Leads V1 through V3.  This can reflect the injured area extending up the back of the heart from the inferior wall (posterior wall).  The R waves in V2 and V3 are a bit higher than normally expected, which could indicate a reciprocal view of pathological Q waves on the posterior wall.  Print the ECG out on paper, turn it upside down, and look at V2 and V3 through the back.  V2 and V3 will look like a “classic” STEMI.  This should be approximately the view you would get from additional posterior leads.

Dawn's picture

Inferior Wall M.I.

This ECG shows a common manifestation with inferior wall M.I., BRADYCARDIA.  We see the signs of acute inferior wall M.I. in the inferior leads:  II, III, and aVF all have ST segment elevation.  There almost appear to be pathological Q waves in Leads III and aVF.  There are still VERY tiny r waves, and the downward deflections are not wide, but should full-blown Q waves develop in these leads, they would signify necrosis in the area.  A repeat ECG would certainly be warranted. 

Another sign that there is an inferior wall STEMI is the ST segment depression in Leads I and aVL, which are reciprocal to Lead III.  ST depression can have many meanings, but when it is localized in the leads which are opposite ST elevation, it is reciprocal.  There is also ST depression in Leads V1 and V2.  These leads are reciprocal to the POSTERIOR wall, otherwise known as the upper part of the inferior wall.  If an inferior wall M.I. is large enough, it can produce ST elevation in the posterior leads (not performed in this case), and ST depression in the anterior leads, especially V1, V2, and V3. 

The rhythm is a marked sinus bradycardia, at just under 40 beats per minute.  Sinus bradycardia is very common in inferior wall M.I., because the inferior wall and the sinus node are usually both supplied by the right coronary artery.  AV blocks can also occur because the AV node is also supplied by the RCA in most people. 

It is important to remember that bradycardia does not always need to be treated.  In patients with acute M.I., a well-tolerated bradycardia may actually be beneficial to the injured heart, reducing supply/demand ischemia.  A well-tolerated bradycardia is a rate that does not produce low blood pressure and poor peripheral perfusion.  Some people tolerate rates in the 40’s quite well.  If the patient shows signs of poor perfusion: low BP, decreased mentation, pallor, shortness of breath, the rate should be cautiously increased with medication or electronic pacing.  


Dawn's picture

Acute Inferior-Lateral M.I. In A Patient With A Dominant Circumflex Artery

This ECG was obtained from a patient who suffered an obstruction of the circumflex coronary artery.  Unfortunately, he was in the approximately 15-18% of the population in whom the circumflex artery is dominant.  That means that it connects with the posterior descending artery, perfusing not only the lateral wall of the left ventricle, but also the posterior and inferior walls.  In this case, the obstruction is in the midportion of the artery, and the high lateral wall is spared.  The large number of leads with ST elevation indicate the large amount of myocardium affected.  Leads II, III, and aVF have ST elevation, as do Leads V3 through V6.  Lead aVL has reciprocal ST depression. The T waves in the affected leads are "hyperacute", or taller than normal.  This is usually an early change in acute M.I., and disappears after the onset of ST elevation.

It is not always easy to determine from the ECG that the circumflex artery is the culprit artery, rather than the right coronary artery, which perfuses the inferior wall in the majority of people.  Some clues are:  Lead III has ST elevation equal to that of Lead II, the low lateral wall (V5 and V6) are affected, and aVL has reciprocal depression but Lead I does not.

This is a very large M.I., due to the dominance of the circumflex artery.  The patient did not survive, in spite of aggressive treatment.

Dawn's picture

Second-Degree AV Block, Type I

This ECG is from an 80-year-old woman who had an acute inferior wall M.I. with a second-degree AV block.
 
Some people incorrectly call ALL second-degree AV blocks that are conducting 2:1 "Type II".  This is incorrect, as Mobitz Type I can also conduct with a 2:1 ratio.  The progressive prolongation of the PR interval will not be seen with a 2:1 conduction ratio, because there are not two PR intervals in a row.

This is a good example of a Type I, or Wenckebach, block which is initially conducting 2:1.  At the end of the ECG, two consecutive p waves conduct, showing the "progressively-prolonging PR interval" hallmark of a Type I block. Type I blocks are supraHisian - at the level of the AV node - and generally not life-threatening.  Blocks that are conducting 2:1 present a danger, however, in the effect they have on the rate.  Whatever the underlying rhythm is, the 2:1 block will cut the rate in half!  This patient has an underlying sinus tachycardia at 106, so her block has caused a rate of 53.  In light of her acute M.I., that rate is probably preferable to the sinus tach. This patient’s BP remained stable, and she did not require pacing. 

The ST signs of acute M.I. are rather subtle here. Note the "coving upward" shape in Lead III, and the reciprocal depressions in I, aVL, V1, and V2.  Type I blocks are common in inferior wall M.I., since the AV node and the inferior wall often share a blood supply - the right coronary artery. 

While the print quality of this ECG is not the best, it is a great teaching ECG because it starts out with 2:1 conduction, then at the end of the strip, proves itself to be a Wenckebach block.   

Dawn's picture

Acute Inferior Wall M.I. With Right Ventricular M.I. and Atrial Fibrillation

This 31-year-old man presented to the Emergency Dept. complaining of chest pain, shortness of breath, and nausea. His heart rate on admission was 120 - 130 bpm and irregular, and the monitor showed atrial fibrillation. His rate slowed with the administration of diltiazem. His 12-lead ECG shows the classic ST elevation of inferior wall M.I. in Leads II, III, and aVF. This patient also had JVD, bibasilar rales, orthopnea, and exertional dyspnea, signs of CHF. He had no history of acute M.I., CHF, or atrial fibrillation. He offered no history of drug use or medications.

This ECG is very useful for the basic student, in that the ST elevations are readily seen, and the atrial fib is definitely irregularly-irregular. For the more advanced student, the ST depression in V2 indicates posterior wall injury, while the flat ST segment in V1 indicates a possible right ventricular M.I.  While the posterior wall is trying to depress the ST segment, the right ventricle is trying to elevate it, resulting in flattening. Also, Lead III has a greater STE than Lead II, which has been shown to be a reliable indicator of RV infarction.  This should be confirmed with a V4 right, or all chest leads done on the right side. Right ventricular injury has been shown to increase mortality, and it also requires different management of hemodynamics.

Dawn's picture

Inferior-lateral and Posterior Wall M.I.

This is from a Cardiac Alert patient, with chest pain, in the Emergency Department.  The ECG shows ST elevation in the inferior leads (II, III, and aVF), and in the low lateral leads (V5 and V6).  There is reciprocal depression in V1 and V2, indicating injury in the posterior wall.  One could argue that "inferior" is just the term we use for the lower part of the posterior wall - the part that faces the floor in a standing person.  So, "inferior-posterior" reflects a more proximal occlusion of the culprit artery.

The high lateral wall is represented by I and aVL.  These leads would usually show marked reciprocal ST depression when II, III, and aVF have elevation.  However, in this ECG, aVL is depressed, but not as much as expected, and Lead I almost looks elevated!  This could represent even more extensive lateral wall involvement.  A dominant right coronary artery could be the culprit, but it seems more likely that a dominant circumflex artery is to blame, as it could perfuse the entire lateral wall before joining with the posterior descending artery and perfusing the inferior wall.  Unfortunately, we do not have the cath results on this patient.

The ST elevation in this ECG has the classic appearance of acute M.I., and will be interesting to both beginner and advanced students.

Often, one ECG can provide a wealth of teaching opportunities, no matter what the level of your students.  For the student learning to monitor the rate and rhythm, you might crop this image to only show the Lead II rhythm strip at the bottom, for a good example of normal sinus rhythm with a borderline PRI of .20 sec.   For the student learning about ST elevation M.I., this is a good example of inferior-posterior and lateral injury.  Leads aVL, V1 and V2 demonstrate reciprocal ST depression.  When an observant student notices the slight ST elevation in V6, a discussion of coronary artery distribution can occur.  

Dawn's picture

Inferior Wall M.I. and Right Bundle Branch Block

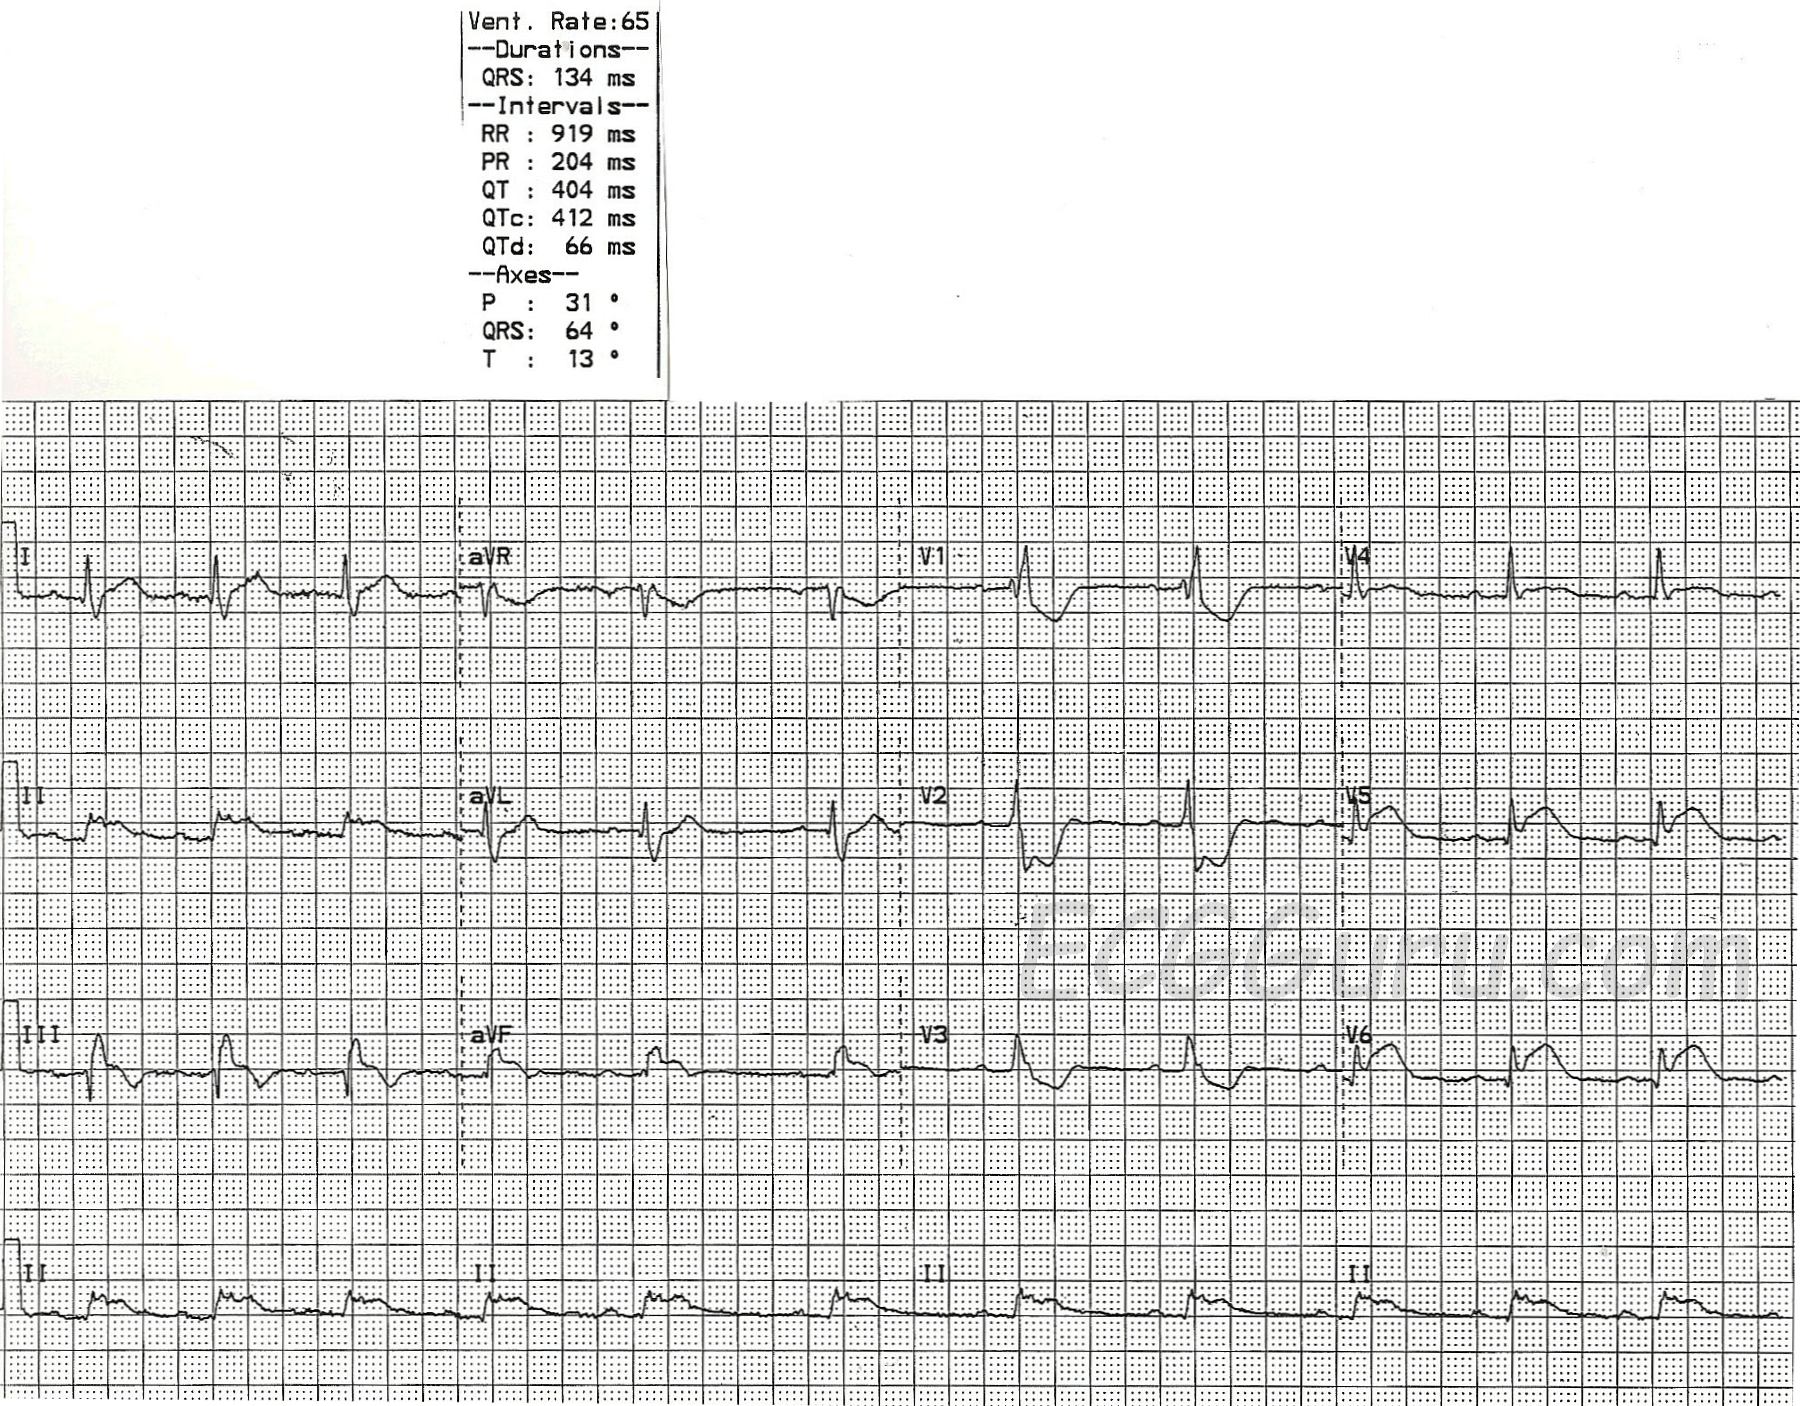
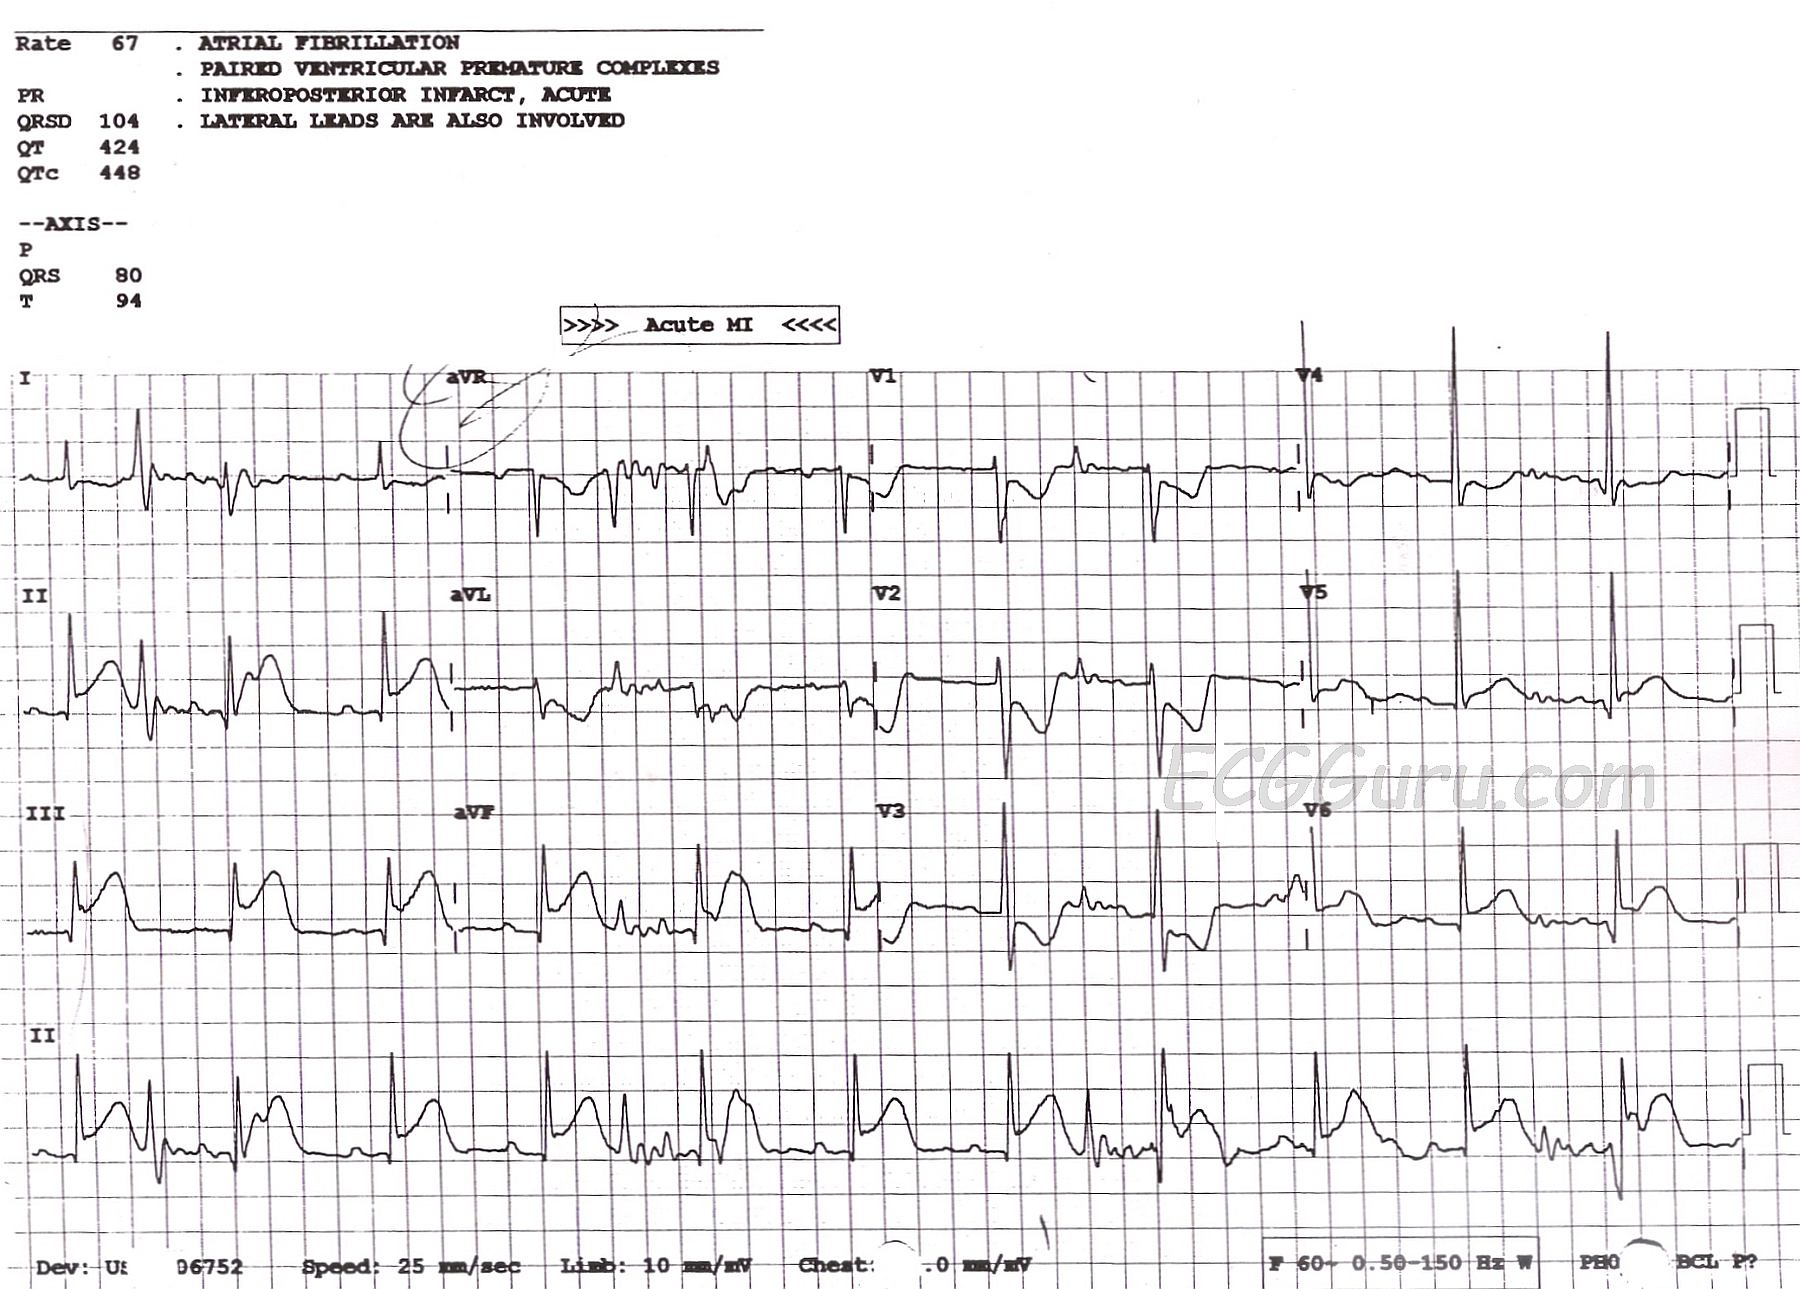
This ECG shows two obvious abnormalities, right bundle branch block AND inferior wall M.I.  It is also a good teaching example of how the terminal wave of RBBB can be mistaken for the ST elevation of M.I.

First, check this ECG to see if it meets the criteria for right bundle branch block:

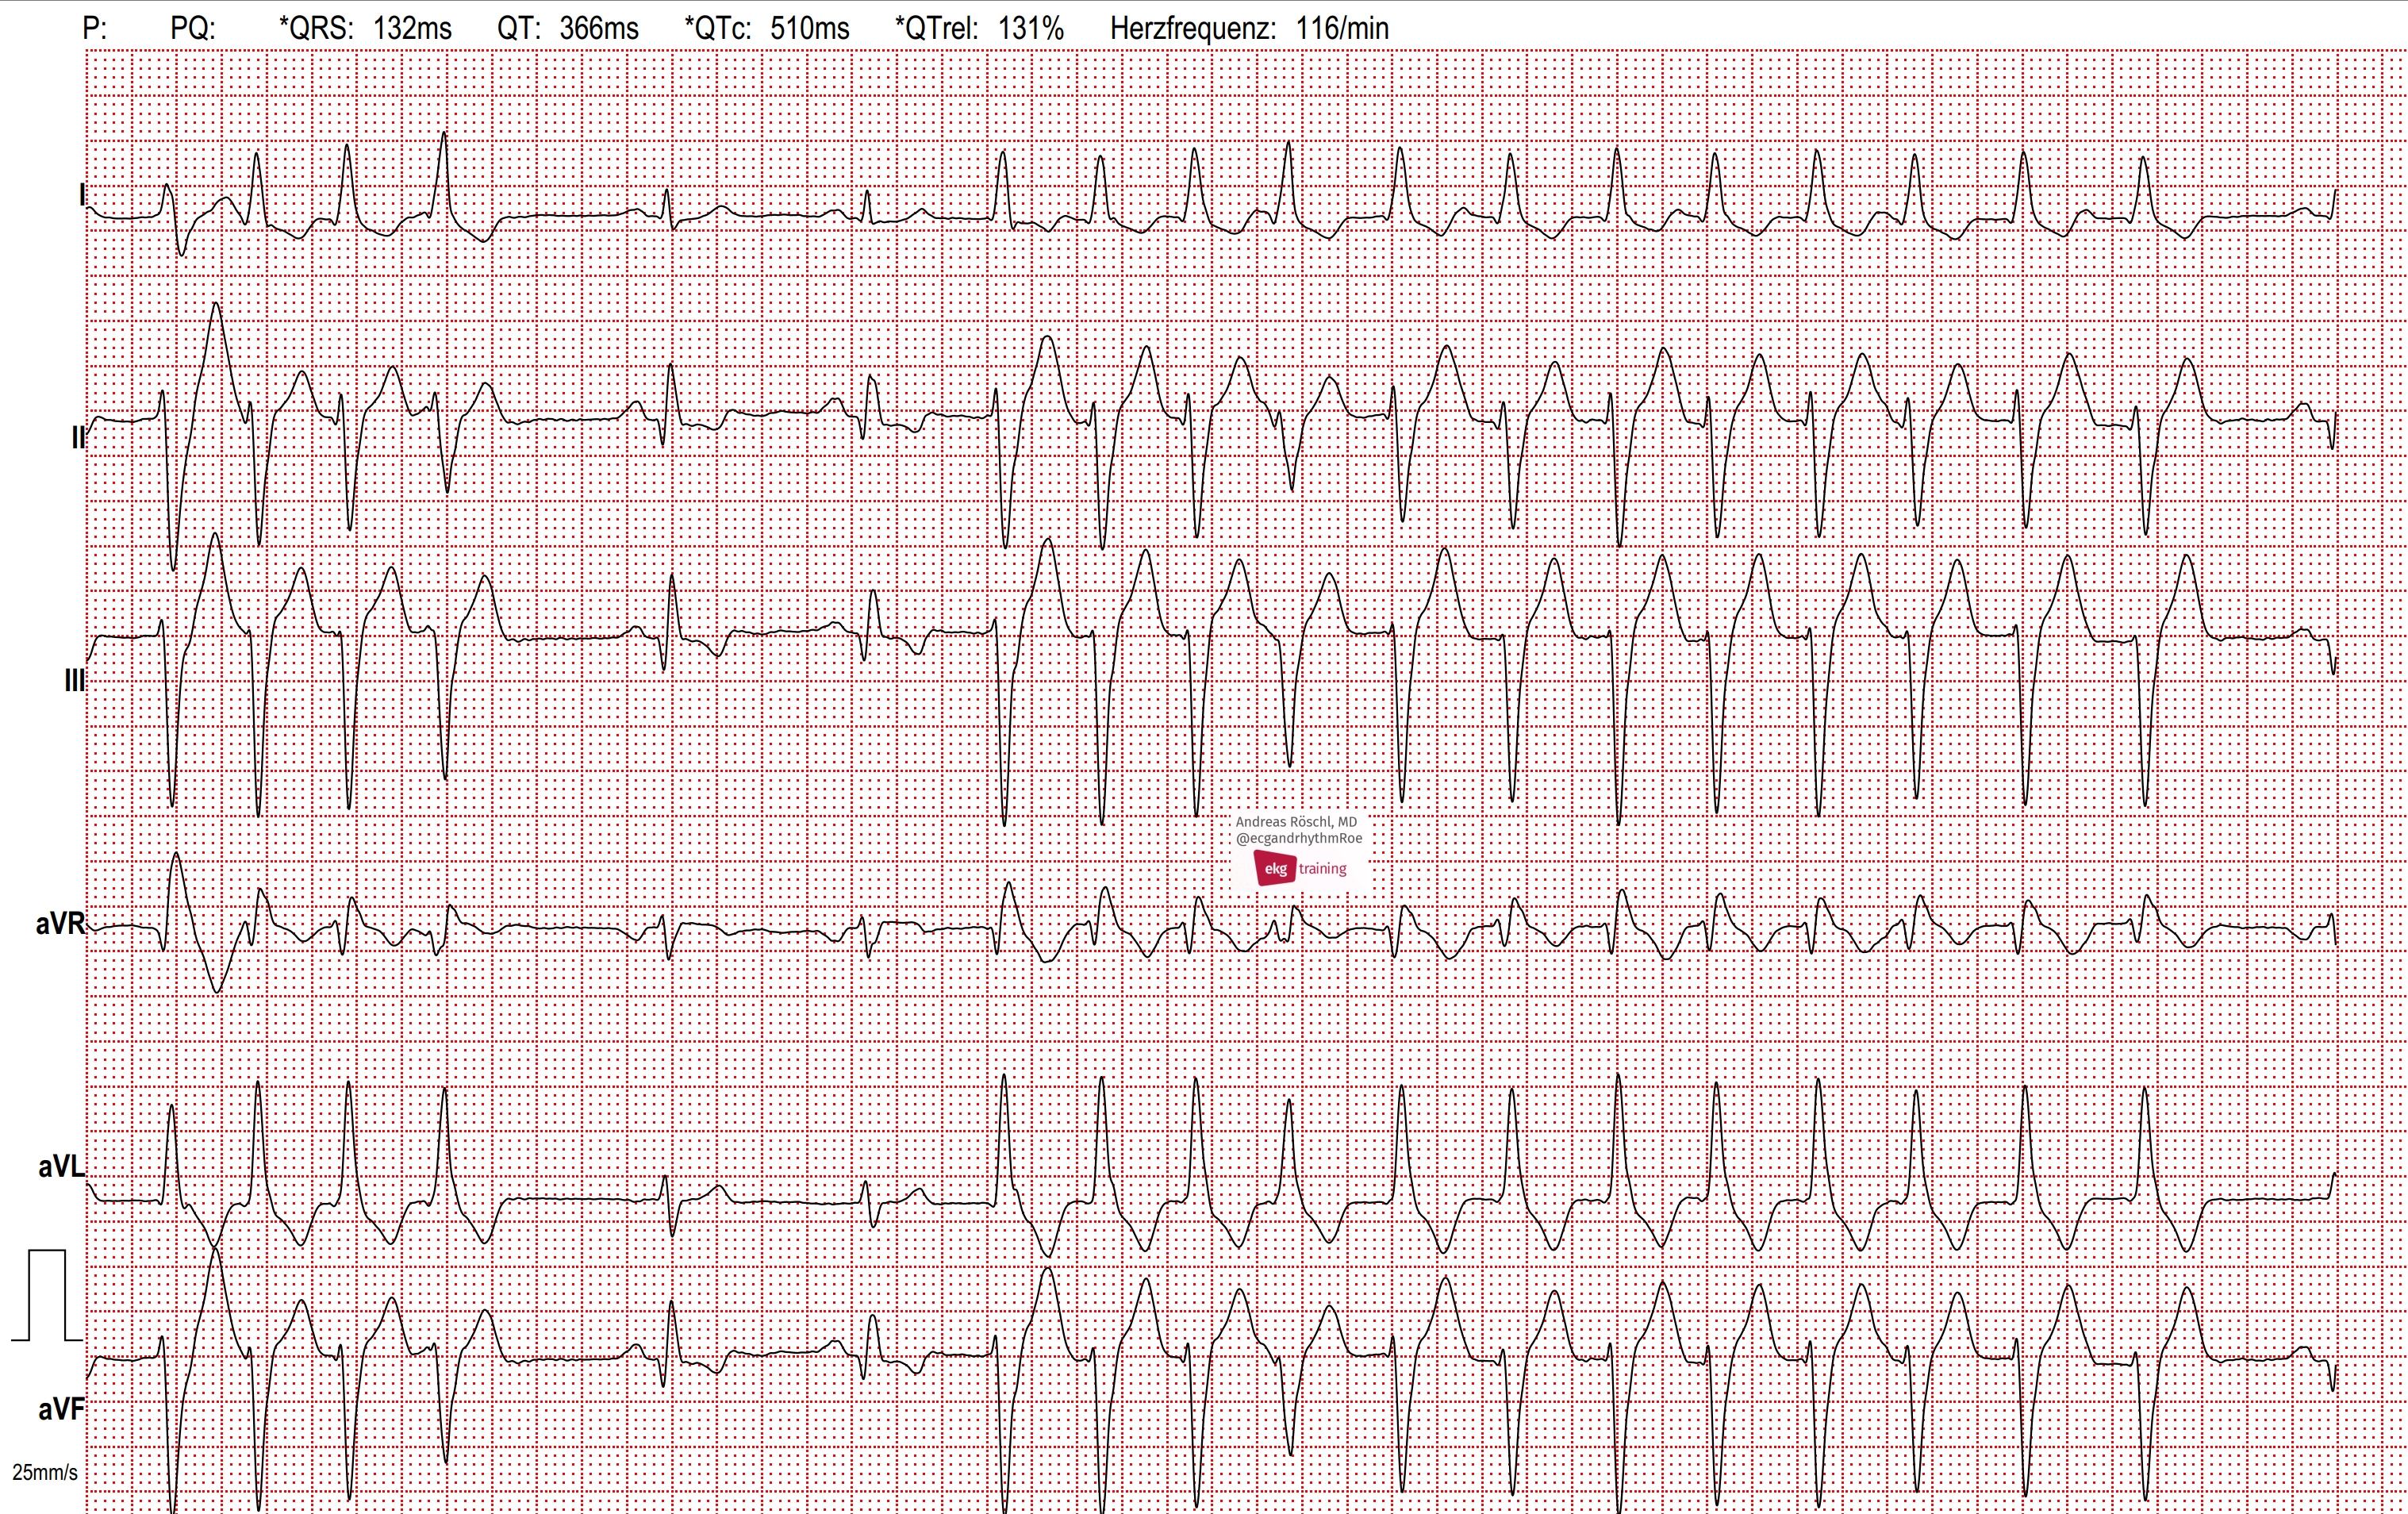
1)  The QRS will be wide. That is, it will be greater than or equal to .12 seconds (120 ms).  In this case, the QRS is 134 ms.

2)  The rhythm will be supraventricular.  Supraventricular rhythms originate from above the ventricles.  This ECG has P waves before each QRS.  Even though the rhythm is irregular, slowing down during this recorded period, it is a sinus rhythm.

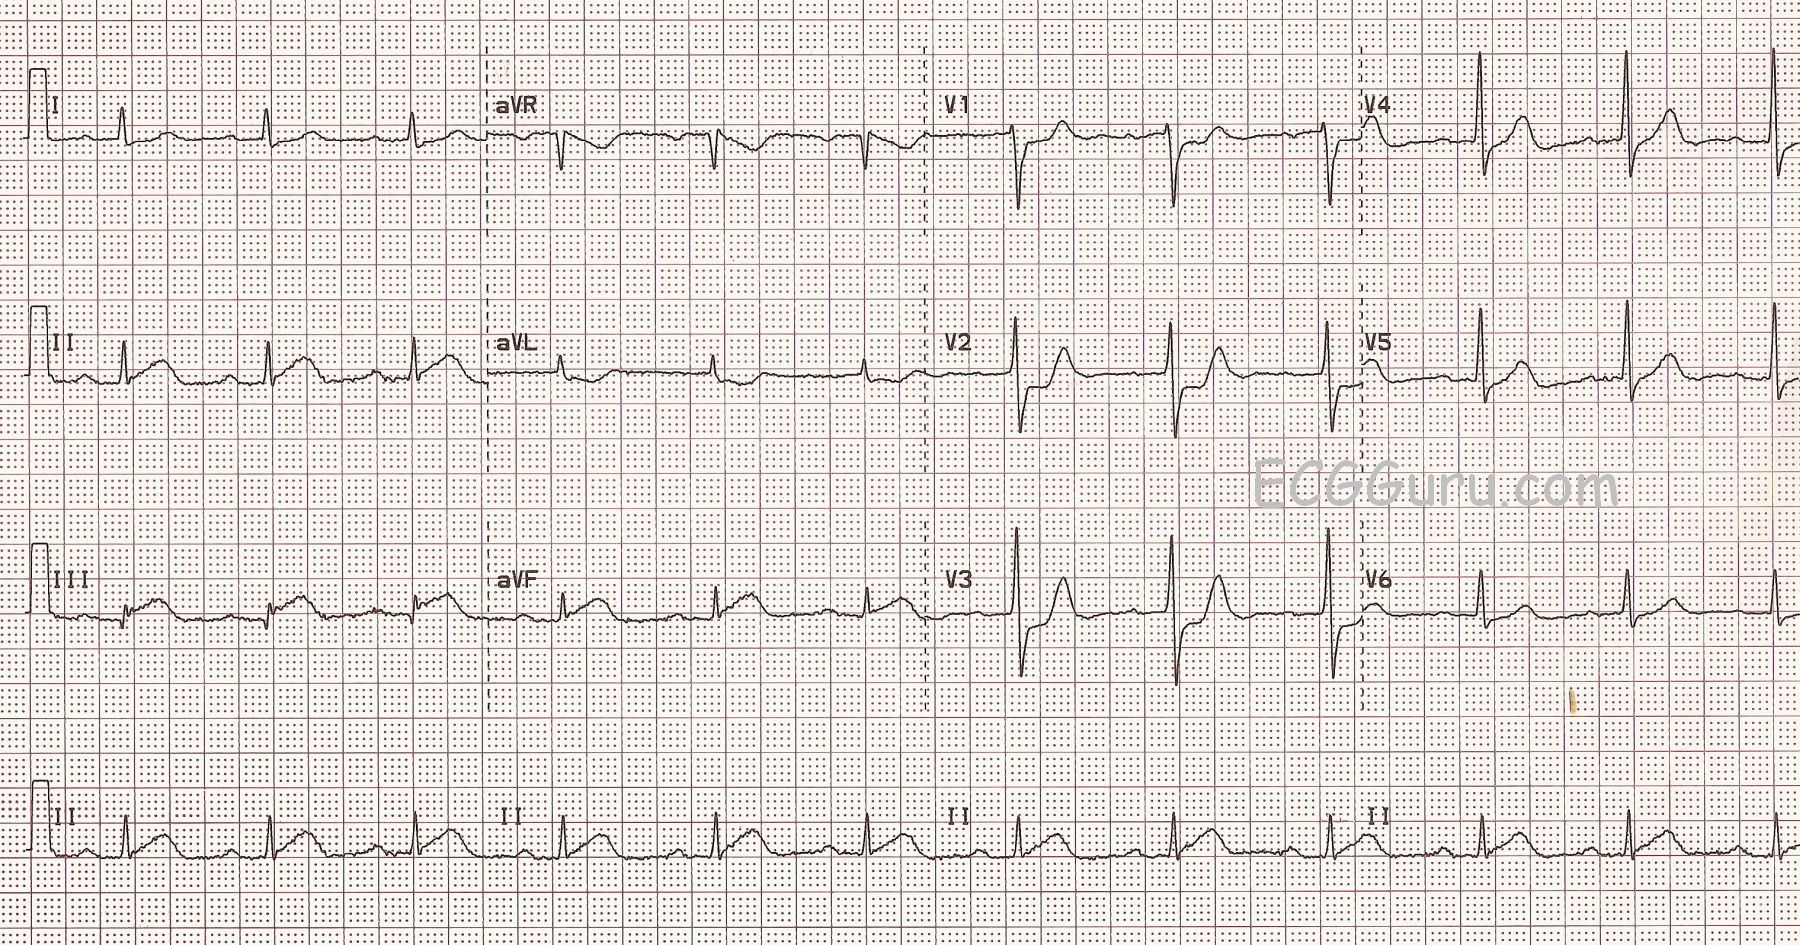
3)  The QRS will have a terminal wave after the "normal" part of the QRS.  This represents the right ventricle depolarizing late.  It is very easily seen in V1, which normally has an rS pattern, and with RBBB has an rSR' pattern, making it appear upright.  V6 and Lead I will show this terminal wave as a wide little s wave.

As mentioned, there is also an acute inferior wall M.I. here.  The ST segment elevation in Leads II, III, and aVF are actually quite subtle.  The flat top of the ST segments gives them away as abnormal, along with the associated ST elevations in V5 and V6, and the reciprocal ST depressions in V1 through V3.  Normally, in IWMI, there will be reciprocal ST depressions in Leads I and aVL, but the elevations they are reflecting are very subtle, and so, therefore, are the depressions. 

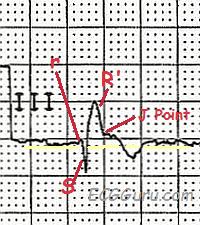
The tricky thing about this ECG is that you must look carefully at the inferior wall leads to see the true ST elevation, which, as mentioned, is subtle.  The RBBB terminal wave of the QRS complexes in Leads III and aVF is upright, and is often mistaken for ST elevation.  Remember, ST segments are smooth from the end of the QRS to the peak of the T wave.  See the detail illustration.

This ECG is suitable for your classes from beginner level (rate variation in sinus rhythm) through advanced (clinical significance of RBBB in acute M.I.).  It also offers an example of reciprocal ST changes, and of a situation where the inferior leads II, III, and aVF are related to the low lateral leads V5 and V6 by a shared blood supply.

Dawn's picture

Inferior Wall MI With Artifact

This ECG is taken from a 66-year-old man who presented to the Emergency Dept. with a complaint of chest pain.  The ECG shows clear signs of acute inferior wall MI:  ST segment elevation in Leads II, III, and aVF and reciprocal ST depression in Leads I and aVL.  In addition, there are reciprocal ST depressions in Leads V1, V2, and V3.  These indicate that the MI extends up the inferior wall into the area called by most clinicians the posterior wall.  When the injured area extends high enough from the inferior wall, it becomes visible to the anterior-septal leads as ST depression.  There is also a small ST elevation in Leads V5 and V6, the low lateral wall, indicating a common blood supply for the inferior and low lateral walls (usually the right coronary artery).  All of these findings make this a rather "typical" inferior wall MI.

Unfortunately, this ECG also has a significant amount of artifact.  The second, sixth, and tenth "beats"  appear to be  premature beats in Leads I and II.  However, it is important to remember that the four channels on this ECG are run simultaneously.  That is, any complex of significant voltage should show up four times.  The "premature" beats do not appear in Lead III, and do not affect the timing of the appearance of the next beat at all.  They also appear during moments of baseline disruption, indicating that they are not heartbeats, but simply artifact.

Why is this important?  Artifact makes the ECG hard to interpret accurately.  The ECG machine even had a difficult time, completely ignoring obvious P waves, and calling the rhythm "atrial fibrillation".  Every effort should be made to obtain the cleanest, most artifact-free ECG possible.

Additional note:  it can be very informative to do a right-sided ECG on an IWMI patient, or at least a V4Rt.  In fact, it is a protocol requirement in many EMS agencies.  Right ventricular infarction can change the hemodynamics of your patient, causing a need for fluid resuscitation. In fact, a drop in BP, such as that caused by nitroglycerin, can cause circulatory collapse.  Ntg should be given cautiously to RVMI patients.  Fortunately, IV fluids will seldom cause left heart overload in these patients.  A look at the right ventricle with V4Rt can be very helpful in deciding treatment options.

Dawn's picture

Extensive Anterior Wall M.I. With Recent Inferior Wall M.I.

This 88-year-old woman was brought to the Emergency Department in cardiogenic shock.  Very little is known of her past medical history, but it was relayed to the EMS responders that she had been ill for about four days, when she became much worse.

This ECG shows a large, acute anterio-lateral wall M.I., as evidenced by the ST ELEVATIONS in V2 through V6, Leads I and aVL.  To make matters worse, there are PATHOLOGICAL Q WAVES in Leads V2 through V6.  Pathological Q waves indicate areas of necrosis.  Because the myocardium facing the positive electrode is not electrically active, we "see through" the dead tissue to the myocardium on the opposite side of the heart.  Pathological Q waves could be thought of as "reciprocal R waves".  This represents a great deal of dead myocardium, which will be akinetic - not moving.

To make matters worse, she has pathological Q waves in the INFERIOR WALL as well, in Leads II, III, and aVF.  Her ST segments in those leads are flattened and possibly slightly elevated, but not much.  There are no reciprocal ST depressions in I and aVL, because they are affected by the anterior - lateral wall M.I., and are elevated.

The accompanying photos show her left coronary artery angiogram indicating severe coronary artery disease and a "missing" left anterior descending artery.  This is due to a proximal lesion that occurred around the area of the first diagonal artery, cutting off blood flow to a very large part of her anterior-lateral wall.  The photo of the right coronary artery shows a very tight lesion which is allowing some blood to pass.  The Interventionalist felt that this represented a resolving 100% occlusion (remember, she had been sick for four days).  As the blood clot broke up, blood flowed again, lowering the ST segments.  Unfortunately, permanent damage had already been done, and she had Q waves in the inferior wall also.  This leaves very little of her heart beating, and it is easy to understand why she presented in shock.  She suffered cardiac arrests several times during the procedure, and was managed with a balloon pump and ventilator.

Unfortunately, this type of injury is not survivable, and she died in the CVICU a few hours after her procedure. She contributes to our education by demonstrating the cumulative effects of M.I., especially when permanent damage occurs.  For a look at her ventriculogram, to understand the devastating effects of these injuries, go to our You Tube channel.

Pages

All our content is FREE & COPYRIGHT FREE for non-commercial use

Please be courteous and leave any watermark or author attribution on content you reproduce.