
Submitted by Dawn on Tue, 11/17/2015 - 14:38
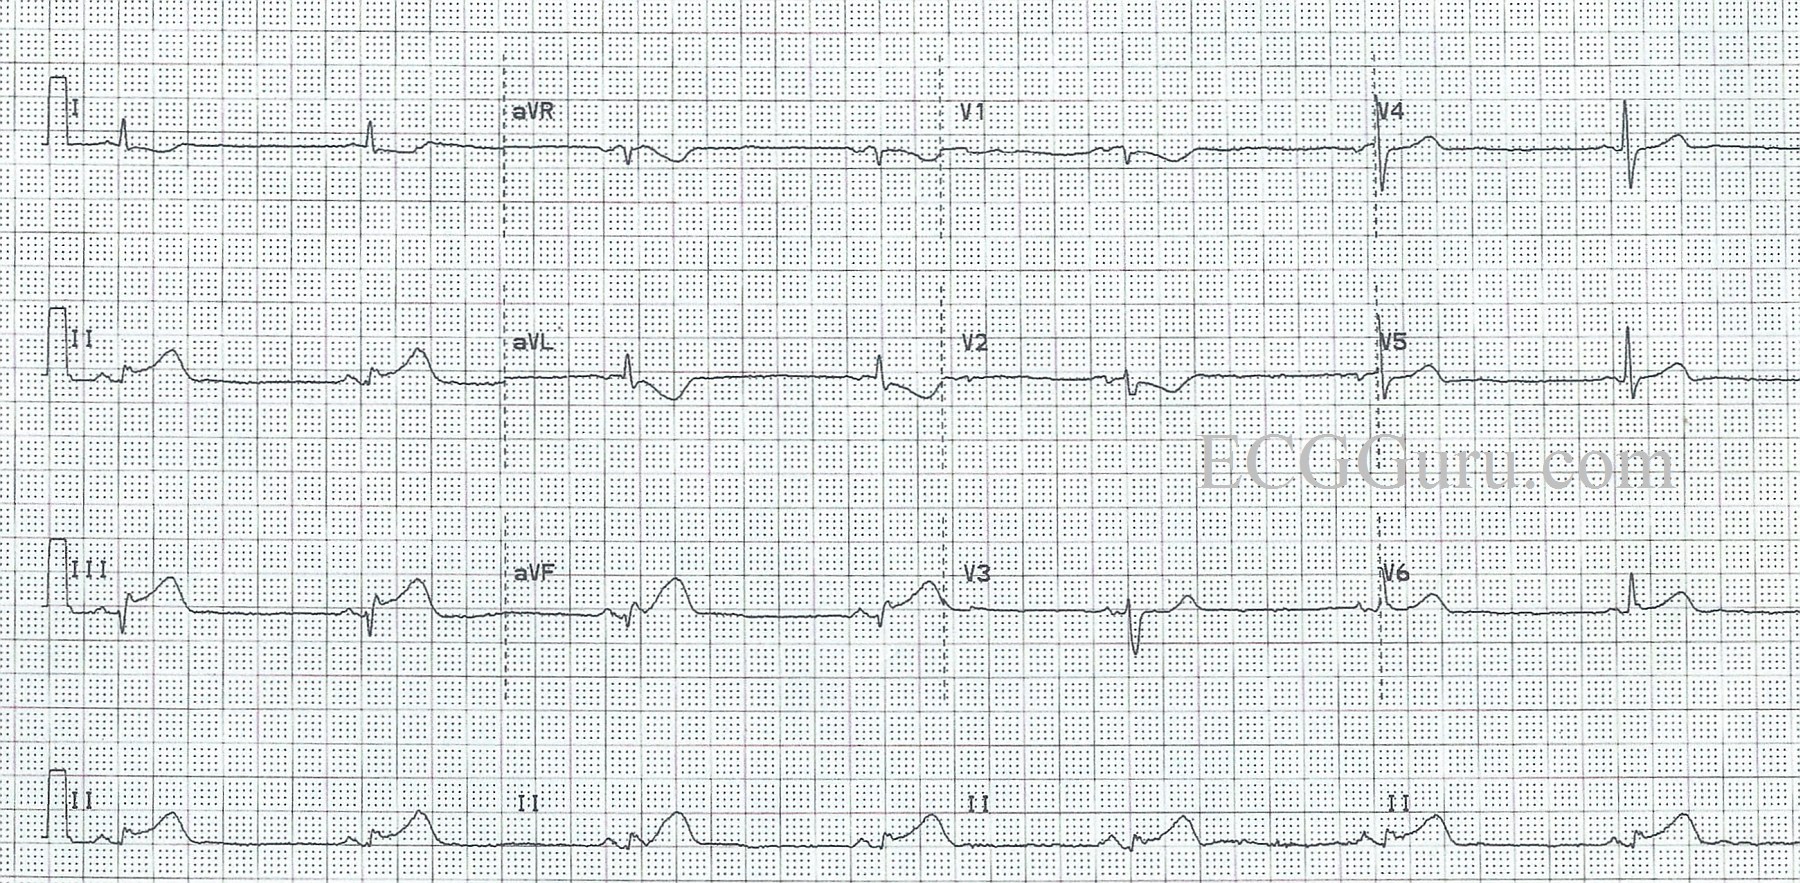
This ECG shows a common manifestation with inferior wall M.I., BRADYCARDIA. We see the signs of acute inferior wall M.I. in the inferior leads: II, III, and aVF all have ST segment elevation. There almost appear to be pathological Q waves in Leads III and aVF. There are still VERY tiny r waves, and the downward deflections are not wide, but should full-blown Q waves develop in these leads, they would signify necrosis in the area. A repeat ECG would certainly be warranted.
Another sign that there is an inferior wall STEMI is the ST segment depression in Leads I and aVL, which are reciprocal to Lead III. ST depression can have many meanings, but when it is localized in the leads which are opposite ST elevation, it is reciprocal. There is also ST depression in Leads V1 and V2. These leads are reciprocal to the POSTERIOR wall, otherwise known as the upper part of the inferior wall. If an inferior wall M.I. is large enough, it can produce ST elevation in the posterior leads (not performed in this case), and ST depression in the anterior leads, especially V1, V2, and V3.
The rhythm is a marked sinus bradycardia, at just under 40 beats per minute. Sinus bradycardia is very common in inferior wall M.I., because the inferior wall and the sinus node are usually both supplied by the right coronary artery. AV blocks can also occur because the AV node is also supplied by the RCA in most people.
It is important to remember that bradycardia does not always need to be treated. In patients with acute M.I., a well-tolerated bradycardia may actually be beneficial to the injured heart, reducing supply/demand ischemia. A well-tolerated bradycardia is a rate that does not produce low blood pressure and poor peripheral perfusion. Some people tolerate rates in the 40’s quite well. If the patient shows signs of poor perfusion: low BP, decreased mentation, pallor, shortness of breath, the rate should be cautiously increased with medication or electronic pacing.
Patients who present with acute inferior wall M.I. should be screened for right ventricular M.I. Right-sided chest leads, especially V3 through V6 can reliably detect right ventricular M.I. Other signs which may or may not be present, and have less accuracy, are: Lead III with higher ST elevation than Lead II, aVL with ST depression of 1 mm or more, and ST elevation in V1 on the 12-Lead ECG. For more about the prognostic implications and treatment of RVMI, we refer you to Drs. Wang and Poponick.
For a more detailed look at this ECG, and a thorough discussion of inferior wall M.I. ECG changes, please refer to the comment below from our Consulting Expert, Dr. Ken Grauer, MD.
Rate this content:
All our content is FREE & COPYRIGHT FREE for non-commercial use
Please be courteous and leave any watermark or author attribution on content you reproduce.
Comments
Acute Inferior MI with Bradycardia
Although there unfortunately is no history — this week’s case provides an excellent teaching example of acute Inferior STEMI. I’d add the following points:
As per Dawn — the rhythm is sinus bradycardia at a rate of ~ 40/minute. It is good to appreciate that if the patient shows signs of hemodynamic compromise — that the presence of a supraventricular rhythm during the early hours of acute inferior infarction is the situation most suited for a beneficial response to cautious use of atropine. On the other hand, if blood pressure and perfusion are adequate, and the patient is comfortable without chest pain — then treatment of bradycardia will often not be needed.
It is surprisingly difficult to determine if there is or is not a Q wave in lead III … I agree with Dawn that a small initial positive deflection (r wave) does appear to still be present in lead III at least. There may be a Q wave in lead aVF. That said — assessment of ST-T wave changes in this case are probably much more important than debate on whether inferior Q waves are or are not yet present.
Inferior ST-T wave changes look “hyperacute”. By this, I mean that the T wave in each of the 3 inferior leads looks taller-than-it-should-be given the relatively small amplitude of the QRS complex in these leads. In addition — the peak of the T wave in these 3 leads looks “fatter” than-it-should-be. Thus, even though we do not have any clinical information — I’d guess we are within the very early hours of this acute infarction.
There is a special inverse relationship regarding ST-T wave changes in leads III and aVL. That is, the ST-T wave in one of these leads almost invariably manifests a “mirror image” of the other lead. This relationship is so consistent — that absence of reciprocal ST depression in lead aVL should make one question a diagnosis of acute inferior MI. Note how in this case that the ST depression we see in aVL (down to the relatively “fat” inverted T wave peak) is the precise mirror image of what we see in lead III. This supports how early we are likely to be in this patient’s course.
On the other hand — lead I does not invariably manifest reciprocal ST depression with inferior infarction. When we do see ST depression in lead I (as we do here) — it is a soft sign that there may be right ventricular involvement. That said, the lack of ST flattening or elevation in lead V1 in this tracing is against right ventricular involvement (although right-sided leads would be needed to know for sure if there was or was not right ventricular involvement).
The pattern of ST-T wave change with inferior infarction can often help to predict the likely “culprit artery”. Approximately 80-90% of patients have a right-dominant circulation — vs ~ 15% of patients who have a left dominant circulation. Some patients have co-dominance. Acute RCA occlusion becomes more likely when the amount of ST elevation in lead III exceeds that in lead II — when there is marked reciprocal ST depression in lead aVL — and especially if there is indication of right ventricular involvement. In contrast, occlusion of a dominant left circumflex artery may be suggested when ST elevation is greater in lead II than in lead III — when there is less reciprocal ST depression in lead aVL — and when there is significant ST elevation in lateral chest leads (V5,V6) — especially if ST elevation in V6 is more than in lead III. My guess in this case would be that there is an acute RCA occlusion. Although it is admittedly difficult to say if ST elevation is more in lead III than in lead II — there IS significant ST depression in aVL; and RCA occlusions are much more common than are circumflex occlusions.
Of note — anterior ST depression in this tracing is modest and limited to leads V1,V2. This suggests that there is some posterior involvement, although less than is seen in many acute inferior infarctions. So my guess would be that there is a mid-RCA occlusion, since with proximal RCA occlusion one would expect to see much more ST depression leads V2,V3 — as well as a flat or slightly elevated ST segment in lead V1. The reason for this ST appearance in lead V1 is that most of the ST depression that would have been seen by posterior involvement is cancelled out by the ST elevation seen in right-sided lead V1 from acute right ventricular involvement.
Ultimately, the only way to know for sure what the “culprit artery” is, would be with cardiac catheterization. But recognition of ECG findings consistent with certain anatomic patterns makes one a better diagnostician, as well as making the process that much more interesting.
===============================
FOR ADDITIONAL READING: Click on the links for additional reading on acute RV infarction — posterior infarction — distinction between RCA vs Circumflex as the “culprit artery” —
Ken Grauer, MD www.kg-ekgpress.com [email protected]