Displaying 1 - 5 of 5
Dawn's picture

Sinus Rhythm With Ectopy

We originally published this ECG in 2012.  It was generously donated to the ECG Guru website by our friend and ECG Guru Extraordinaire, Jason Roediger.  We are re-publishing it today, as it is a great ECG for illustrating how helpful laddergrams can be for showing conduction in dysrhythmias.

This ECG has something for everyone:  The rhythm is sinus, and there is a non-conducted PAC (beat number 3) after the second beat.  Just after the next P wave, there is a ventricular escape beat which prevents that P wave from making a QRS.  The eighth beat is a PVC.  The eleventh is a conducted PAC.  You can use this ECG to illustrate for your students the concepts of "escape" beats, refractory periods, and premature beats.

There are ST changes that suggest coronary artery disease: the ST segments are flat in shape with a tiny amount of elevation in V1 through V4.  The axis is normal, at the border of normal and left axis. It is difficult to see, but there appears to be a tiny r wave in Lead III, so we cannot say for sure if there is or was a pathological Q wave in that lead.

The P waves are wide and "double" in Lead II and biphasic in V1, suggesting LV failure or mitral valve disease.  However, the criteria for LV hypertrophy are not met.

Dawn's picture

ECG BASICS: Sinus Rhythm With Ventricular Bigeminy

Nice, clear example of ventricular bigeminy with an underlying sinus rhythm.  We do not know from this strip if the sinus rhythm is a bradycardia at a rate of about 42 per minute, or if the underlying sinus rhythm is actually at a rate of 85 per minute, with every other sinus beat inhibited by the occurance of a PVC.  In the first possibility, the ventricular beats would be considered "escape" beats, positively contributing to the patient's heart rate.  In the second instance, the rather late-occurring PVCs would cause the heart to be refractory, preventing the sinus P wave from conducting it's impulse to the ventricles.   Sometimes, we can see signs of the sinus P wave "hiding" in the PVC, but in this case, if P waves exist, they fall almost exactly in the middle of the ventricular beats' QRS complex, making them invisible.  A good strategy would be to watch the strip continuously for some time, hoping to catch the conduction of two sinus beats in a row, solving the dilemma.

Dawn's picture

Inferolateral M.I.

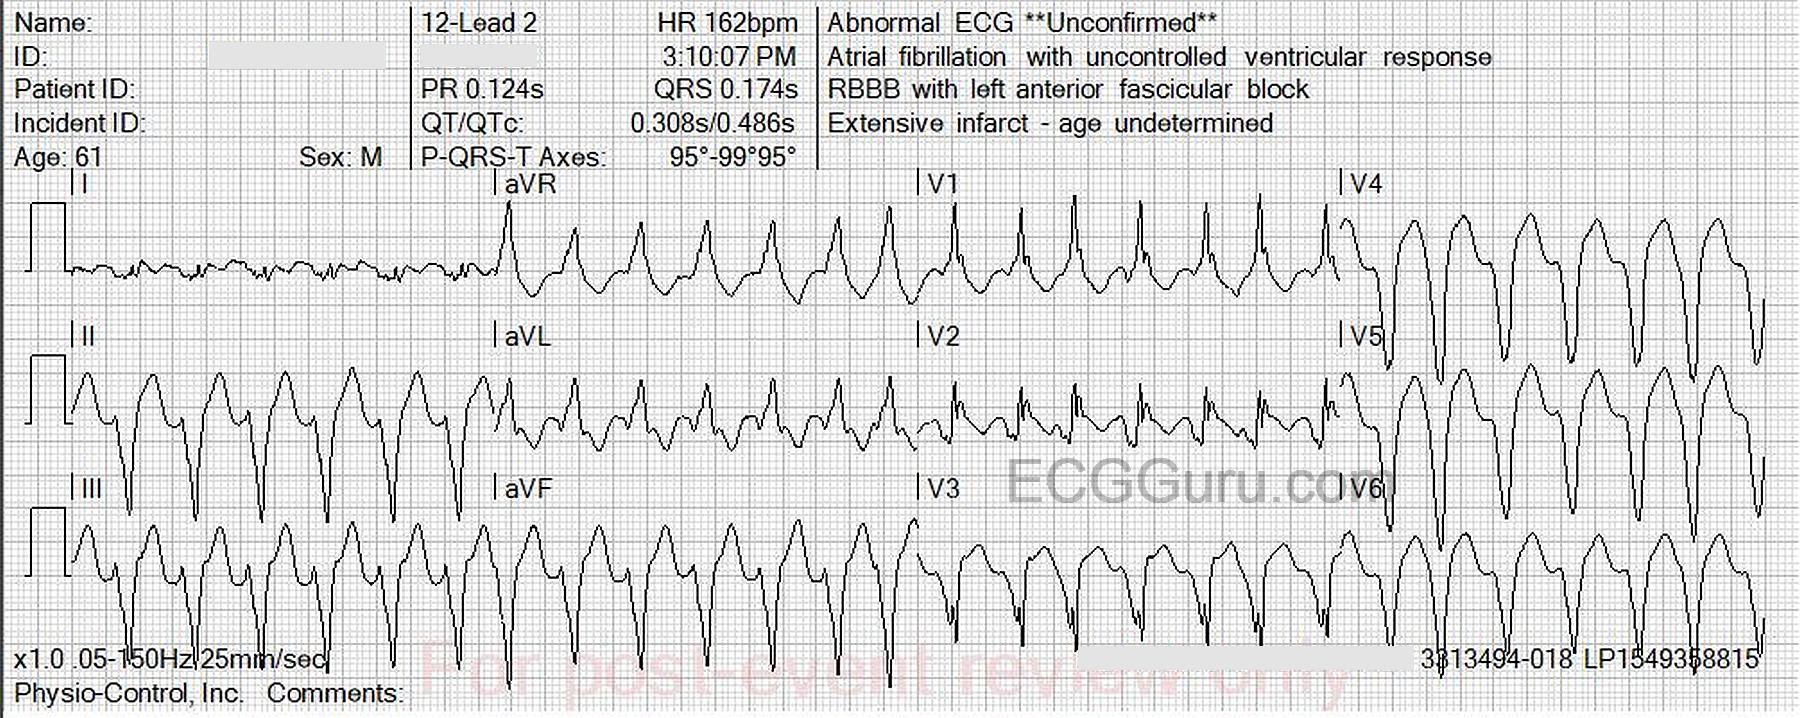
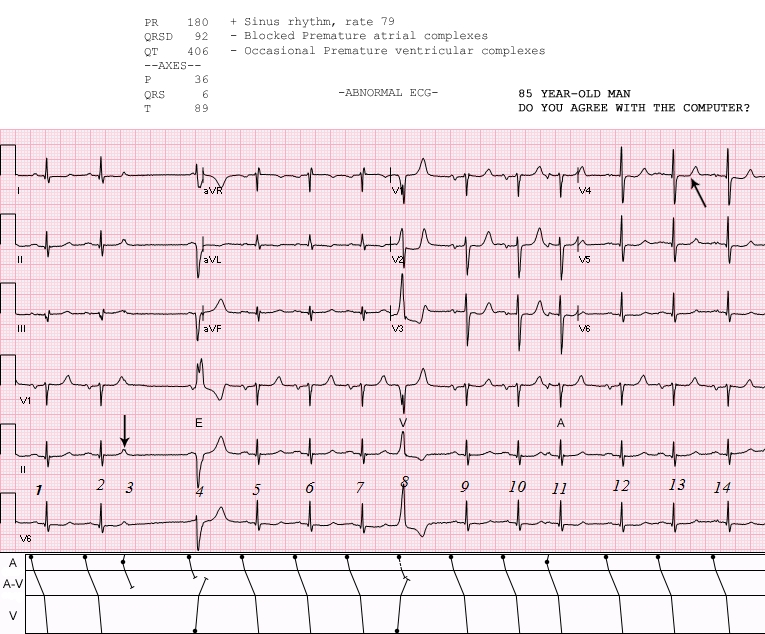
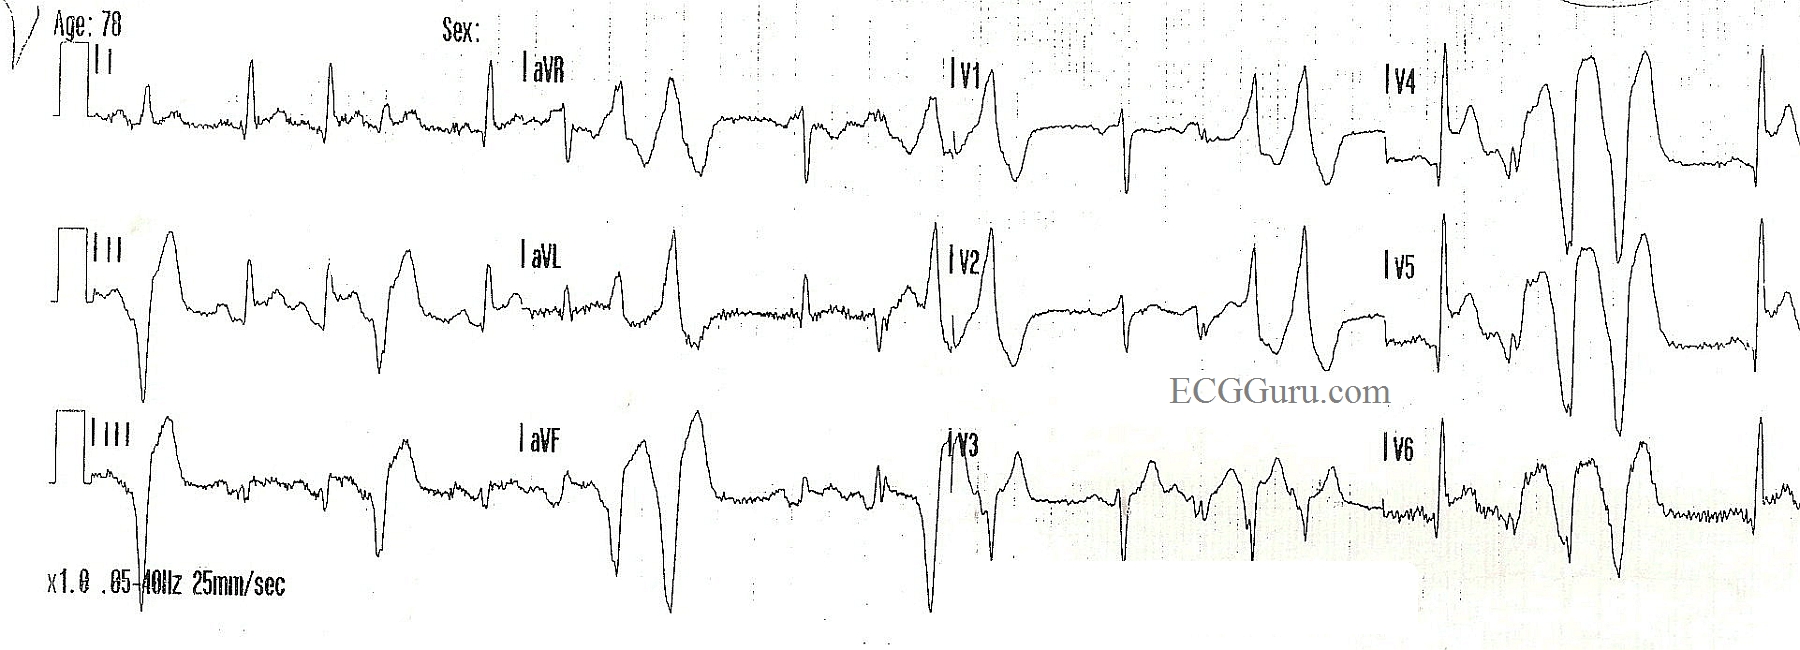
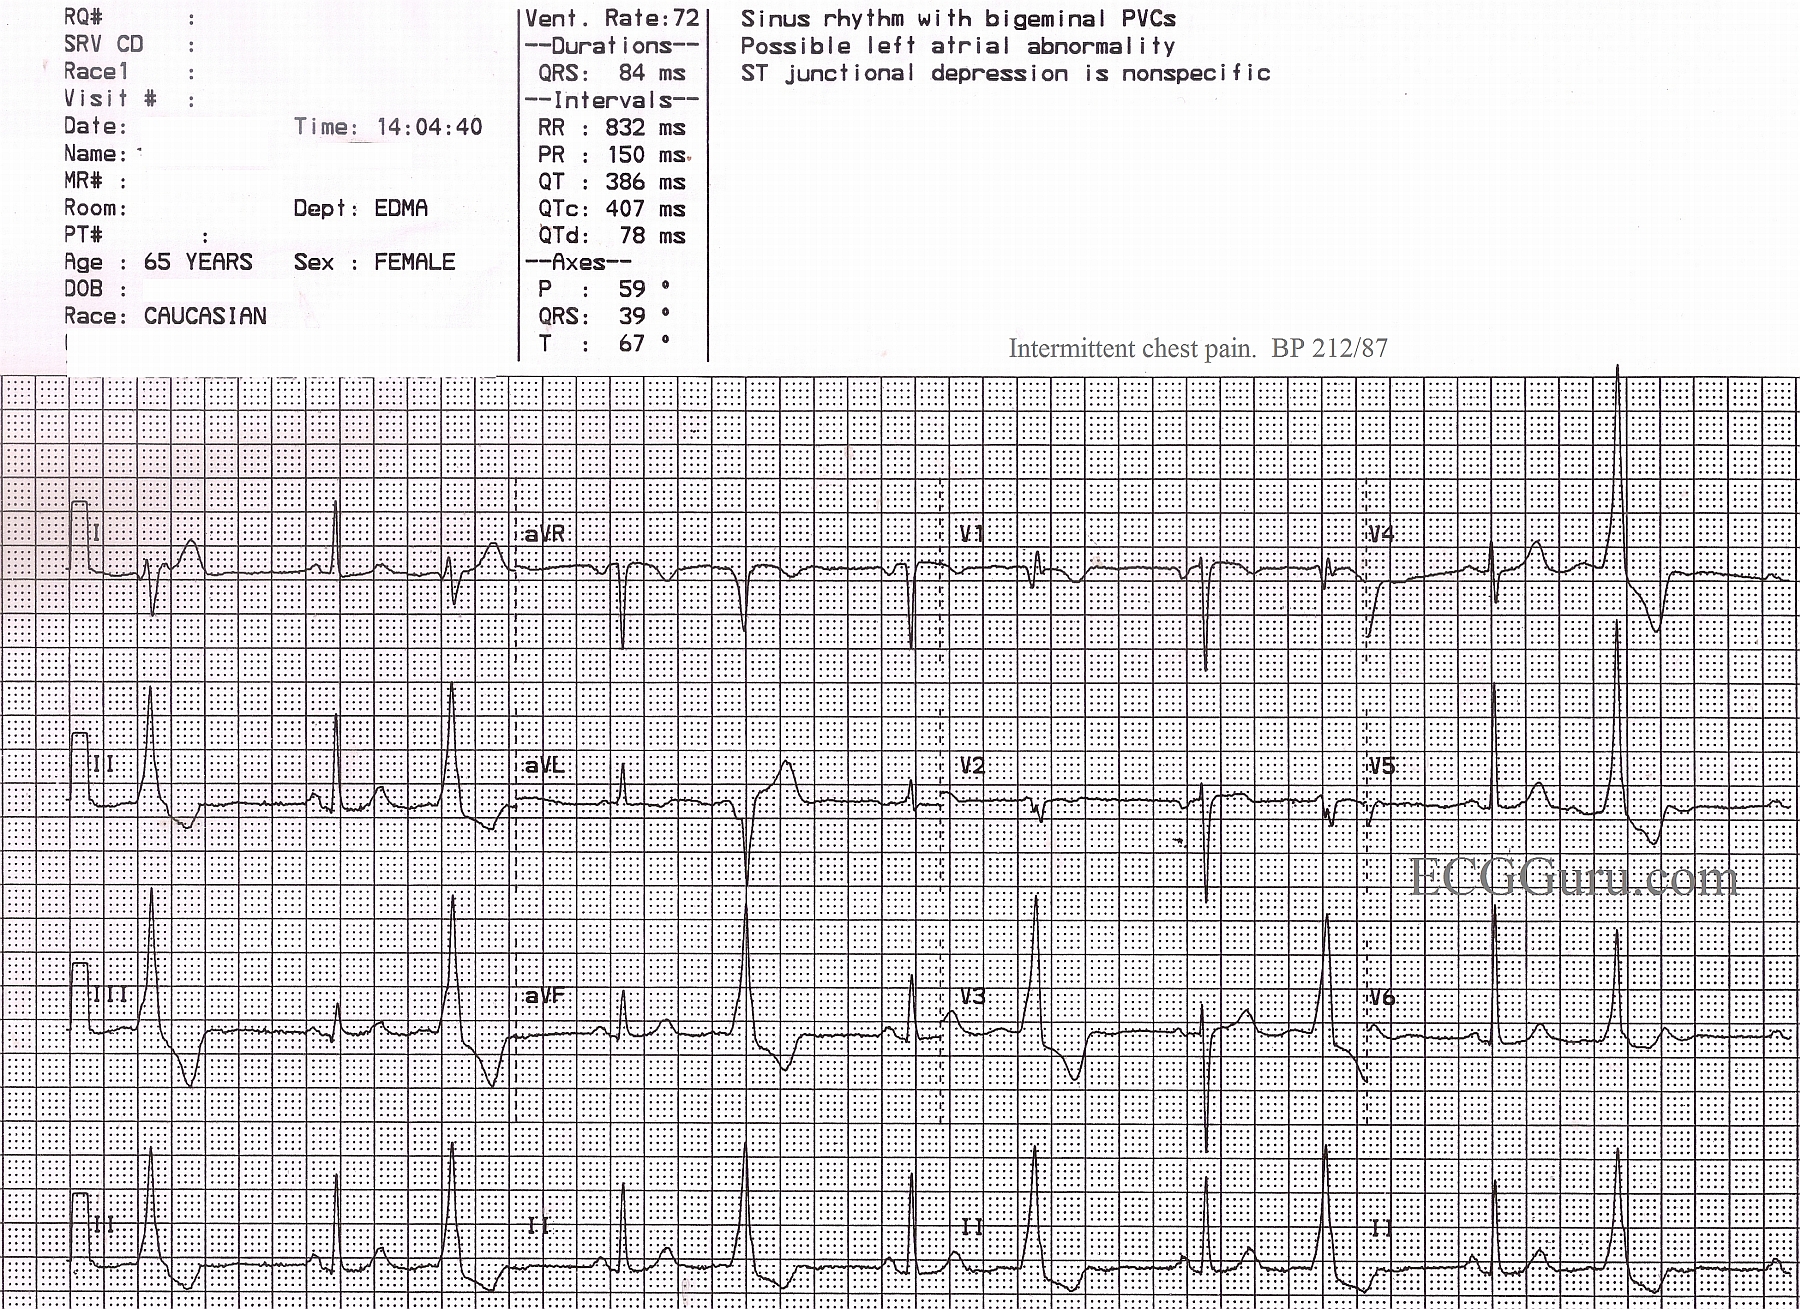
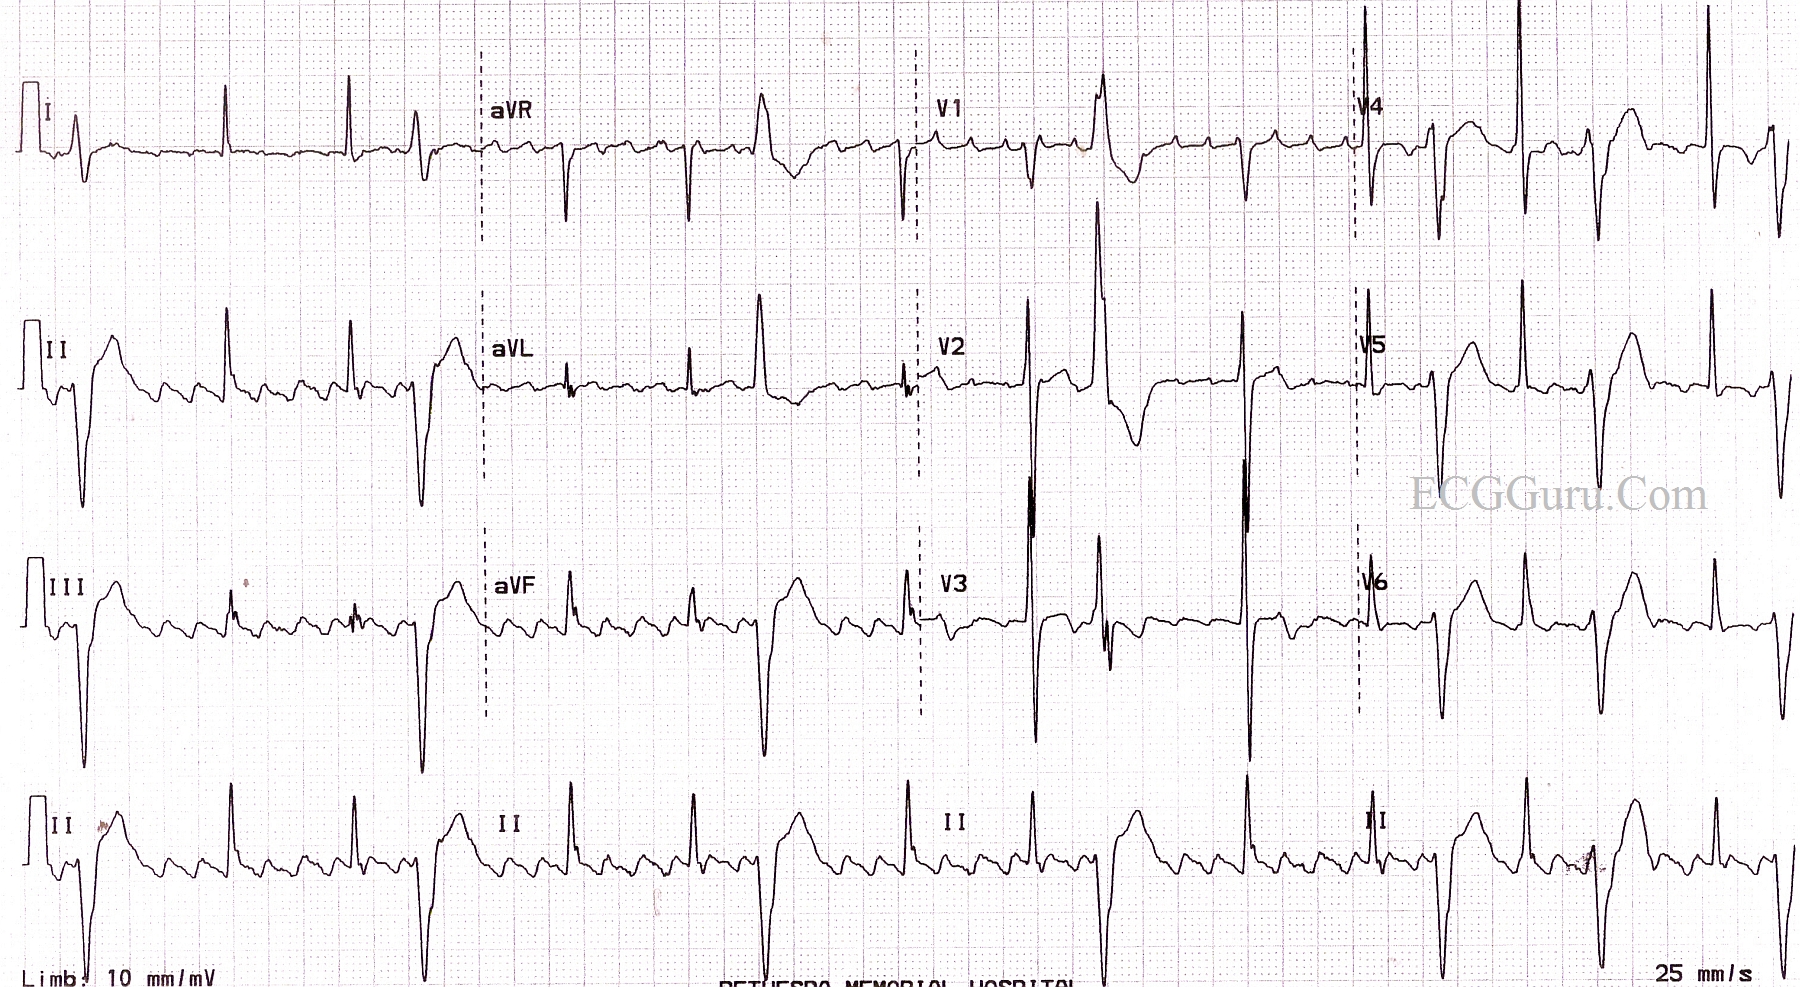
Unbelievably, this inferolateral ST elevation M.I. was missed by the treating paramedics in the field.  An elderly woman stepped off a curb and was hit by a very slow-moving car.  She fell and sustained a Colle's fracture of the right wrist. While the paramedics assessed her, she complained of chest pain, prompting them to perform a 12-Lead ECG.  The machine's interpretation called attention to the inferior and lateral walls' injury pattern, but the paramedics did not believe it, because "she was a trauma patient". They ran three ECGs, and still did not agree with the machine.

The patient was transported to a hospital without an interventional cath lab, and she was forced to endure a one-hour wait to be transferred to an appropriate hospital.

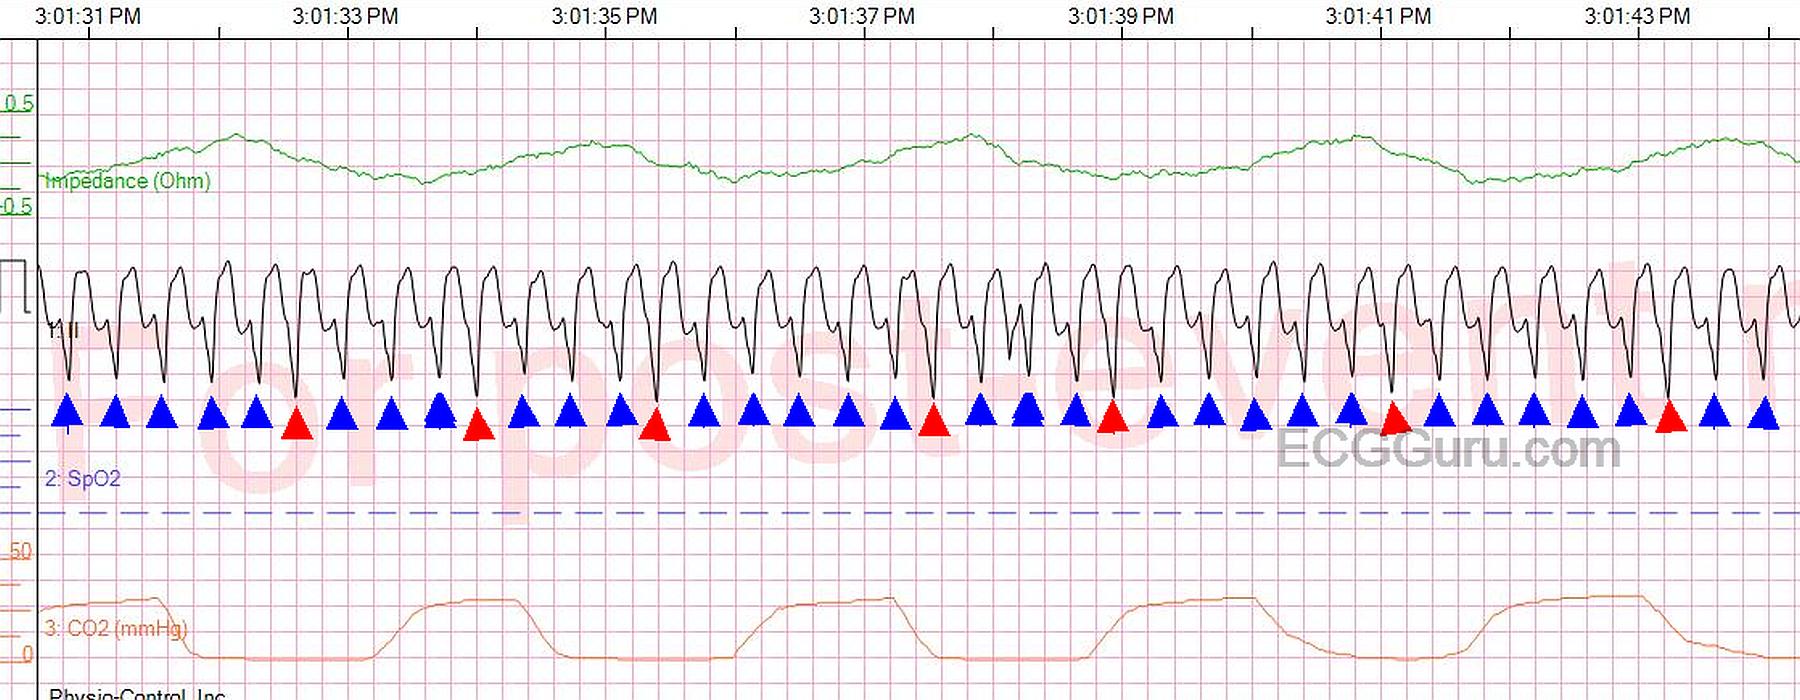
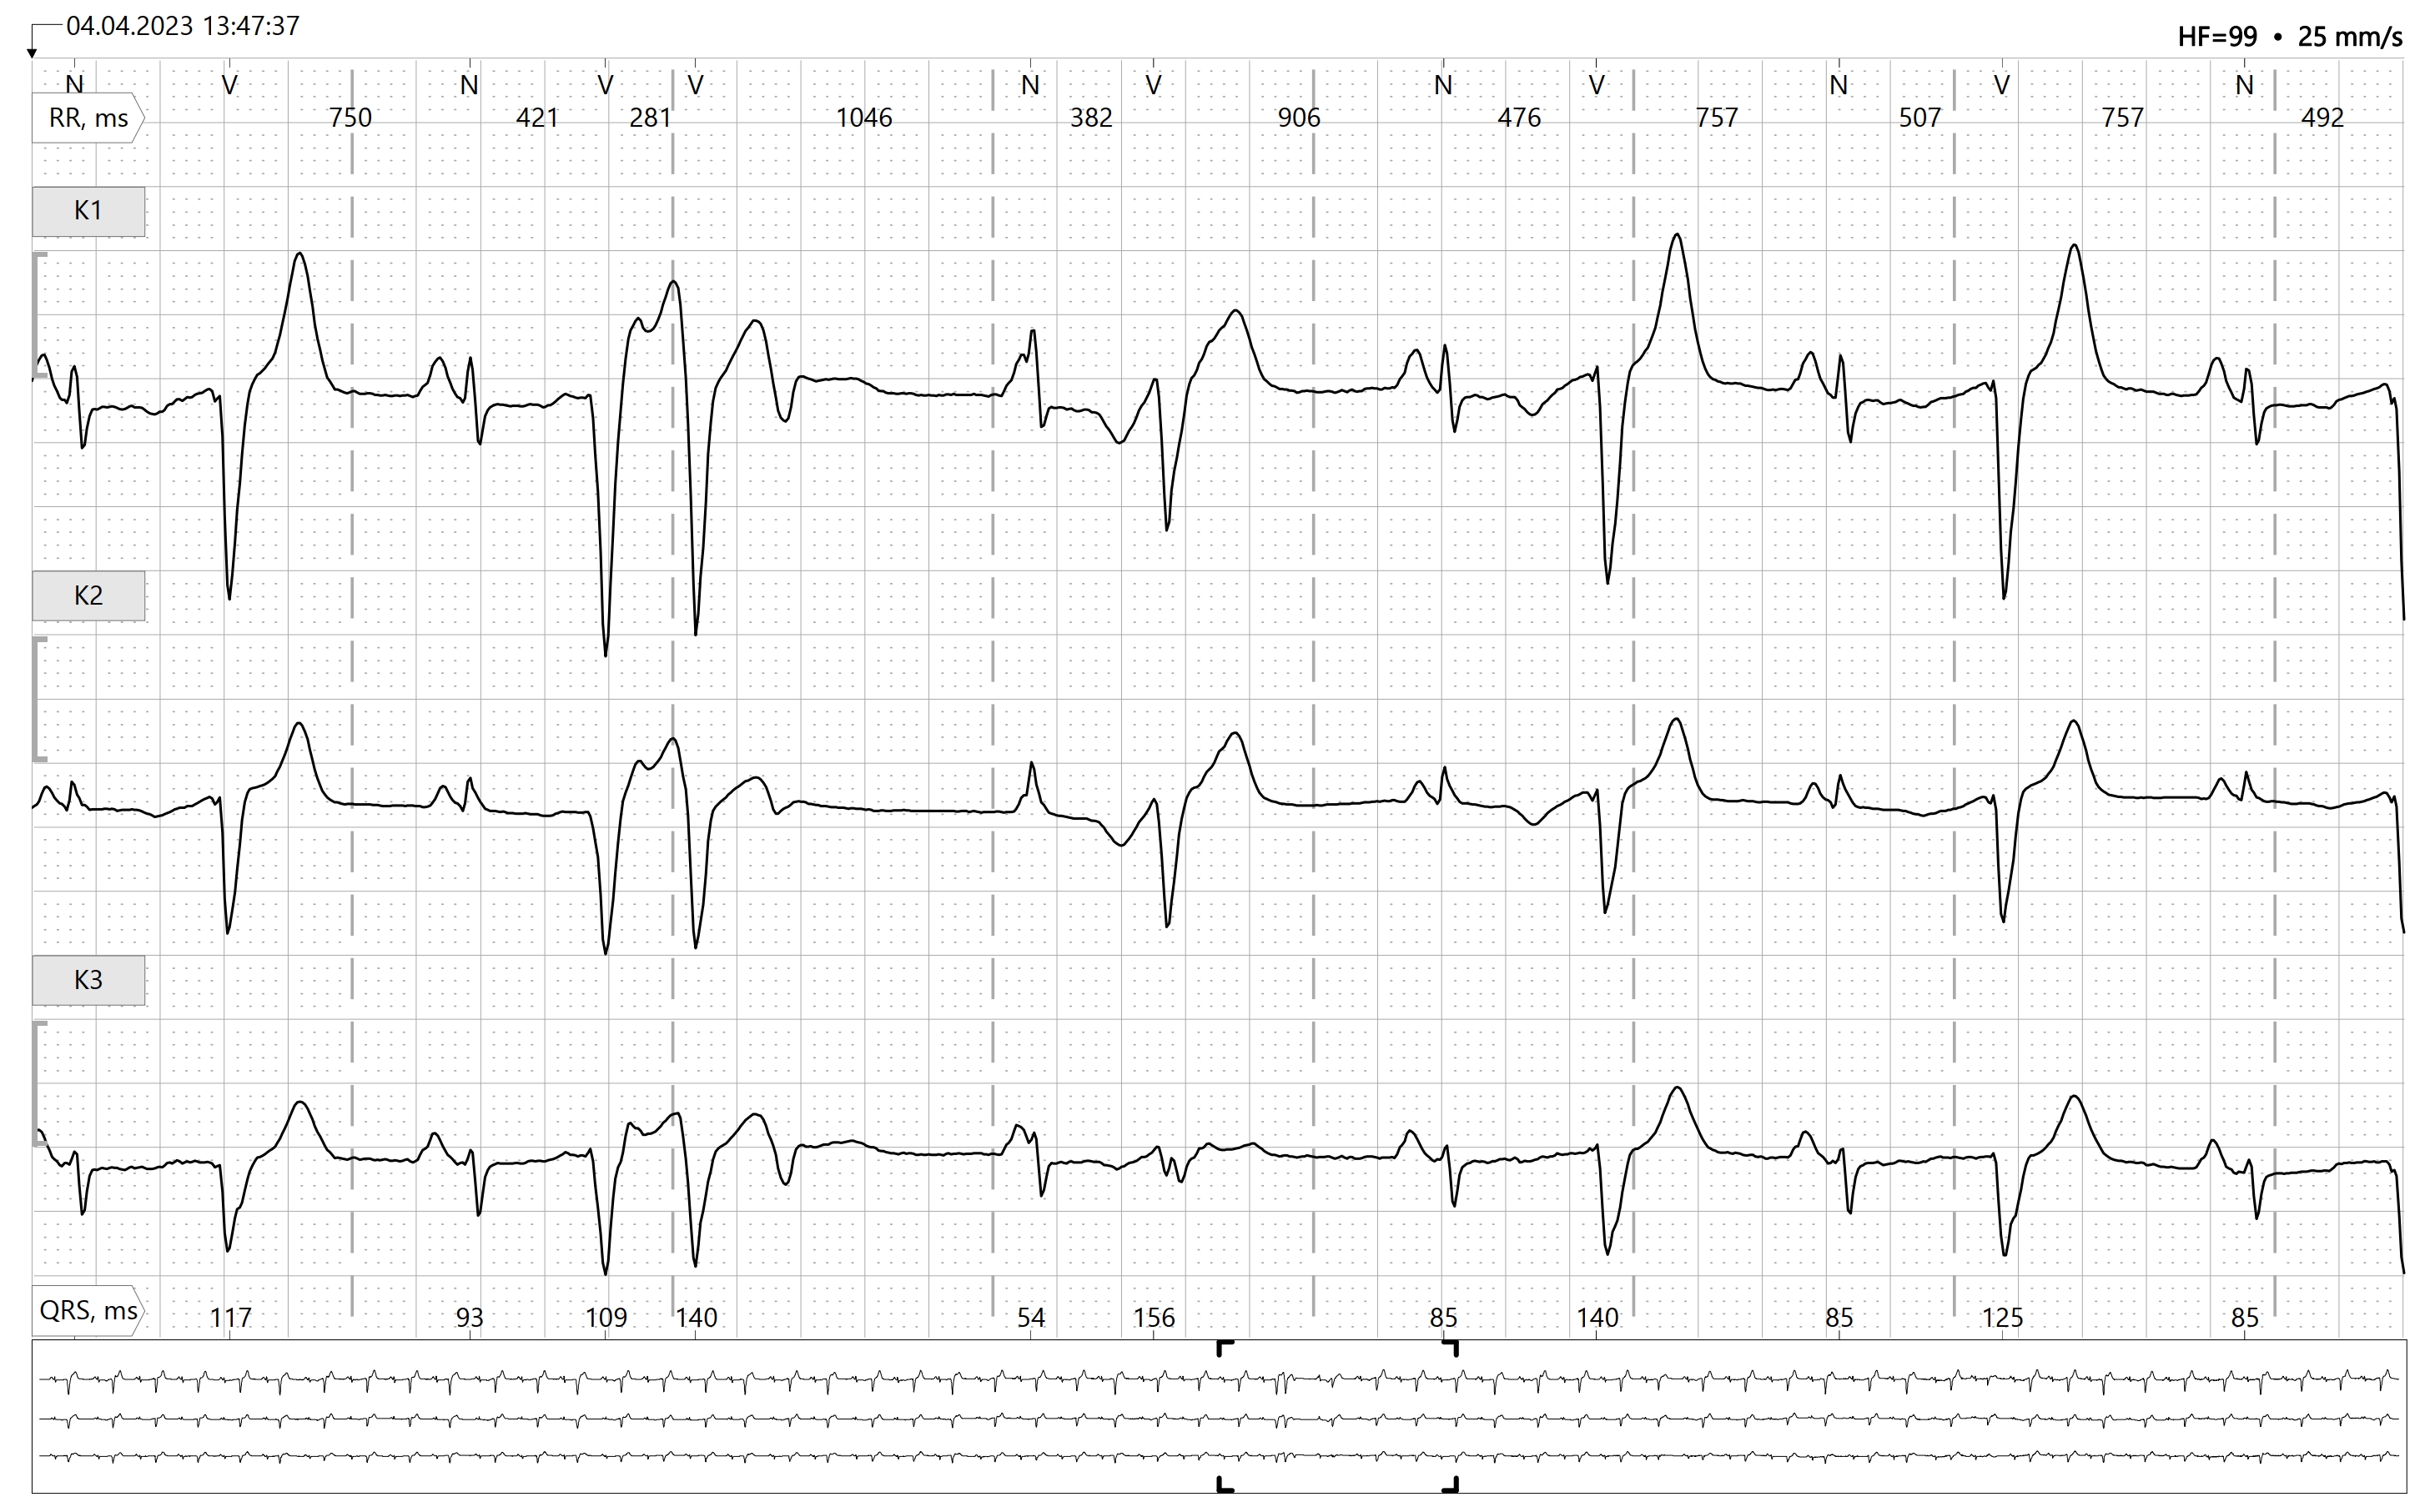
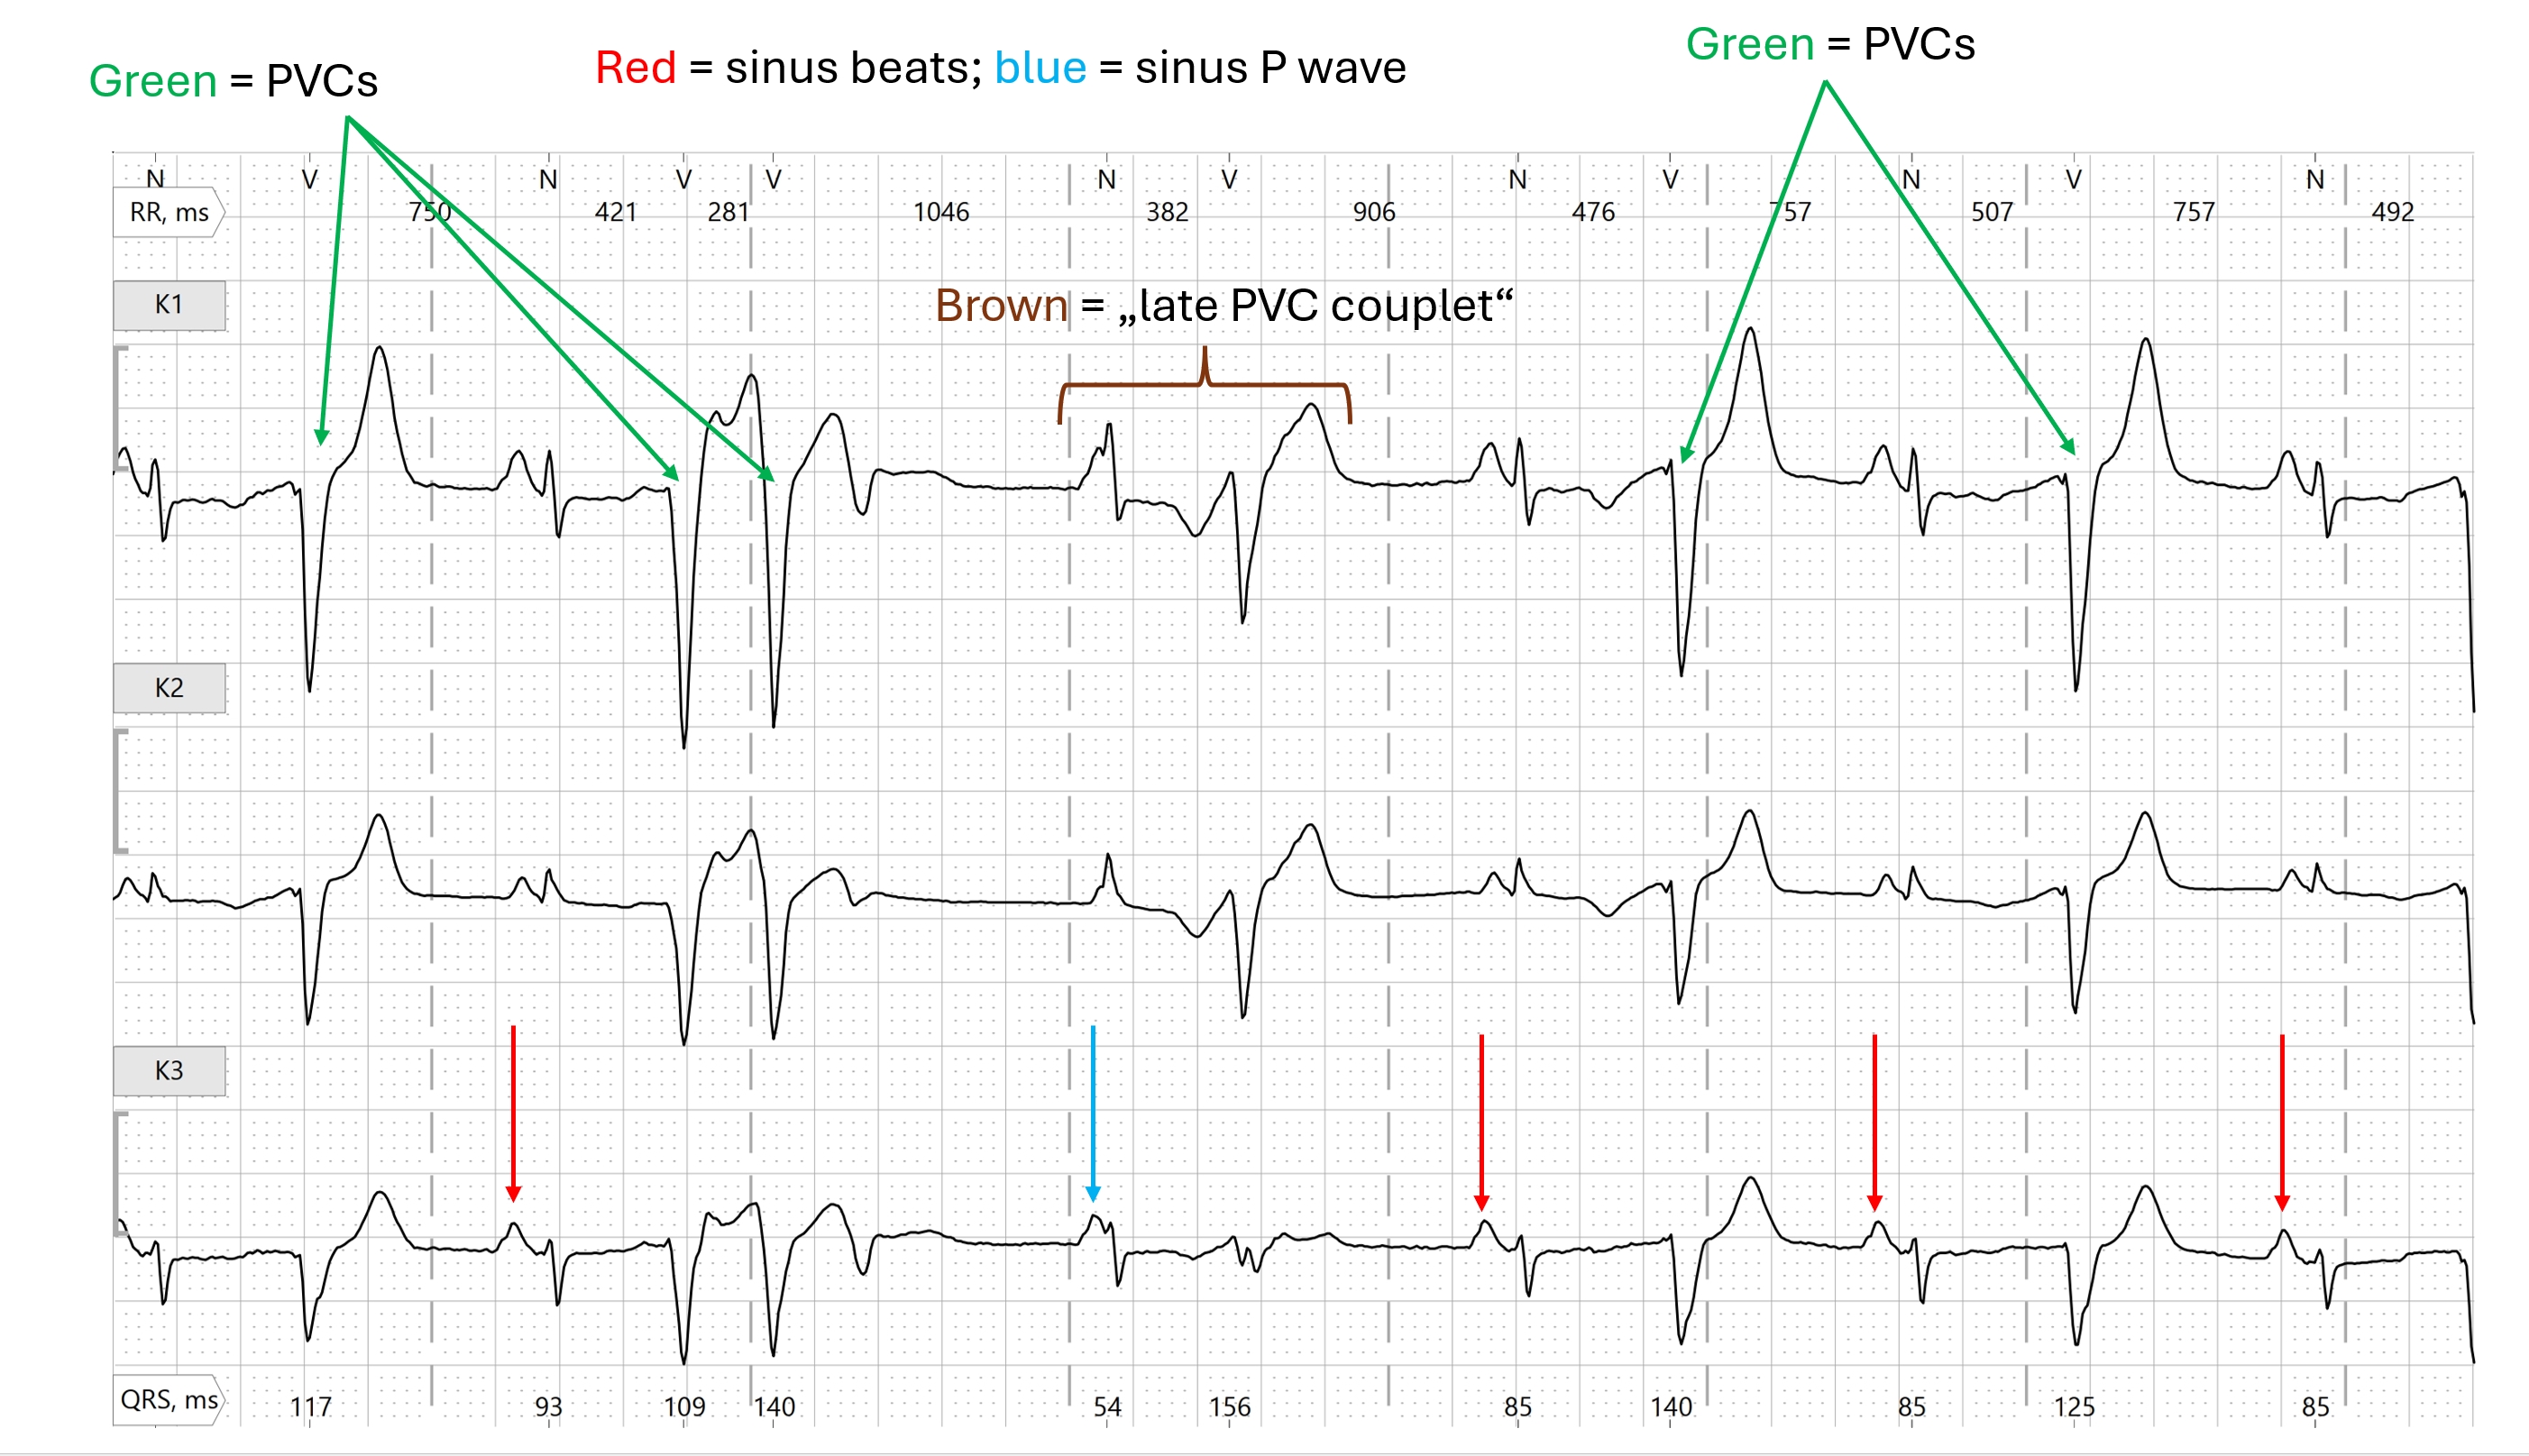
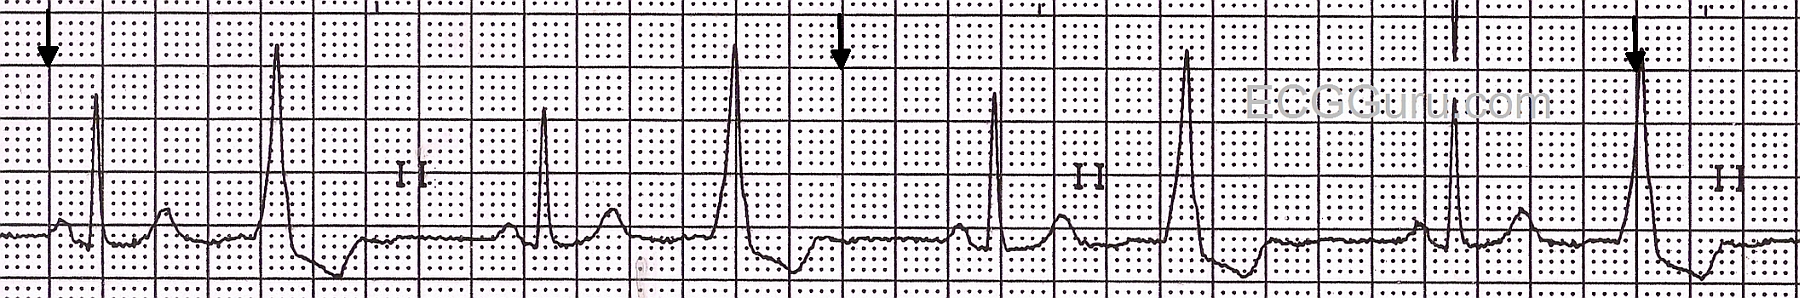
This is a great ECG for a discussion with your students about "distractors".  The call came in as a trauma, so that, in itself, was a distractor.  The rescuers saw what they expected to see. The angulated fracture distracted them - putting them into full trauma assessment mode.  Then, the frequent and coupled PVCs also distracted them, possibly making it more difficult for them to evaluate the ST segments in the normal beats.  Interestingly, the second and third ECGs did not have PVCs, and the ST elevation was even more clear.

PVCs which are repeating themselves in groups of two, three, or more are sinister in a chest pain patient, and may indicate LV dysfunction. They could possibly result in ventricular tachycardia, which would be disasterous for this patient.

Dawn's picture

Sinus Rhythm With Ventricular Bigeminy

This is a nice example of sinus rhythm with ventricular bigeminy in a patient with intermittent chest pain and hypertension.  The underlying rhythm is most likely normal sinus rhythm, but every other sinus P wave is most likely hidden in the PVCs, and not conducted due to the refractory state of the ventricles after the PVCs.  Often, signs of the "hidden" P waves will show in some leads, but that is difficult to demonstrate here.

It may be difficult to be sure of an adequate underlying rate, so the PVCs should not be eliminated with antiarrhythmic drugs until there is some ECG sign of a normal underlying rate.

Remember, the fourth channel on this ECG is a Lead II rhythm strip.  So, if you teach rate and rhythm monitoring, and don't want to use a 12-Lead ECG for your students, simply crop the bottom strip for your class.

Dawn's picture

Atrial Flutter With PVCs

This ECG shows a nice, clear atrial flutter with 4:1 conduction.  Also, there are frequent PVCs. Good for students who have mastered the criteria for the basic arrythmias and who need to see combinations.  That is, PVCs are not only seen with NSR, and it is important to state the underlying rhythm.  For your more advanced students who understand how to plot frontal plane axis, the axis of the PVCs is nearly straight up - a very strong argument for the ventricular origin of the beats.

All our content is FREE & COPYRIGHT FREE for non-commercial use

Please be courteous and leave any watermark or author attribution on content you reproduce.