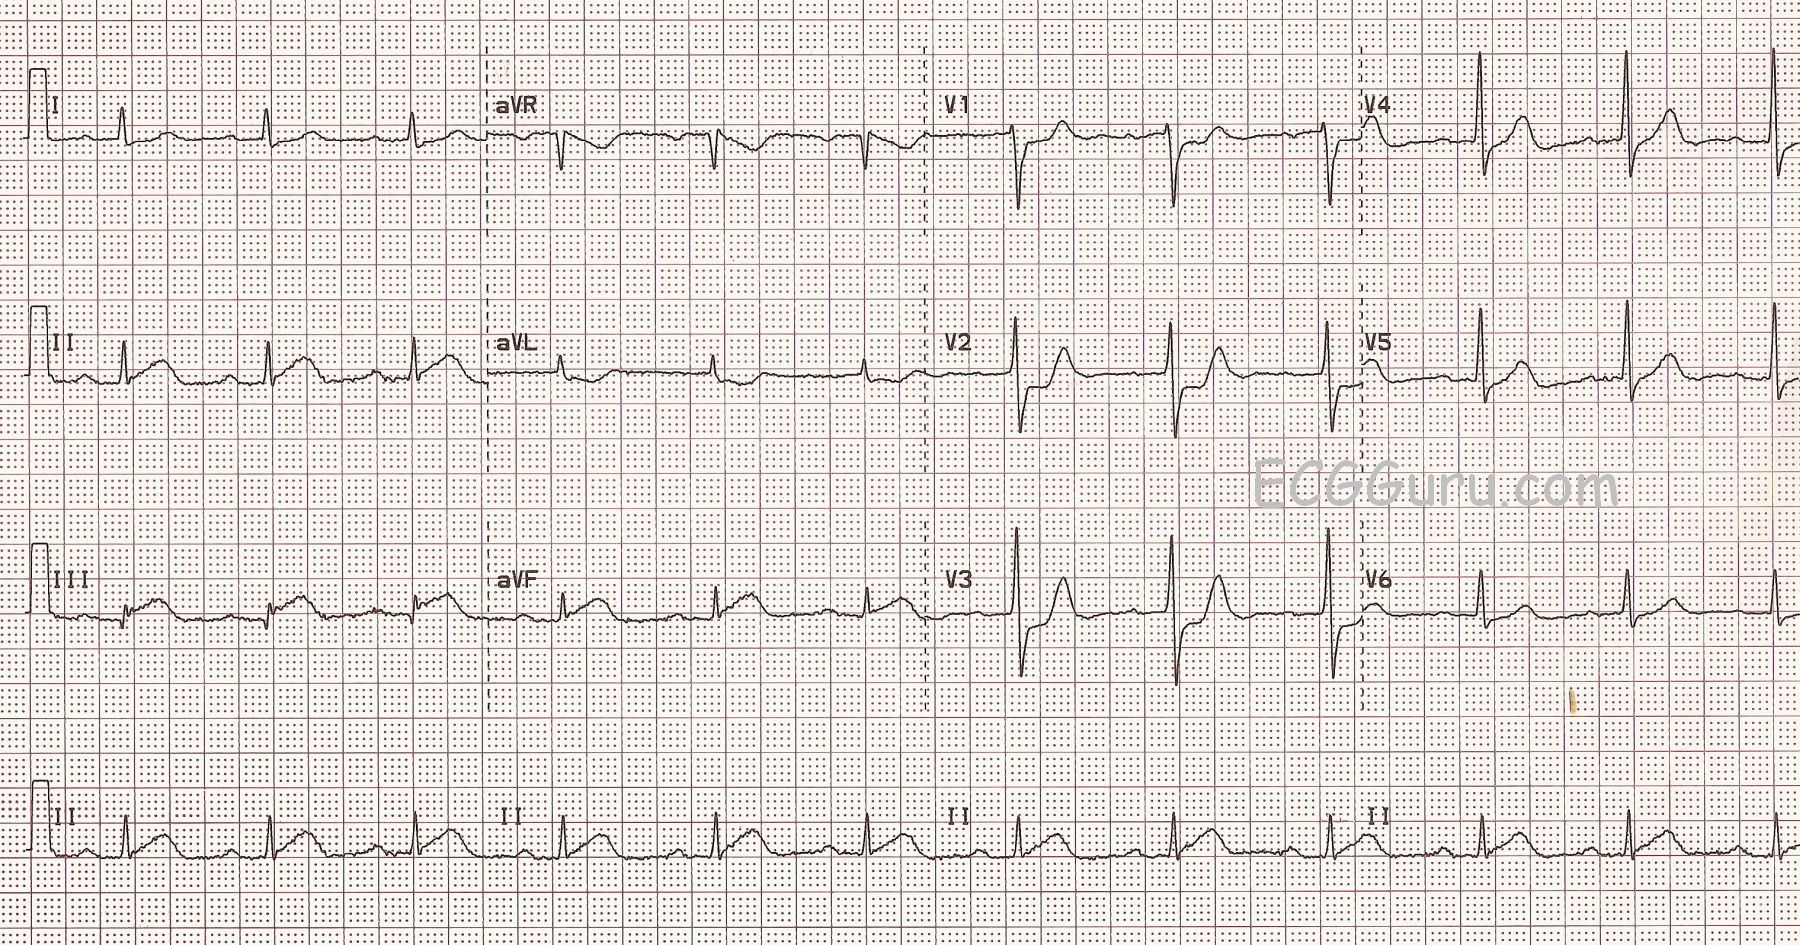
This ECG is a good example of an inferior wall M.I. that was confirmed and treated in the cath lab.
The ST segments are elevated in Leads II, III, and aVF, but the amount of elevation may look subtle to some. When the amount of elevation seems small, what other signs can help us recognize acute ST-elevation M.I.?
PATIENT HISTORY AND PRESENTATION This patient had acute chest pain, and was over the age of 50. We do not know his past medical history. His chest pain was described as substernal and epigastric, radiating to his back. He had nausea and diaphoresis. His past medical history is unknown, but it would be significant if he had a history of coronary artery disease, past M.I., smoking, metabolic syndrome, strong family history of heart disease, etc.
ST SEGMENT ELEVATION DISTRIBUTION In acute STEMI, the elevation will be seen in “related leads”. That is, the leads that are affected will reflect a region of the heart that is supplied by the same artery. Some M.I.s are larger than others, affecting more leads, because some obstructions are more proximal than others in the artery. This ECG shows STE in the inferior wall leads: II, III, and aVF. The culprit artery for this patient was the right coronary artery, which supplies the inferior and posterior wall of the left ventricle, the right ventricle, and the right atrium in the majority of people.
RECIPROCAL ST DEPRESSION Finding reciprocal ST depression in the leads that are OPPOSITE the affected leads is a very reliable sign to confirm that the STEs are due to an acute M.I. In fact, often the reciprocal depression is “stronger” or easier to see than the elevation. It is important to teach your students how the standard leads are oriented to the heart, so they will recognize the 12-Lead ECG as a “map” of the heart. The reciprocal ST depression in this ECG is seen in Leads aVL and I (subtle), which are across the frontal plane from Lead III. We also note reciprocal ST depression in the precordial leads, especially notable in Leads V1 through V3. This can reflect the injured area extending up the back of the heart from the inferior wall (posterior wall). The R waves in V2 and V3 are a bit higher than normally expected, which could indicate a reciprocal view of pathological Q waves on the posterior wall. Print the ECG out on paper, turn it upside down, and look at V2 and V3 through the back. V2 and V3 will look like a “classic” STEMI. This should be approximately the view you would get from additional posterior leads.