Displaying 1 - 10 of 67
Dawn's picture

Acute Anterior-lateral STEMI

The Patient:  A 60-year-old man at work. He experienced a sudden onset of substernal chest pain, nausea & vomiting, and dizziness.  He states the pain is a 5 on 1-10 scale.  No cardiac history or current medications. 

The ECGs:  The first ECG, taken at 12:30:05, shows a sinus rhythm with ventricular bigeminy. In some leads, you can see the sinus P waves hidden in the beginnings of the PVCs, so we know the underlying sinus rhythm is about 82 bpm.

There is obvious ST elevation in V1 through V5, which is the anterior wall, an area perfused by the left anterior descending artery.  Remember – the ST elevation sign may also show in the PVCs, but because ventricular beats have secondary ST changes of their own, we should assess only the sinus beats for ST changes. 

There is also obvious ST elevation in Leads I and aVL.  This is the high lateral wall, which is perfused by the circumflex and first diagonal arteries, both proximal branches of the left coronary artery.  So, the involvement of the high lateral wall indicates a proximal lesion in the LCA – not good.  Leads III and aVF have distinct ST depression – this is a reciprocal change reflecting the ST elevation in Leads I and aVL.

Dawn's picture

Inferior Posterior Wall M.I. In Cabrera Format

Does something about this ECG look "different" to you?    This ECG shows a “classic” presentation of inferior-posterior M.I. when it is caused by a lesion in the right coronary artery (RCA). There are ST elevations in leads II, III, and aVF.  Reciprocal ST depression is seen in Leads I and aVL.  There is also reciprocal ST depression in Leads V1 – V3.  These more rightward anterior leads are reciprocal to the posterior (or posterior-lateral) wall, so the ST elevation is actually posterior.  Another sign that this is an RCA lesion is that the ST elevation in Lead III looks worse than the STE in Lead II.  It would be helpful to check the right precordial leads, or at least V4 Right, as elevation there would indicate right ventricular M.I. 

Depending on how experienced you are at evaluating ECGs, you might have immediately noticed something “different” about this tracing.  It is printed in Cabrera format, which groups the leads (viewpoints) more geographically than a traditional ECG does.  In addition to grouping the leads more geographically, instead of aVR, the machine records - aVR.  That reverses the negative and positive poles of aVR, putting the positive ("seeking") electrode at 30 degrees - halfway between Leads I and II.   Those of us who have been looking at ECGs for decades often feel a bit disconcerted by this format, because we have developed almost an intuitive way of seeing the ECG as a “map”, and this rearrangement thwarts our brains’ approach to the ECG.  I would imagine, however, that this might make interpretation a bit easier for someone who is not prejudiced by the standard way of printing.  This method is especially helpful when looking for inferior wall M.I., as we see here, because the lateral leads are together in a row, and the inferior leads are grouped together. 

Dawn's picture

Severe Triple Vessel Disease

The Patient:   This ECG is from a 63-year-old man who complained of epigastric pain for three hours. The pain was sudden in onset, burning in nature, and accompanied by nausea and palpitations.  The patient is a heavy smoker, diabetic and hypertensive with a long history of non-compliance to his medications. 

He was given crushed aspirin, loaded with clopidogrel and heparin, given high-intensity statins, and rushed to the cath lab. 

The ECG:  The rhythm is normal sinus, a bit fast at 90 bpm.  The intervals, frontal plane axis, and R wave progression are normal.  This ECG shows a very dreaded pattern:  ST segment elevation in aVR and V1 with widespread ST depression, seen here in all other leads.  This is an ECG sign of GLOBAL ISCHEMIA.  There are several possible causes, all bad.  The most common causes of this pattern are:

·        Severe triple vessel disease, with significantly decreased flow in the left anterior descending, right, and circumflex arteries.

Dawn's picture

Inferior Posterior M.I.

This is a "classic" ECG of very good quality for you to use in a classroom setting.

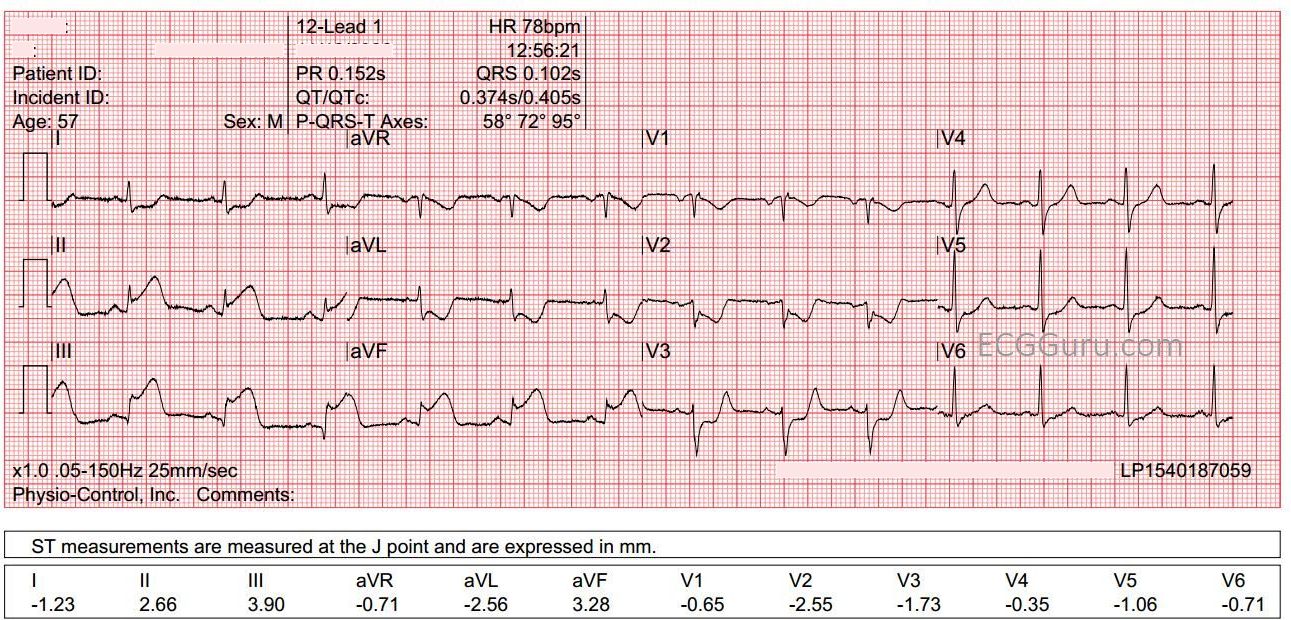
The Patient:  A 57-year-old man who complains of a sudden onset of "sharp" chest pain while on a long bike ride.  The pain does not radiate, and nothing makes it worse or better.  He is pale, cool, and diaphoretic.  His medical history is unknown.

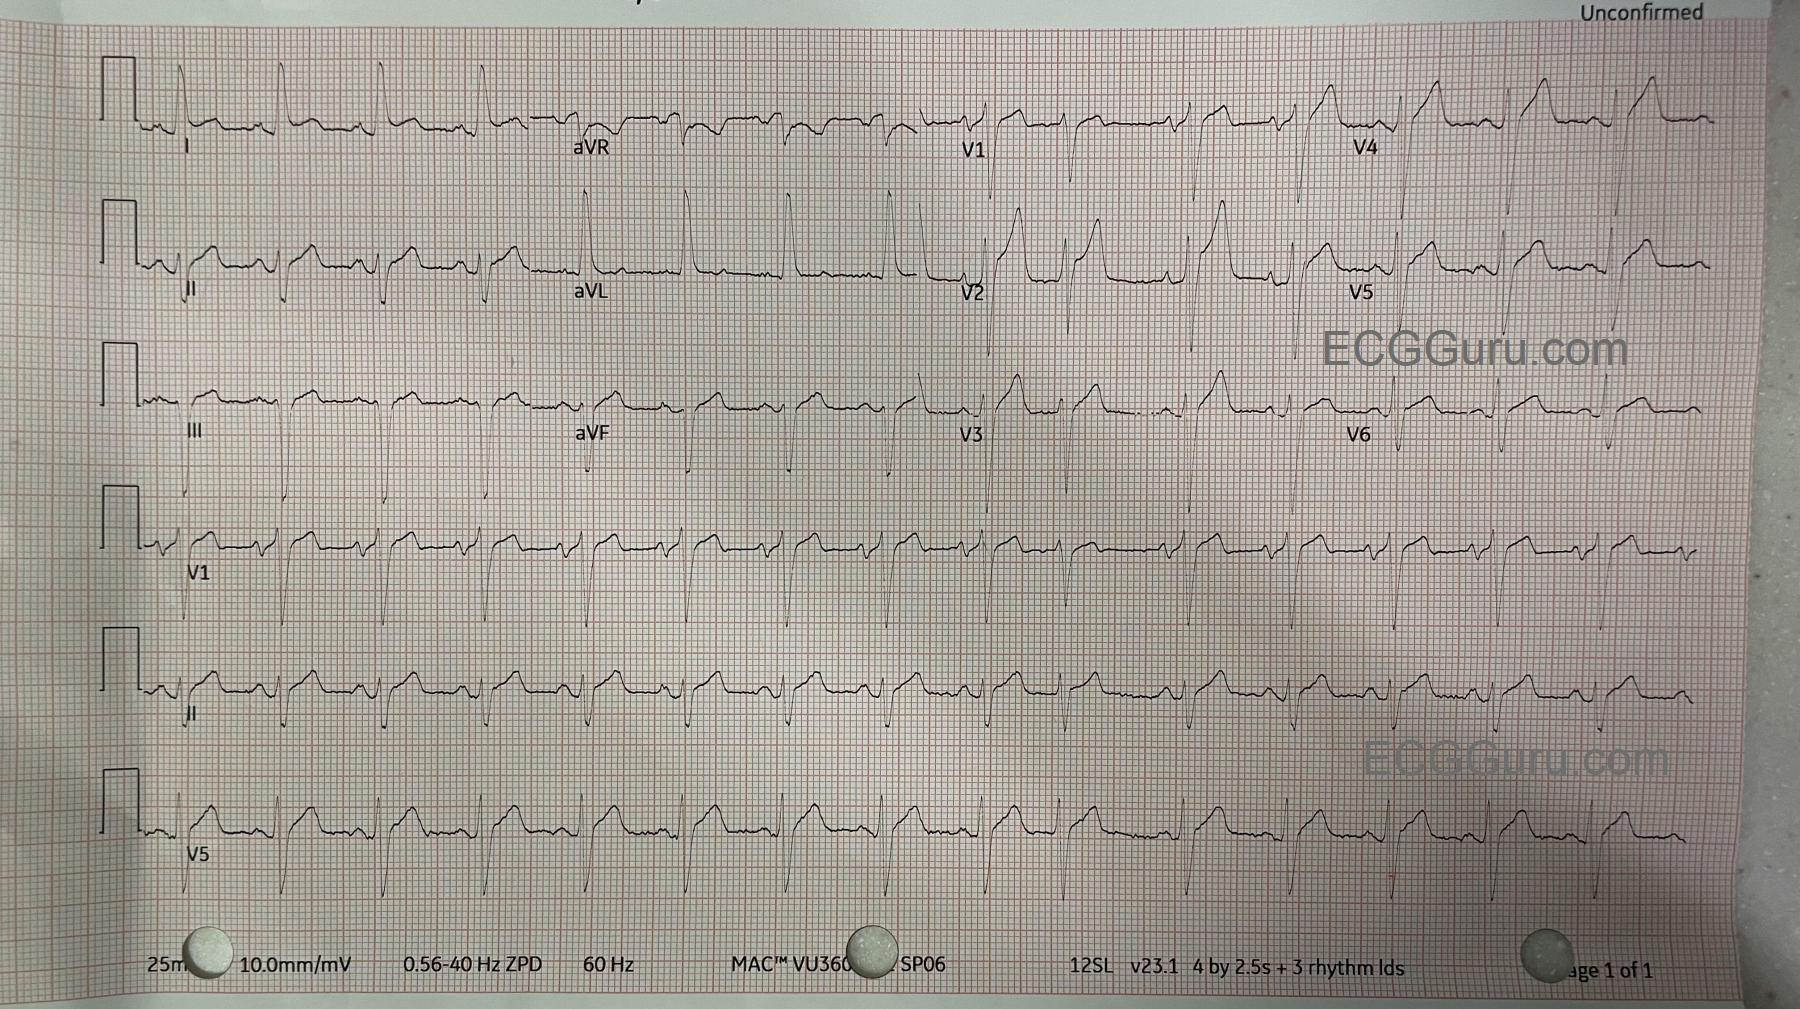
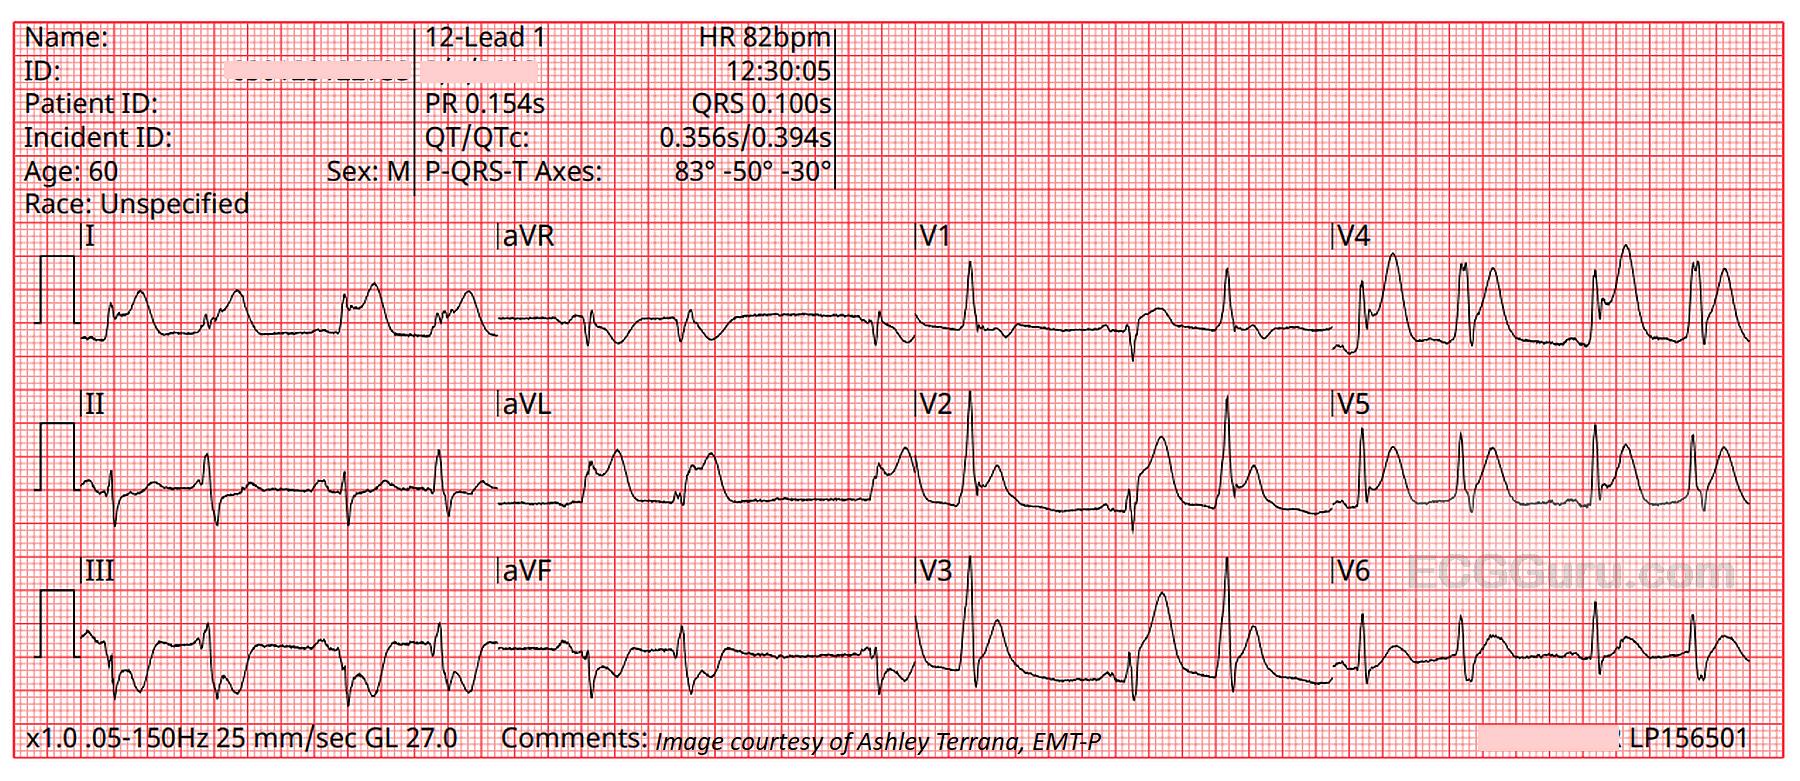
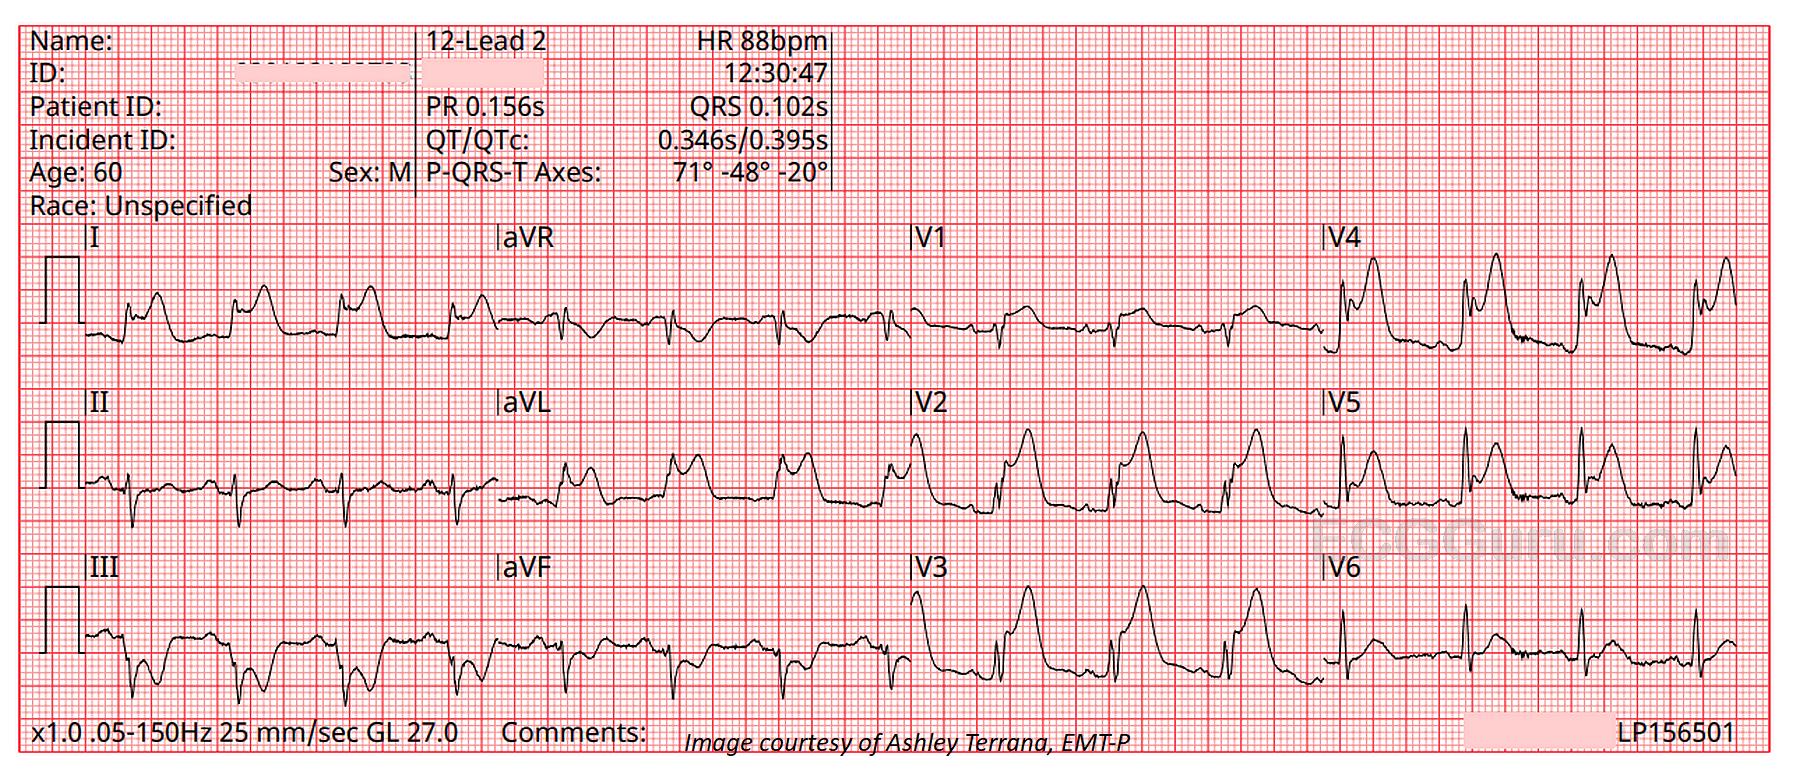
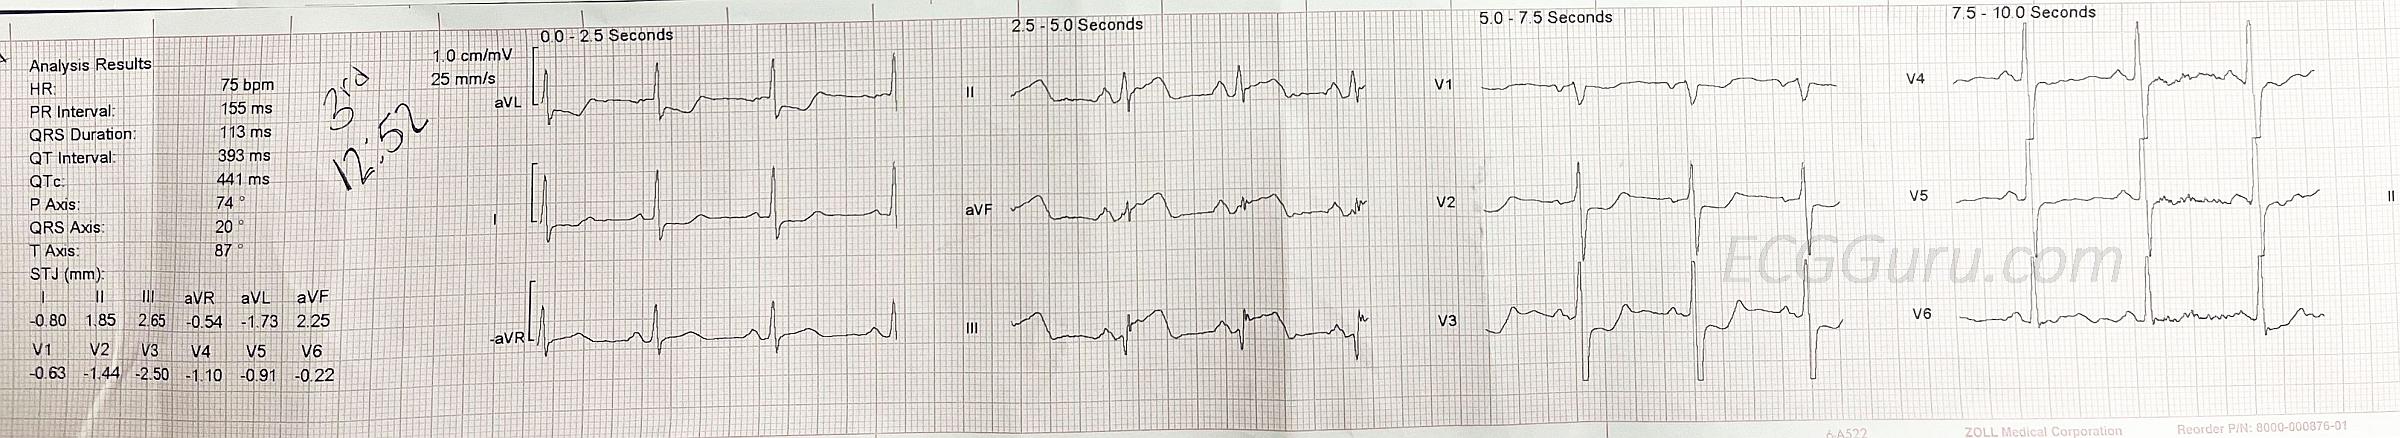
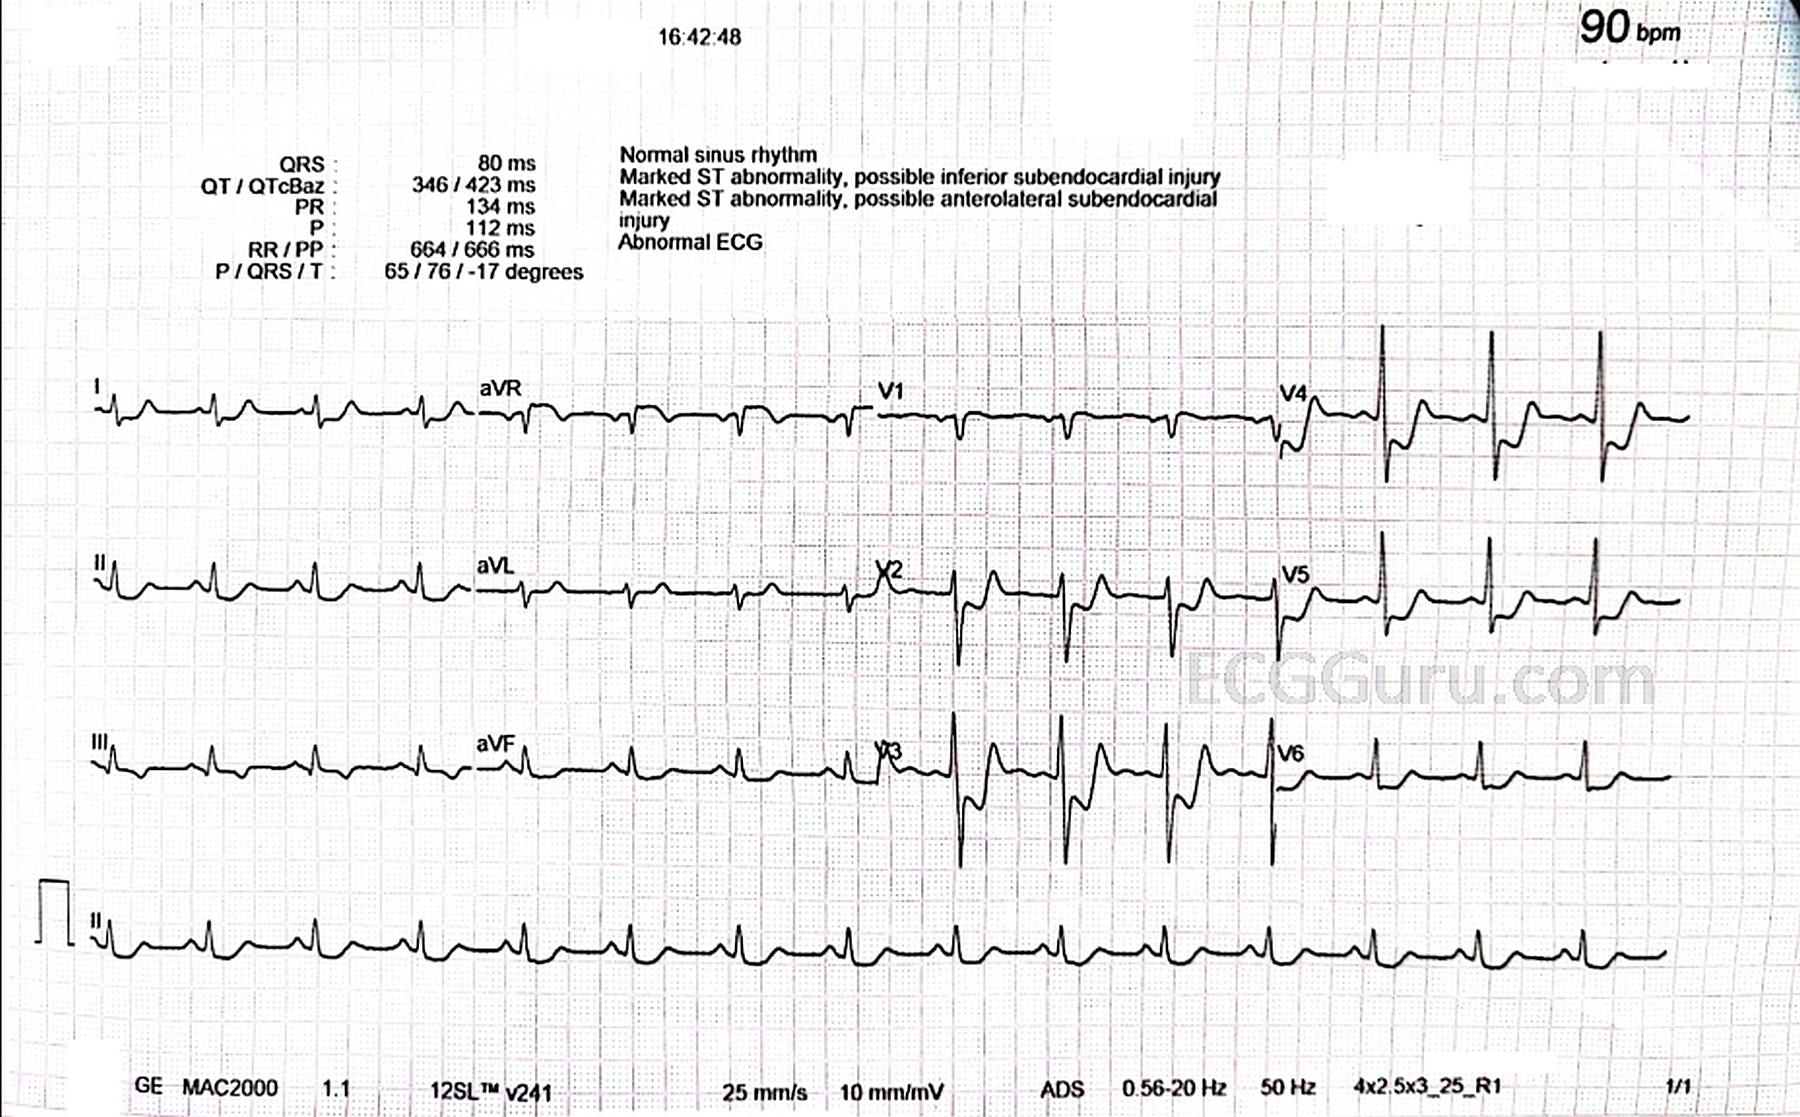
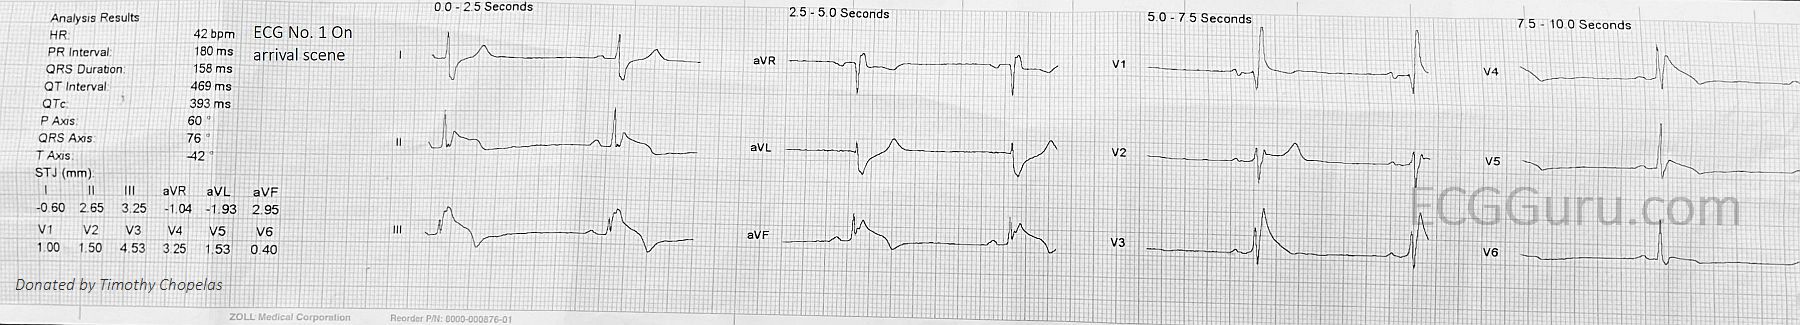
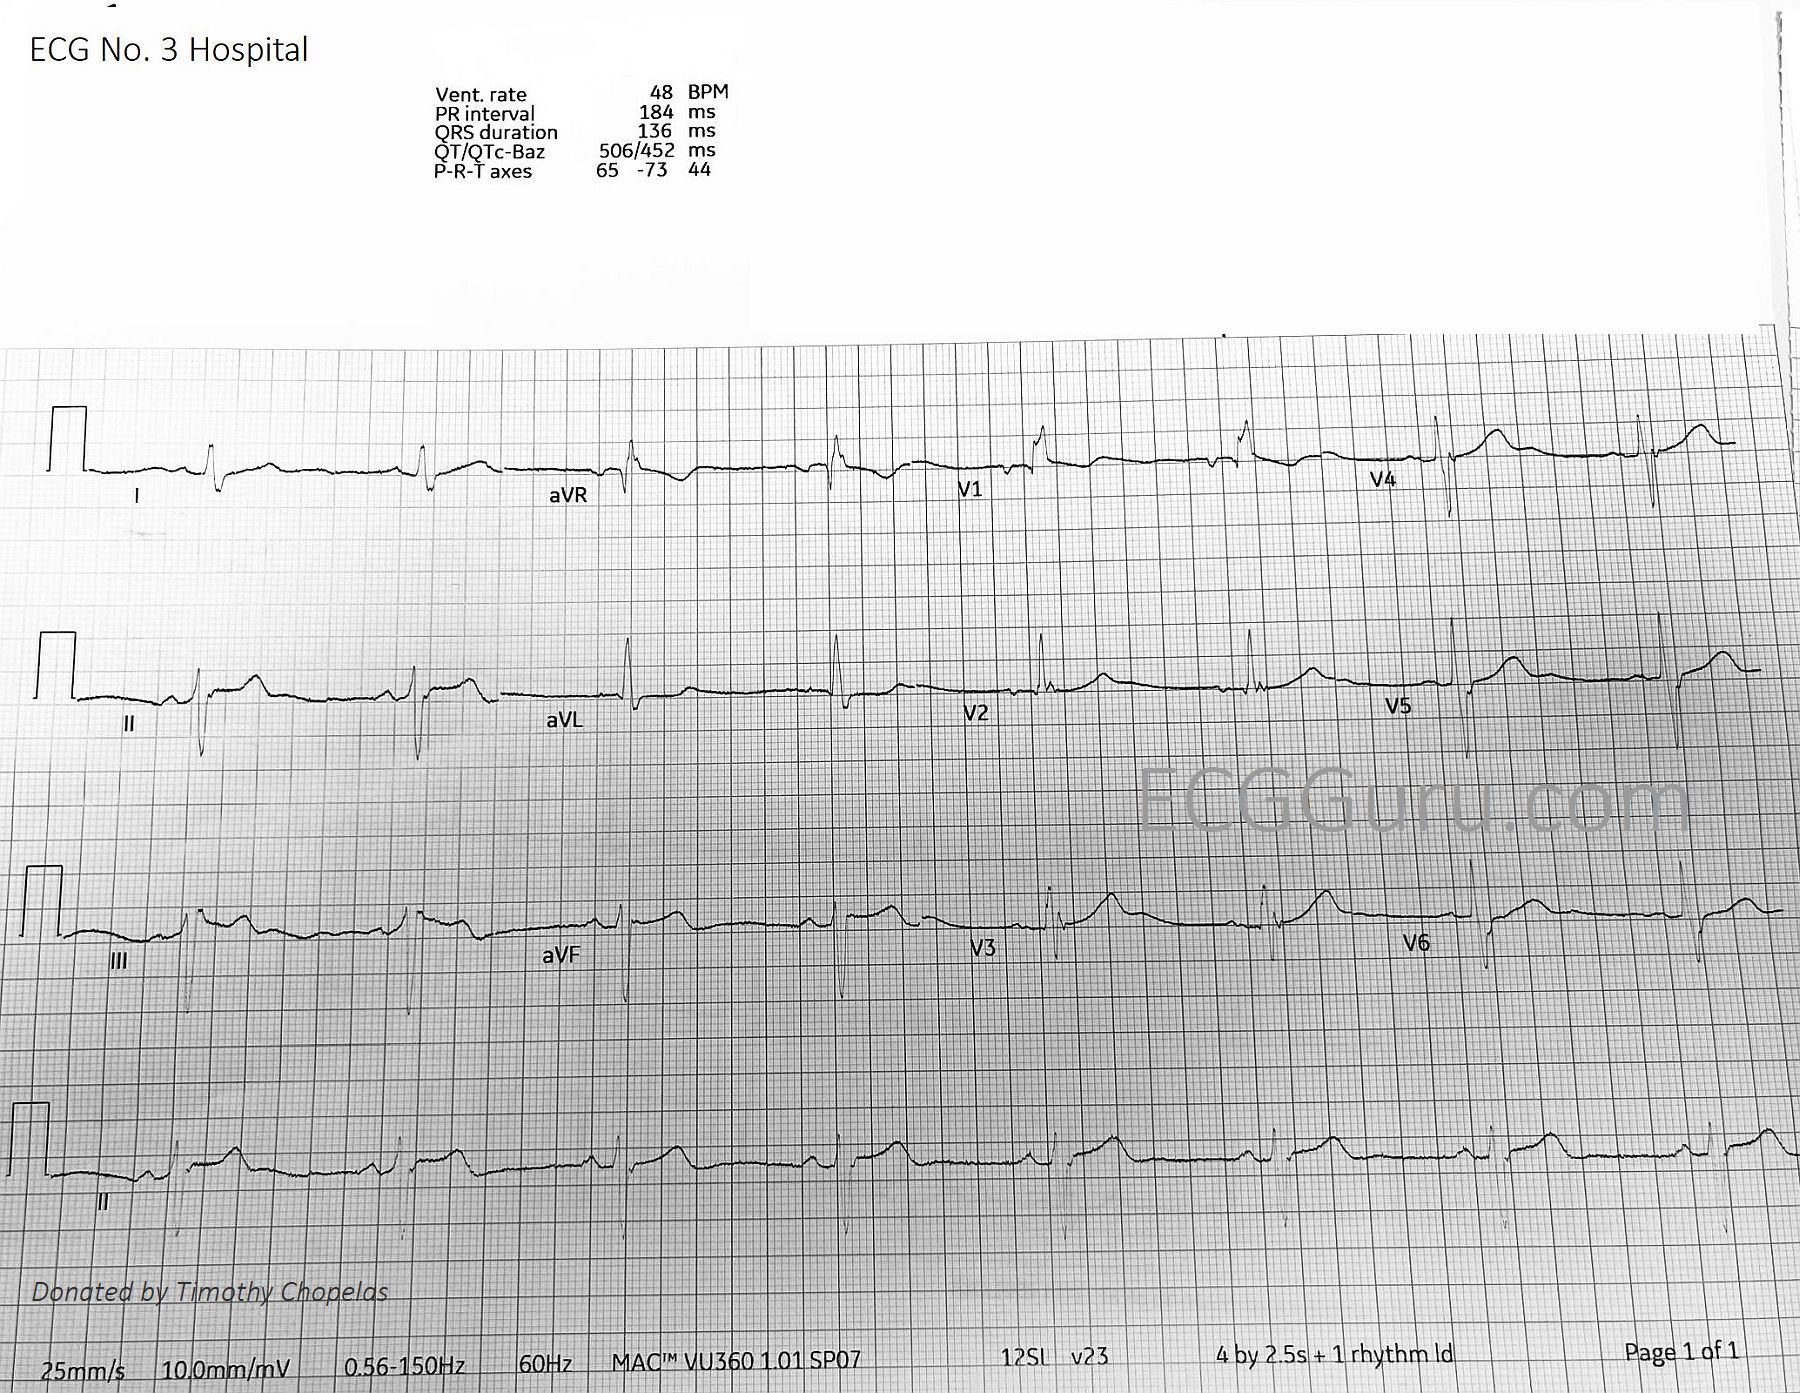
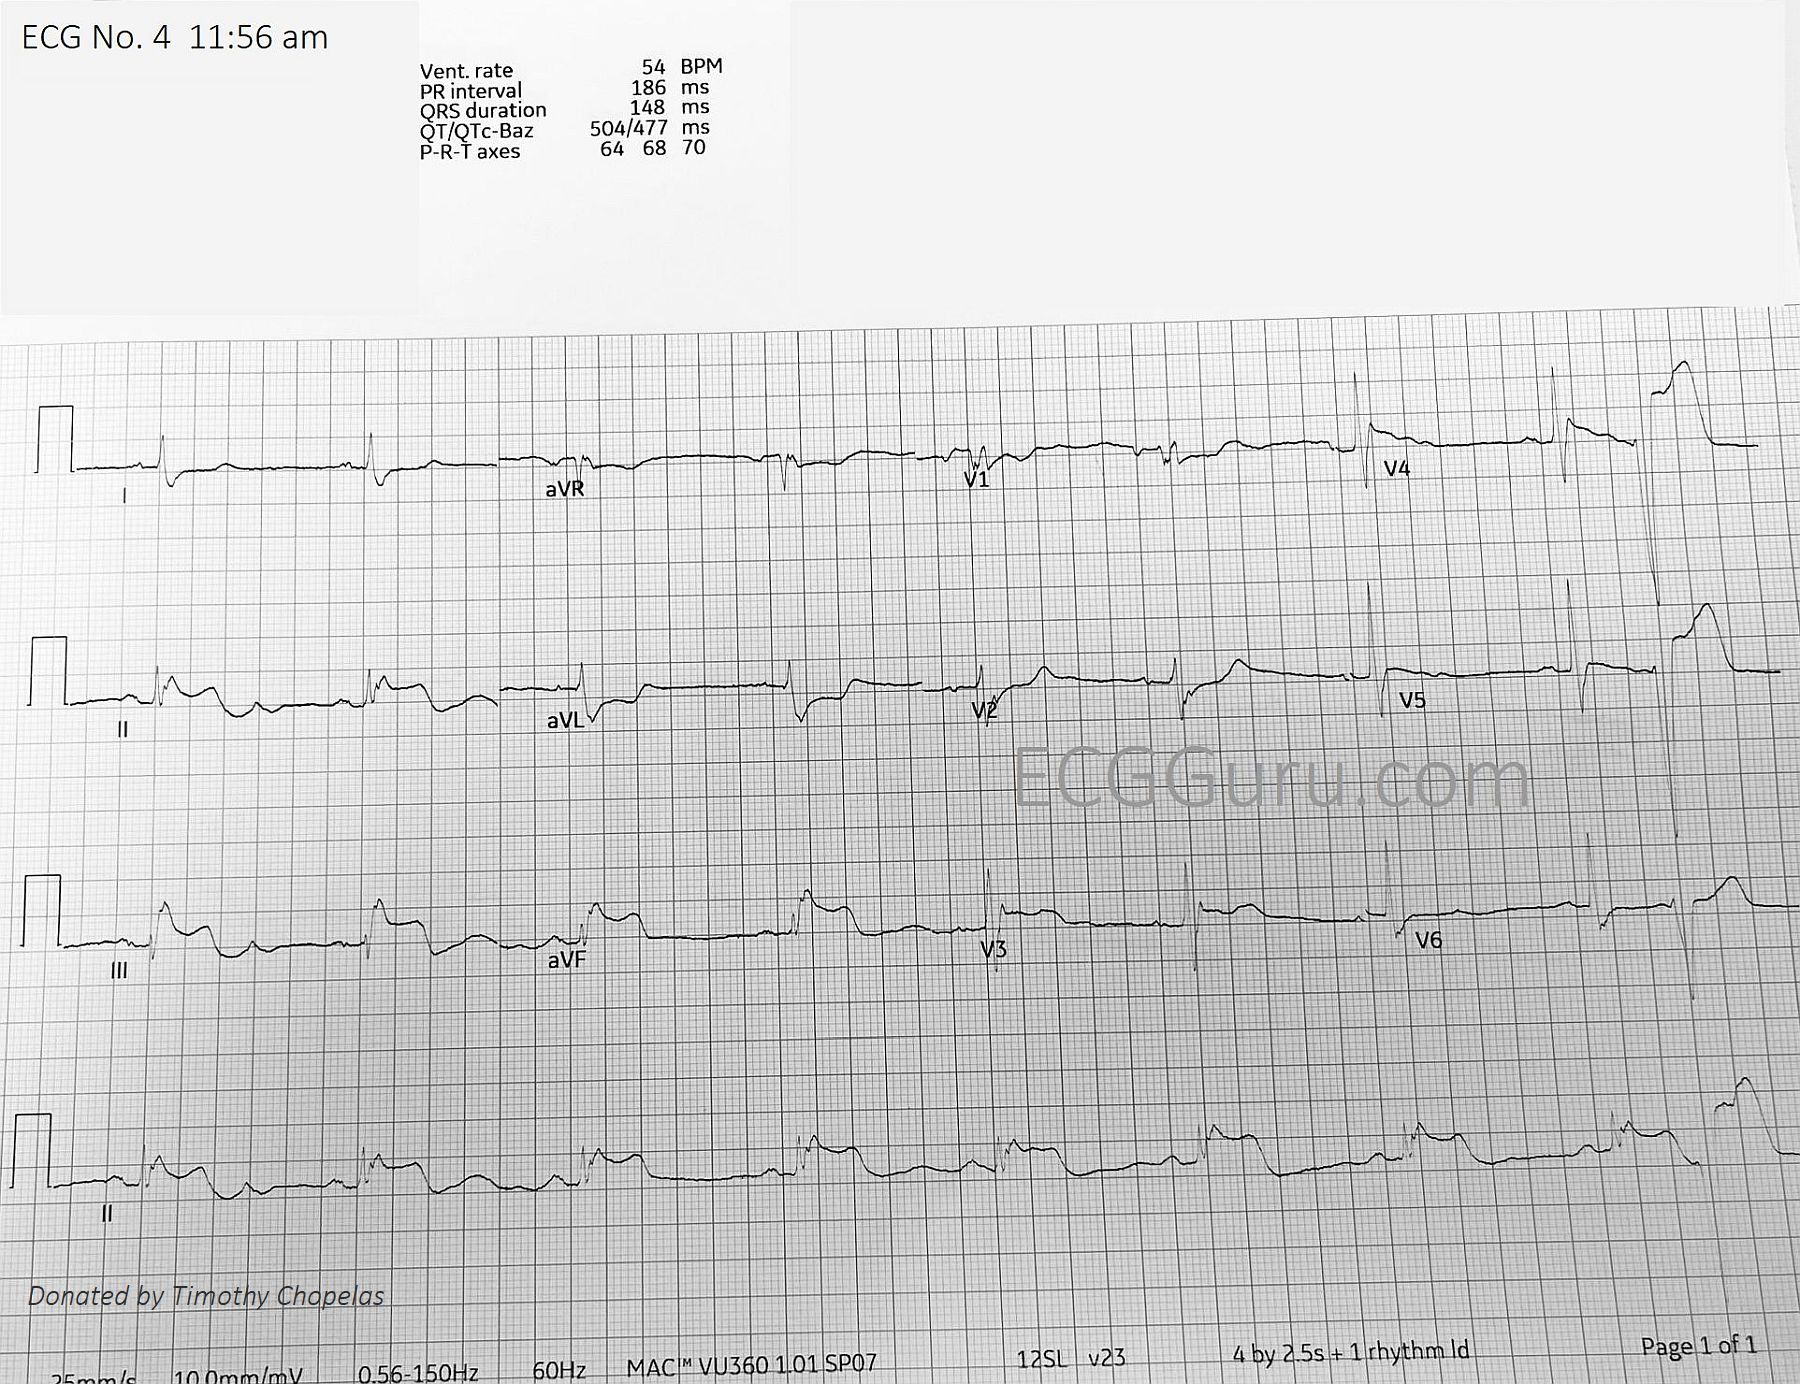
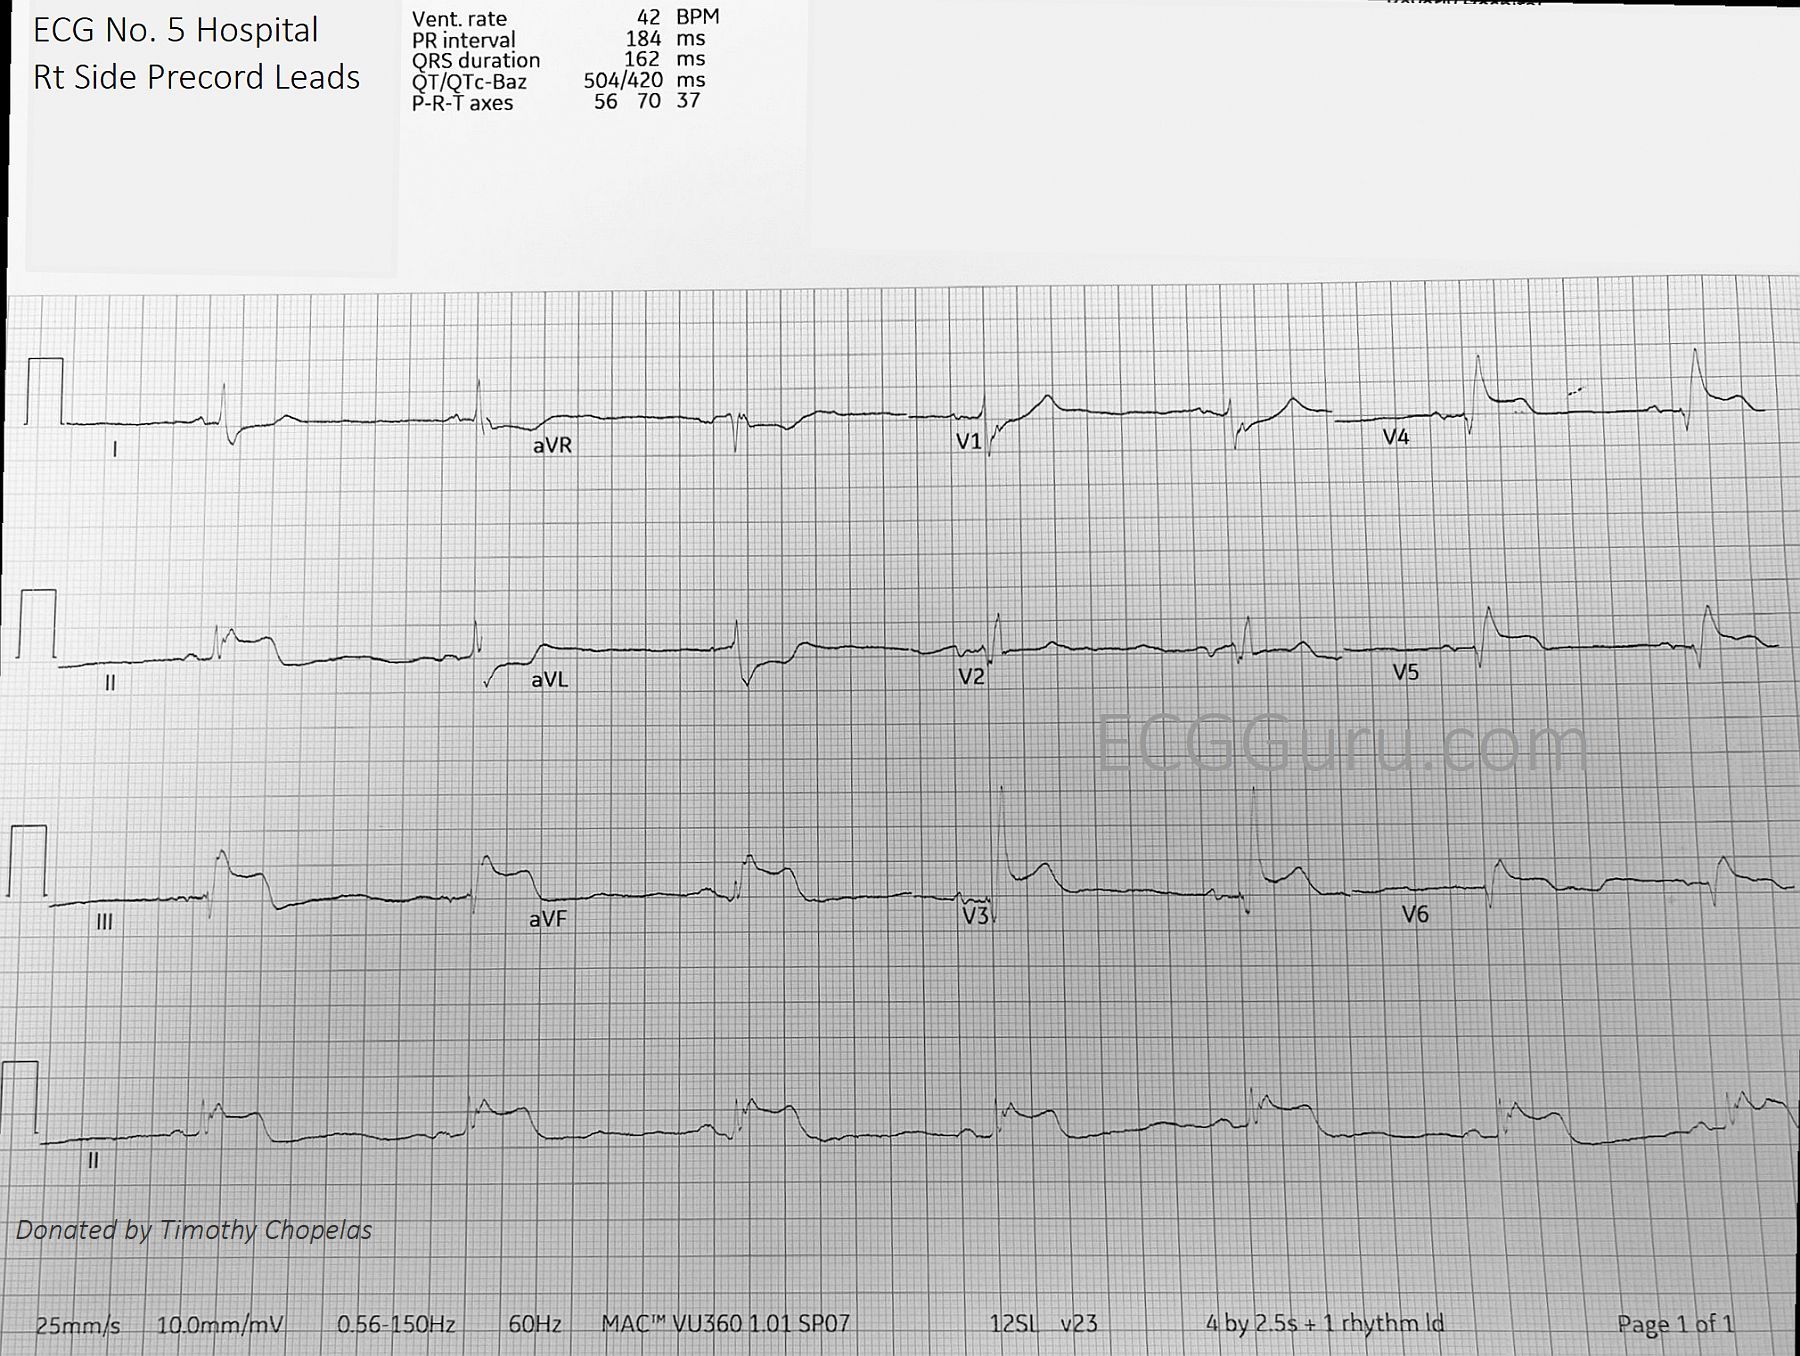
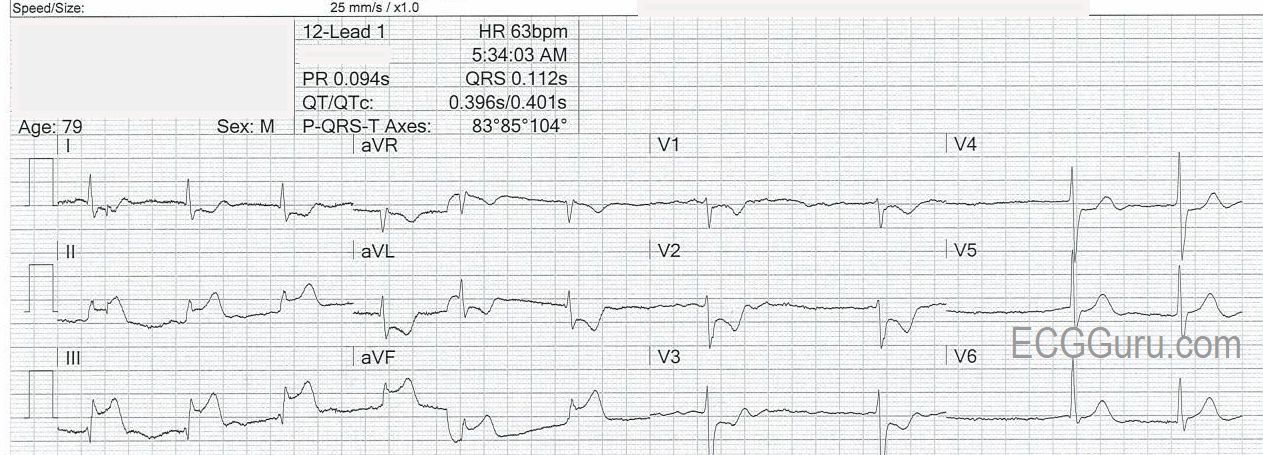
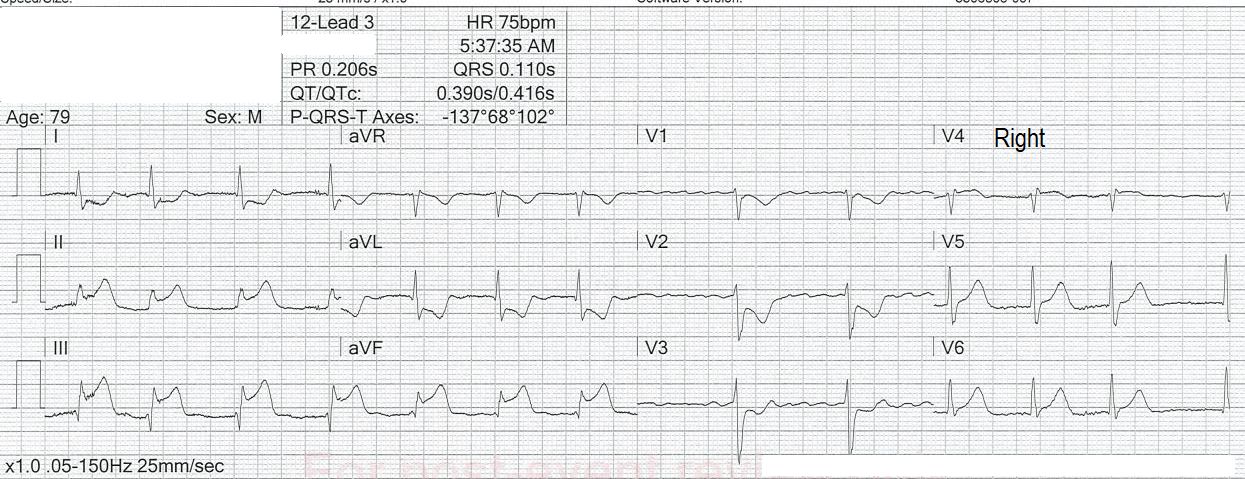
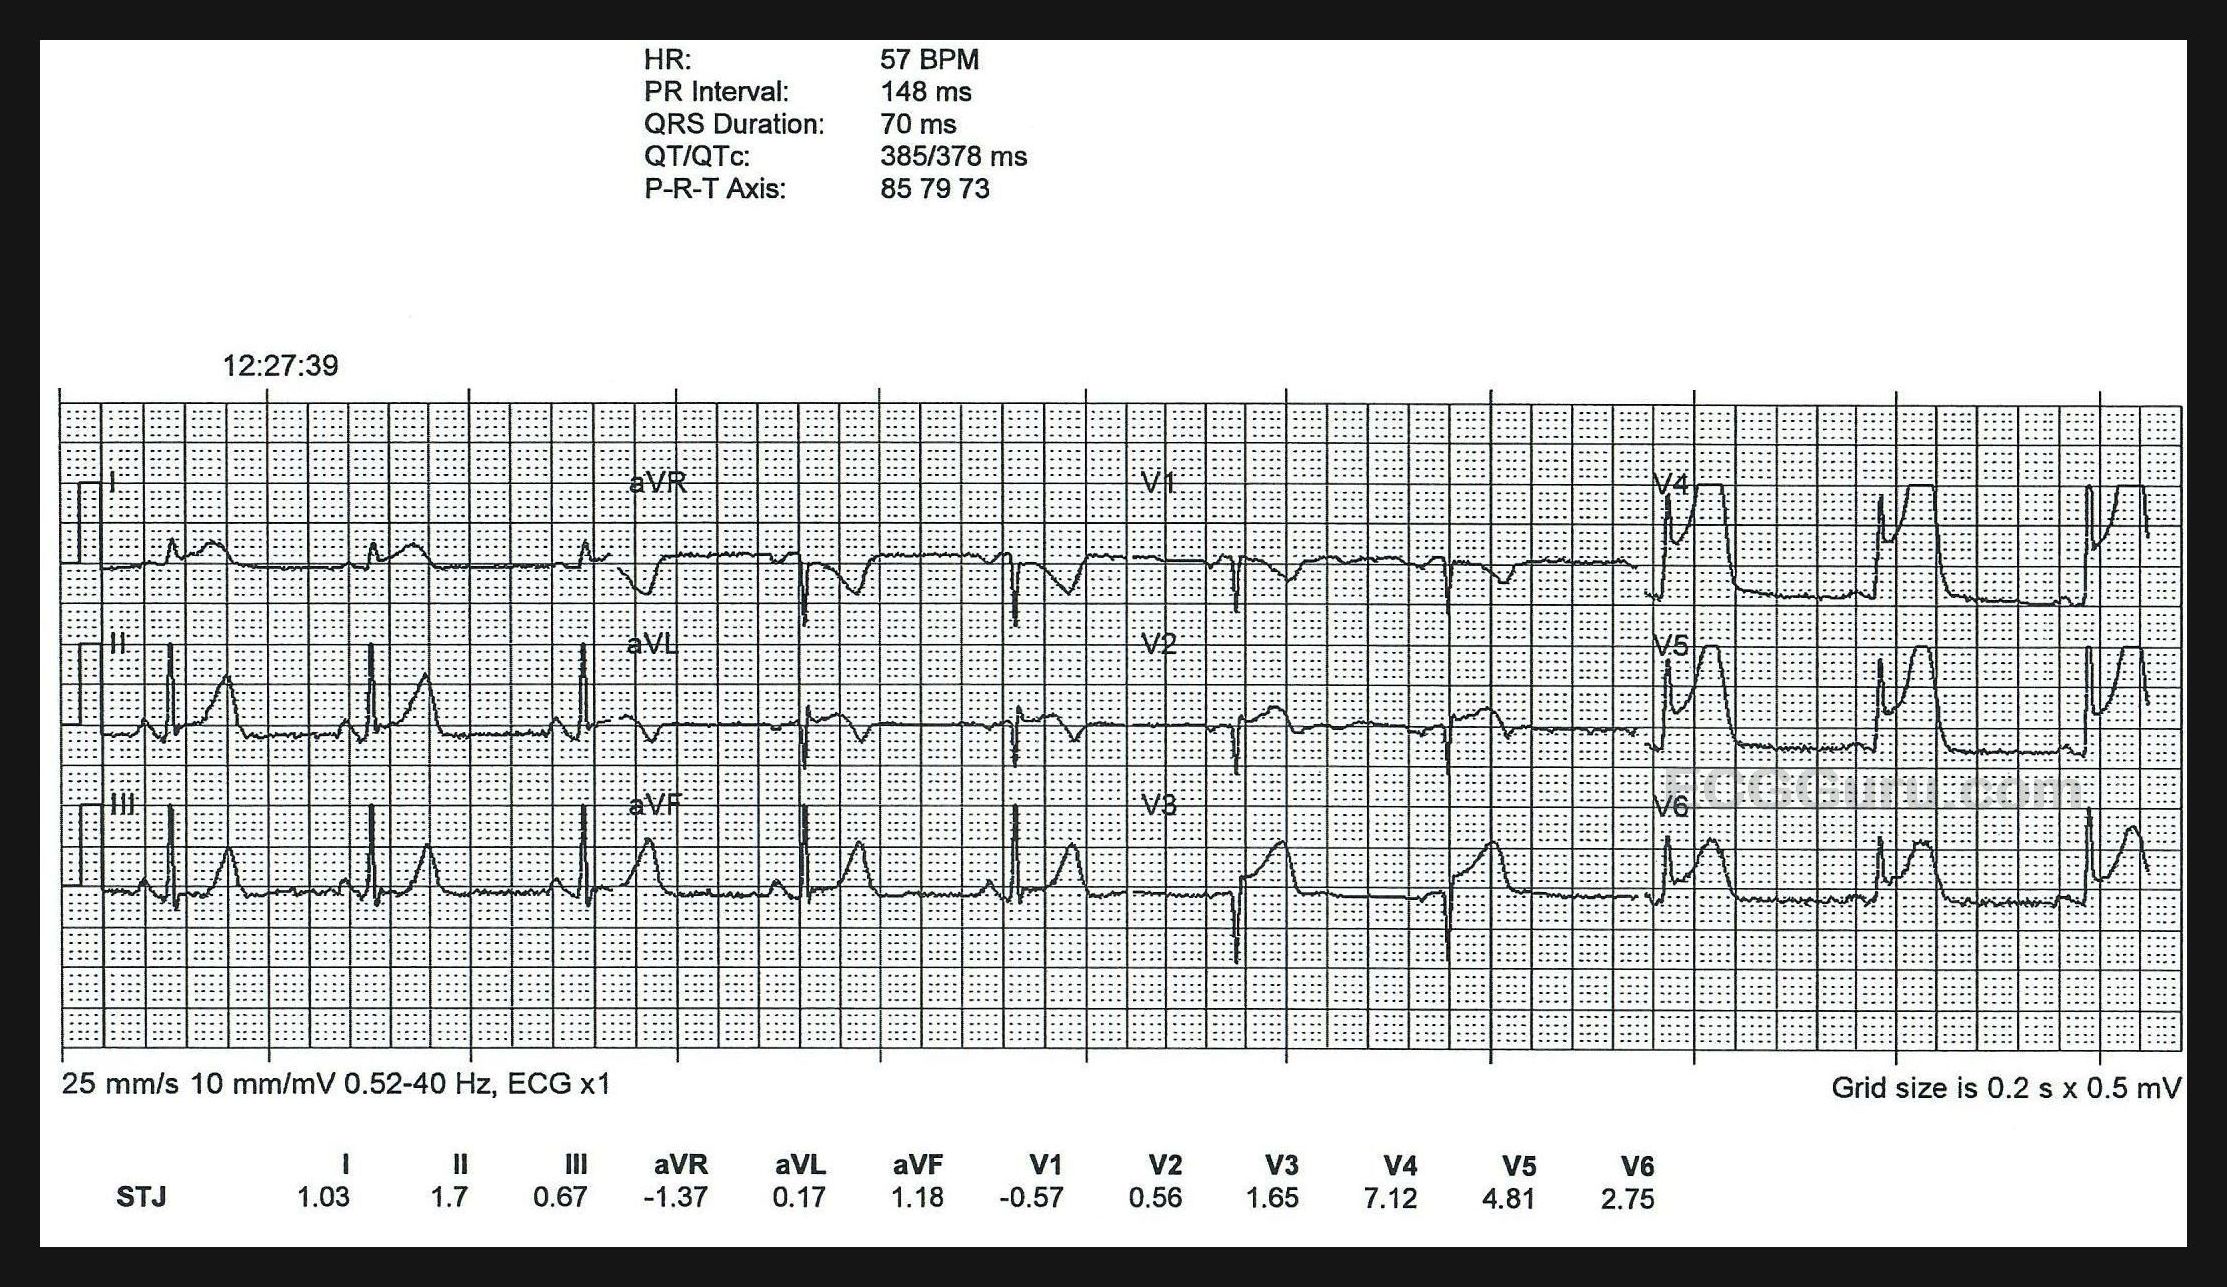
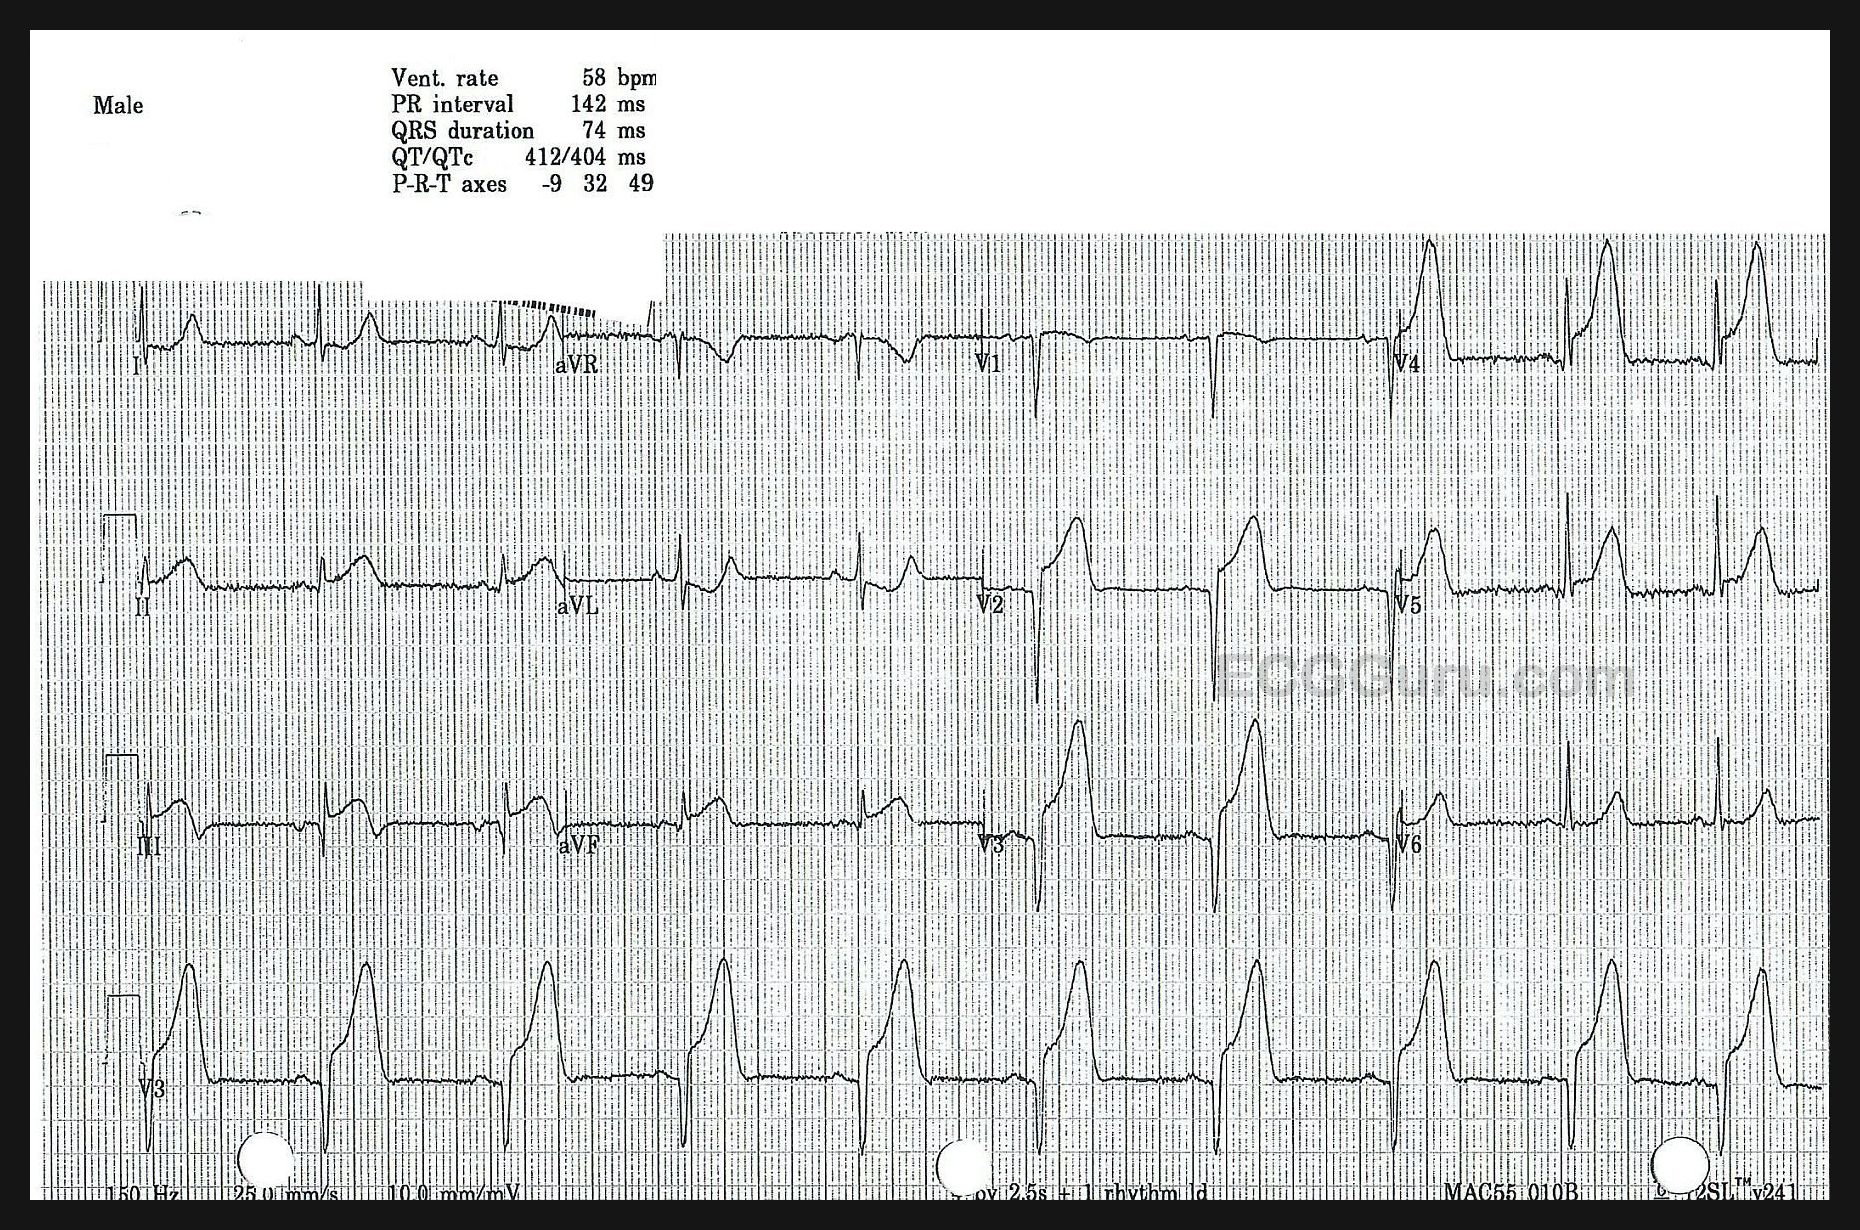
The ECG:  This ECG could be considered "classic" for an inferior wall ST elevation M.I. caused by occlusion of the right coronary artery.  ECG findings include:

*   Normal sinus rhythm

*   Marked ST elevation in Leads II, III, and aVF.  The elevation is higher in Lead III than in Lead II, a reliable sign of RCA occlusion.

*   Reciprocal depression in Leads aVL and I.  ST depression in the setting of acute transmural ischemia (STEMI) is almost ALWAYS due to  reciprocal change. The fact that this STD is localized to leads that are reciprocal to the inferior wall is proof of the nature of the STD.

*   Reciprocal depression in V1 - V3.  More localized depression.  What wall is reciprocal to the anterior-septal wall?  The posterior (postero-lateral).  Since the inferior wall is really the lower part of the posterior wall, inferior wall M.I. is often accompanied by posterior wall M.I.

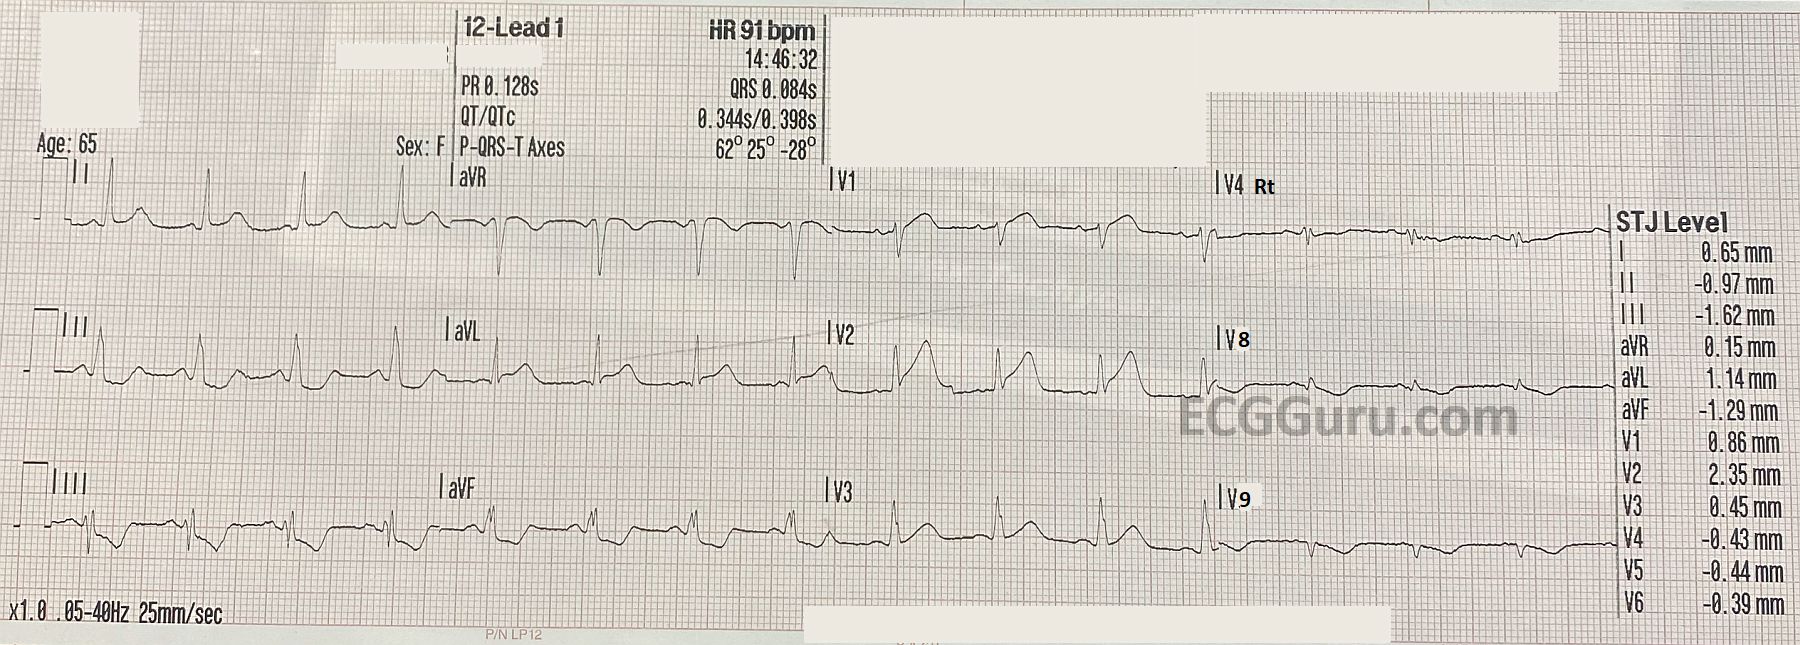
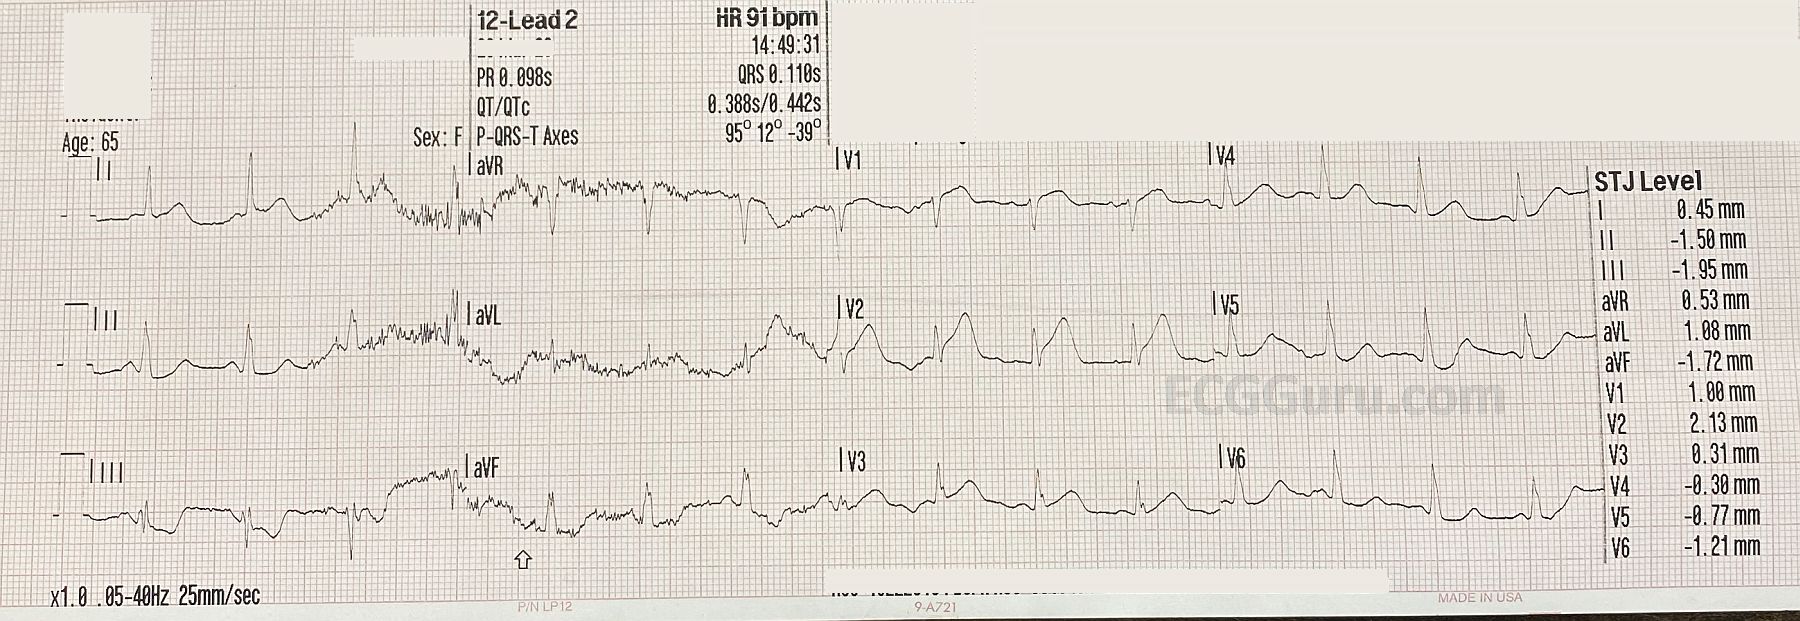
An additional lead, V4R, is helpful in this situation, since the right ventricle is often affected in RCA occlusions.  The EMS crew reports that V4R was negative for ST elevation, but we do not have a copy.

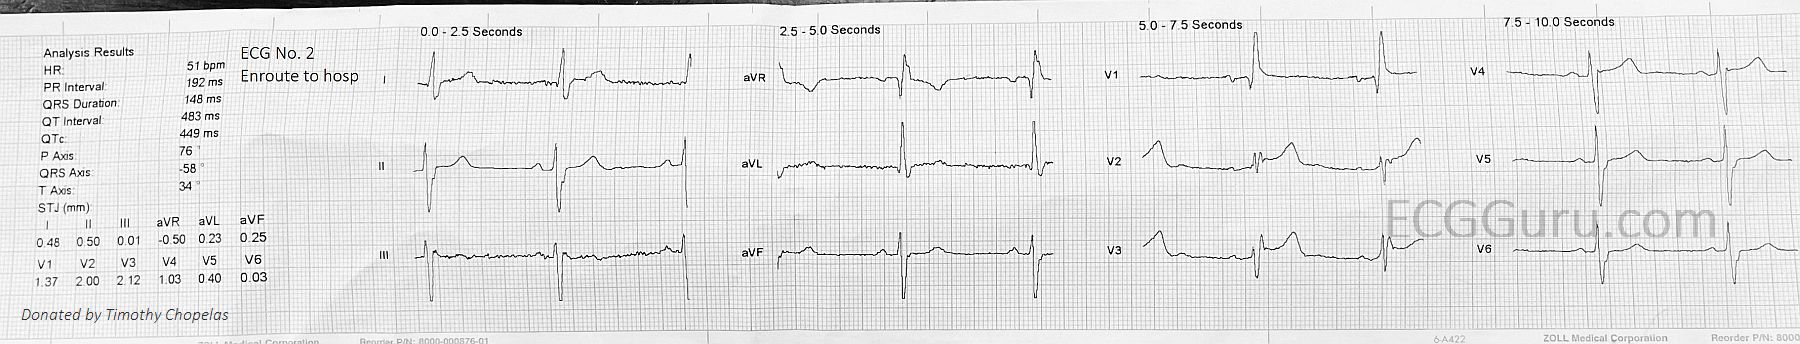
Small q waves have formed in Lead III, and we would watch for progression of this sign, as it can indicate necrosis.

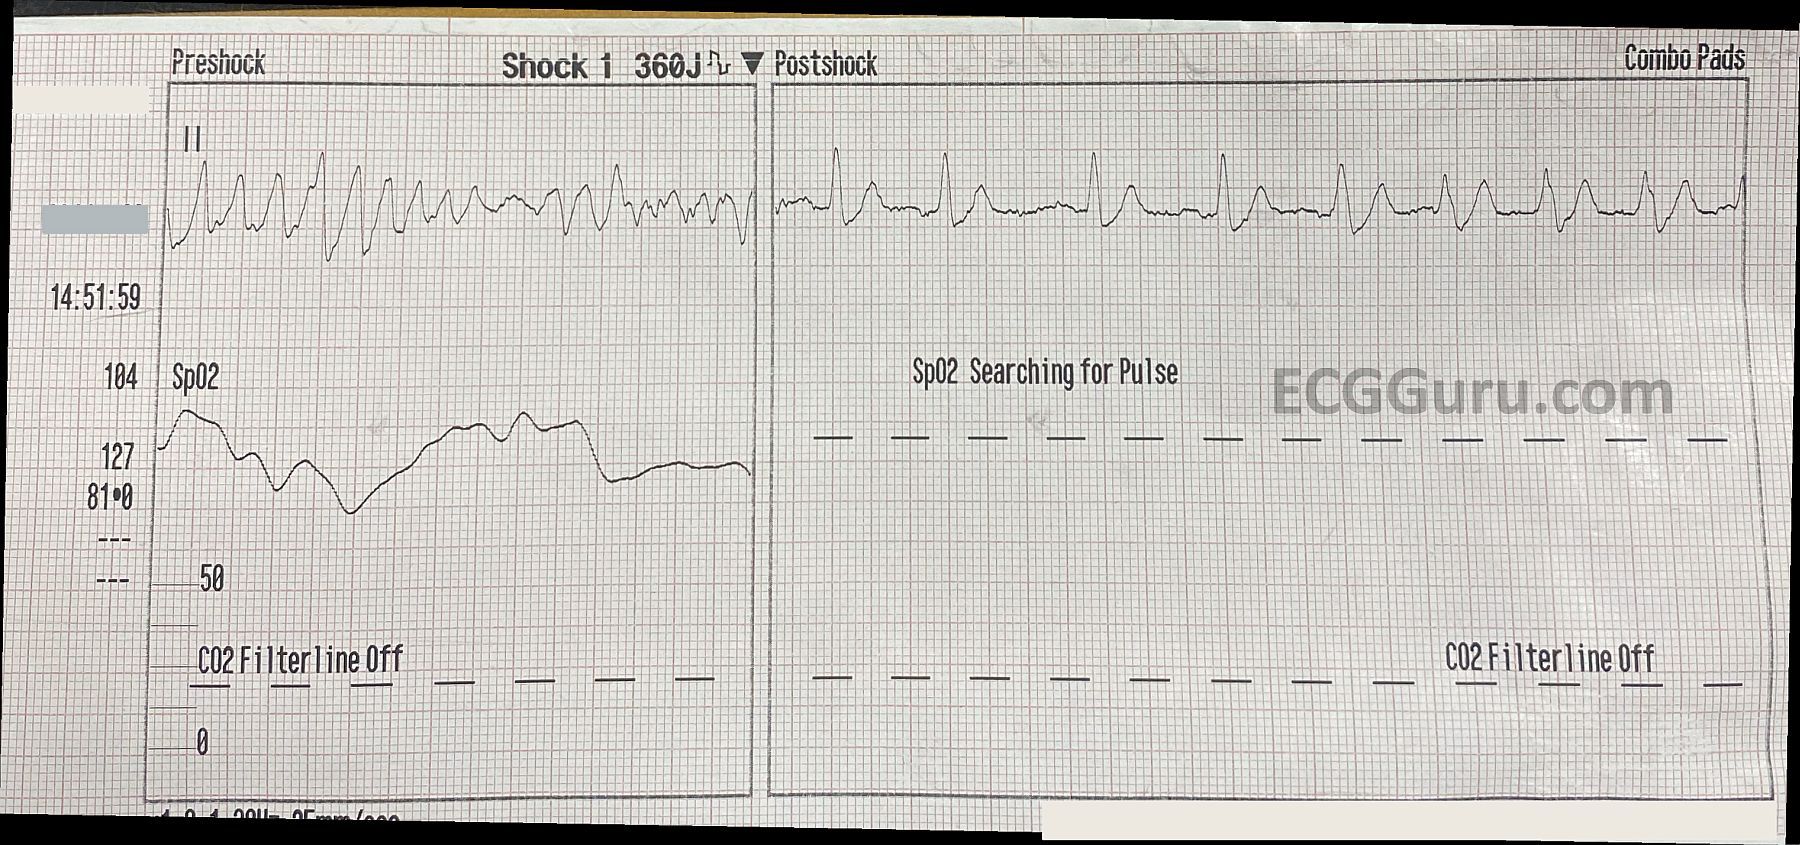
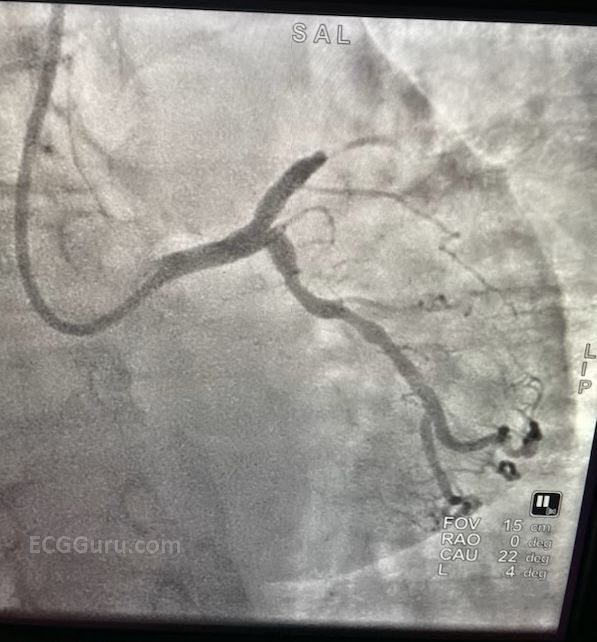
Outcome:  The patient went to the cath lab, but we have no further followup.


Our thanks to Ashley Terrana for donating this tracing.


Dawn's picture

Acute Anterior M.I. and Ventricular Fibrillation

The Patient:   This series of ECGs is from a 65-year-old woman who was complaining of a sudden onset of chest pain, nausea, and weakness. She stated that the pain increased on inspiration.  She reported a history of non-insulin-dependent diabetes mellitus (NIDDM). 

ECG No. 1, 14:46:  This ECG includes V4Right, V8 and V9 in place of V4, V5, and V6.  The rhythm is sinus at 91 beats per minute.  The PR interval is within normal limits, as is the QRS duration.  The QTc is WNL as well.  The frontal plane axis is also WNL.  The three standard chest leads show an early transition of R waves in V2.   There are noticeable ST and T wave abnormalities:

slight ST elevation in I and aVL with ST depression in II, III, and aVF.  In chest pain, possible M.I., STD should be presumed to be reciprocal in nature.  V1 has slight STE with a coved upward (frowning) appearance.  V2 has more noticeable STE, with a tall, wide-based T wave. This is called a “hyperacute T wave”.  We will have to evaluate V4 – V6 on ECG No. 2. 

V4 Right has no ST elevation, and V8 and V9 have ST depression (reciprocal to the anterior leads).  So far, we have all the signs of acute anterior wall M.I. 

Dawn's picture

Widespread ST Elevation With Right Bundle Branch Block

Usually, instructors of basic ECG classes look for examples of the most common conditions that are likely to be encountered by the learners.  But, sometimes, it is advantageous to show students more unusual presentations to remind them of the infinite possibilities when we care for living beings.  This series is a very good example of what can and does happen to some people with cardiovascular disease.  It will give your students an opportunity to think about possible interpretations, and also about anticipating clinical implications and emergencies that may arise.

The Patient:  This patient is a man in his 80s who has been active his whole life.  He considers himself to be healthy, giving no medical history and denying medication use. He states that he has had a yearly health exam.  Today, he felt “tired and dizzy” while raking leaves.  As he walked to his house to rest, he had a syncopal episode and fell, hitting his head. He was unconscious for a few minutes. A family member called for Emergency Medical Services (EMS). Paramedics found him awake and complaining of bilateral “shoulder and wrist” pain. He had no obvious trauma to his extremities, but had some bruising on his head and face.  He denied recent illness and substance abuse.  He was oriented x3. He was pale and diaphoretic, and complained of nausea. He denied chest or back pain.  He denied shortness of breath.  BP 100/60.  Heart rate bradycardic.  SPO2 above 95%.  He was given aspirin and ondasetron, and transported to a hospital.

Dawn's picture

Inferior Wall M.I. In A Patient With Left Bundle Branch Block

The Patient:    A 64-year-old man complaining of chest pain and shortness of breath for 20 minutes.  Long-standing history of triple vessel disease, severe aortic stenosis, hypertension, thrombocytopenia.  Meds unknown.  He was not considered to be a candidate for valve surgery.


The ECG: There is normal sinus rhythm with a rate of 90 bpm.  P waves are not visualized well in all leads, so remember that the three channels of this ECG are run simultaneously.  If you see a P wave in Leads I and II, they are also present in Lead III.  The PR interval is WNL.


The QRS complexes are wide, at .122 seconds (122 ms).  The criteria for left bundle branch block are met. (Supraventricular rhythm, wide QRS, upright QRS in Leads I and V6, negative QRS in V1).  The frontal plane axis is within normal limits, but toward the right, at 87 degrees.  The QRS complexes transition at V4 from negative to positive, but Leads V1 – V3 have no initial r waves.  These are possibly pathological Q waves, likely from a past anterior-septal M.I.


Dawn's picture

Inferior Wall, Posterior Wall, and Right Ventricular M.I.

The patient:    79-year-old man complaining of severe “burning” chest pain, radiating to his neck. Walking exacerbates his discomfort.  He has had nausea and vomiting for 24 hours. Past medical Hx includes high cholesterol and atrial fibrillation. Medications not known.


The ECGs:  These ECGs could be called “classic”.  There is a 100% occlusion of the right coronary artery (RCA), which was successfully repaired in the cath lab.  About 80% of inferior wall M.I.s are due to occlusion of the right coronary artery.  Depending on how proximal the occlusion is, we can expect a pattern on the ECG representing injury to all areas supplied by the RCA.  This “package deal” can include:

·         Inferior wall ST elevation.

·         Posterior wall extension.

Dawn's picture

Large Anterior Wall M.I. and Effect of Lead Reversal

EDIT: Please refer to the comments below this text. The second ECG in this series shows unexpected QRS and ST-T morphology changes, which I tried to explain by way of the patient's long anterior descending coronary artery. However, Dave Richley, who is a very well-known cardiac physiologist and ECG Guru took the time to analyze these morphologies and realize they can be explained by an inadvertent ECG LEAD MISPLACEMENT. This patient does have a proximal lesion of the LAD, proven and repaired in the cath lab. But the inferior wall does not have the injury it appears to have in this second ECG. Thanks to Dave for reminding us to slow down and look closely when things don't look "right".

The Patient:   These two ECGs, taken 26 minutes apart, were obtained from a 50-year-old man who complained of sudden onset of chest pain.  He denied history of coronary artery disease. He was Covid-positive, and the rest of his medical history was unremarkable.

ECG No. 1:  This ECG was obtained by paramedics enroute to the hospital.  For your beginner-level students, it will be easy to demonstrate the large ST elevations in V3 through V6. The machine’s measurements at the bottom confirm that this ECG meets any field criteria for ST elevation M.I. “STEMI”.

But there is so much more to see! Taking a methodical approach, and starting with rate and rhythm, we see sinus bradycardia at 57 bpm. Intervals and frontal plane axis are within normal limits. R wave progression in the chest leads is stalled in V1- V3 due to loss of initial r waves (narrow QS). The transition to positive deflections in V4 – V6 is abrupt.  These q waves in the V1 and V2 appear narrow, but V3 appears to have a Q wave that is almost wide enough to be considered pathological.  Narrow Q waves may be a transient sign of injury, while wide ones (>40 ms) are an ECG sign of necrosis.

Dawn's picture

Lateral Wall M.I.

The patient:   This ECG was taken from a 66-year-old man who was complaining of chest pain at rest. He had been previously diagnosed with lung cancer with metastases to his bones.  The last ECG, taken one week ago, was normal.

The ECG:  There is mild sinus tachycardia at 101 bpm.  The rhythm is regular.  The QRS duration and PR interval are normal, as is the QTc.  The QRS voltage in the limb leads is small, and we do not know the patient’s height and weight.

There are notable ST elevations in I and aVL (high lateral wall) and in V5 and V6 (low lateral wall).  When the high and low lateral walls are similarly affected, we usually look to the circumflex artery as the culprit artery.  We also see ST depression in Leads III and aVF (reciprocal to the STE in I and aVL) and in V1 – V4.  This could indicate subendocardial damage or reciprocal changes.  This ECG meets the criteria for acute lateral myocardial infarction.

The patient was taken to the cath lab emergently.  His coronary arteries, including the left circumflex, all were free of occlusive lesions.  He had no coronary spasm during the procedure, but it was decided that spasm had been the cause of the ECG changes.  His ECG reverted to normal.

It is important to record abnormal findings, as some changes can be temporary or fleeting.  Coronary artery spasm can cause ischemia and damage to the heart, just as plaque lesions and blood clots can.

Pages

All our content is FREE & COPYRIGHT FREE for non-commercial use

Please be courteous and leave any watermark or author attribution on content you reproduce.