Displaying 1 - 6 of 6
Dawn's picture

Acute Anterior-lateral STEMI

The Patient:  A 60-year-old man at work. He experienced a sudden onset of substernal chest pain, nausea & vomiting, and dizziness.  He states the pain is a 5 on 1-10 scale.  No cardiac history or current medications. 

The ECGs:  The first ECG, taken at 12:30:05, shows a sinus rhythm with ventricular bigeminy. In some leads, you can see the sinus P waves hidden in the beginnings of the PVCs, so we know the underlying sinus rhythm is about 82 bpm.

There is obvious ST elevation in V1 through V5, which is the anterior wall, an area perfused by the left anterior descending artery.  Remember – the ST elevation sign may also show in the PVCs, but because ventricular beats have secondary ST changes of their own, we should assess only the sinus beats for ST changes. 

There is also obvious ST elevation in Leads I and aVL.  This is the high lateral wall, which is perfused by the circumflex and first diagonal arteries, both proximal branches of the left coronary artery.  So, the involvement of the high lateral wall indicates a proximal lesion in the LCA – not good.  Leads III and aVF have distinct ST depression – this is a reciprocal change reflecting the ST elevation in Leads I and aVL.

Dawn's picture

Acute Anterior M.I. and Ventricular Fibrillation

The Patient:   This series of ECGs is from a 65-year-old woman who was complaining of a sudden onset of chest pain, nausea, and weakness. She stated that the pain increased on inspiration.  She reported a history of non-insulin-dependent diabetes mellitus (NIDDM). 

ECG No. 1, 14:46:  This ECG includes V4Right, V8 and V9 in place of V4, V5, and V6.  The rhythm is sinus at 91 beats per minute.  The PR interval is within normal limits, as is the QRS duration.  The QTc is WNL as well.  The frontal plane axis is also WNL.  The three standard chest leads show an early transition of R waves in V2.   There are noticeable ST and T wave abnormalities:

slight ST elevation in I and aVL with ST depression in II, III, and aVF.  In chest pain, possible M.I., STD should be presumed to be reciprocal in nature.  V1 has slight STE with a coved upward (frowning) appearance.  V2 has more noticeable STE, with a tall, wide-based T wave. This is called a “hyperacute T wave”.  We will have to evaluate V4 – V6 on ECG No. 2. 

V4 Right has no ST elevation, and V8 and V9 have ST depression (reciprocal to the anterior leads).  So far, we have all the signs of acute anterior wall M.I. 

Dawn's picture

Large Anterior Wall M.I. and Effect of Lead Reversal

EDIT: Please refer to the comments below this text. The second ECG in this series shows unexpected QRS and ST-T morphology changes, which I tried to explain by way of the patient's long anterior descending coronary artery. However, Dave Richley, who is a very well-known cardiac physiologist and ECG Guru took the time to analyze these morphologies and realize they can be explained by an inadvertent ECG LEAD MISPLACEMENT. This patient does have a proximal lesion of the LAD, proven and repaired in the cath lab. But the inferior wall does not have the injury it appears to have in this second ECG. Thanks to Dave for reminding us to slow down and look closely when things don't look "right".

The Patient:   These two ECGs, taken 26 minutes apart, were obtained from a 50-year-old man who complained of sudden onset of chest pain.  He denied history of coronary artery disease. He was Covid-positive, and the rest of his medical history was unremarkable.

ECG No. 1:  This ECG was obtained by paramedics enroute to the hospital.  For your beginner-level students, it will be easy to demonstrate the large ST elevations in V3 through V6. The machine’s measurements at the bottom confirm that this ECG meets any field criteria for ST elevation M.I. “STEMI”.

But there is so much more to see! Taking a methodical approach, and starting with rate and rhythm, we see sinus bradycardia at 57 bpm. Intervals and frontal plane axis are within normal limits. R wave progression in the chest leads is stalled in V1- V3 due to loss of initial r waves (narrow QS). The transition to positive deflections in V4 – V6 is abrupt.  These q waves in the V1 and V2 appear narrow, but V3 appears to have a Q wave that is almost wide enough to be considered pathological.  Narrow Q waves may be a transient sign of injury, while wide ones (>40 ms) are an ECG sign of necrosis.

Dawn's picture

Non-specific IVCD With Peaked T Waves

The Patient:   This ECG was obtained from an elderly man who was suffering an exacerbation of congestive heart failure.  He had a history of CHF and hypertension.  We do not have other history available to us.

The ECG:  The rhythm is sinus at 97 bpm (fast for this patient). It is regular with no ectopy.  The PR interval is 155 ms (.15 seconds), and the P waves are upright in the inferior leads. The frontal plane QRS axis is -56 degrees – abnormally leftward.  Notice that Leads II, III, and aVF are all negative.  AVR is equiphasic – the axis travels perpendicular to the positive electrode of aVR, toward the patient’s left shoulder.  The QRS duration is 111 ms (.11 sec.).  This is very close to being wide enough for a diagnosis of left bundle branch block, and represents poor conduction throughout the ventricles. On the chest leads side, there is poor R wave progression. V1 through V4 look almost the same, small r and large S.

The ST segments are generally concave up, and the J points are at the baseline – no ST elevation or depression.  There are no pathological Q waves, unless we count V1, which may have lost it’s Q wave as part of the general poor R wave progression.

Dawn's picture

Anterior Wall M.I.

This ECG was taken from a 60 year old man who was complaining of severe substernal chest pain, radiating to his left arm and a non-productive cough.  There was some initial discussion among the EMS crew  about the possibility of the ECG showing a "benign early repolarization" pattern because of the concave upward ("smiling") ST segments.  They also considered a diagnosis of pericarditis, because the ST segments seem widespread.  The baseline artifact makes it difficult to evaluate for PR segment depression or Spodick's Sign.

The patient's age (60 years) and troubling symptoms (chest pain radiating to the left arm) ruled out BEP for the paramedics.  The ST segment elevations are pretty widespread - Leads V3, V4, V5, V6, I and II all show some STE.  There are also "hyperacute" T waves in the leads with STE.  There are ST abnormalities ranging from flattening of the shape to depression, but the bottom line is this patient is a 60-year-old man with substernal chest pain radiating down his left arm!

The patient was treated in the ambulance with chest pain protocols, and was transferred to a hospital with an interventional cath lab.  The patient was conculusively diagnosed with an acute M.I. and underwent angioplasty.

This is a good ECG to demonstrate subtle changes when, combined with patient presentation, can help us diagnose a coronary event.  It helps us emphasize that not all STEMIs will have dome-shaped, "tombstone" ST segments, and that patient symptoms, history, and age are important to consider.

Dawn's picture

ECG Teaching Series: ST Elevation M.I. With Atypical DeWinter T waves

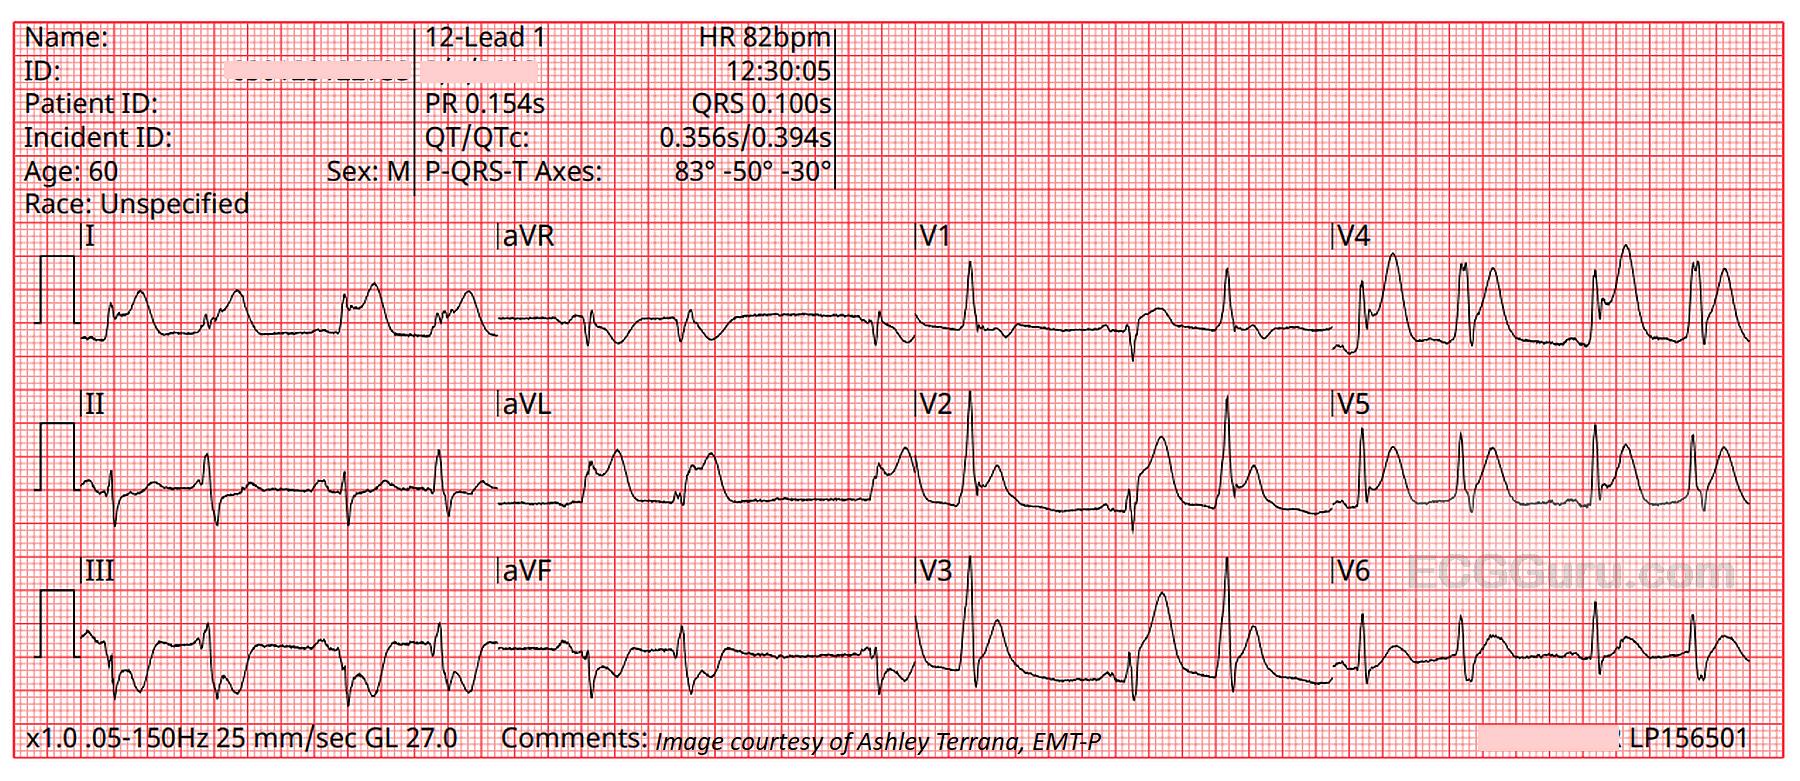
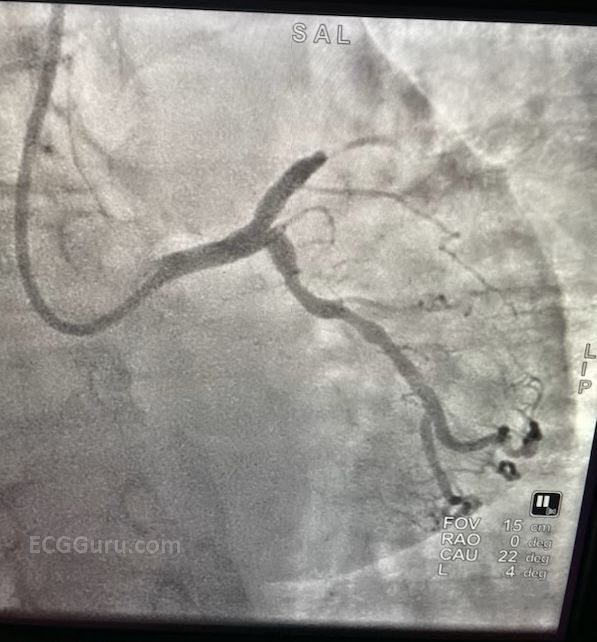
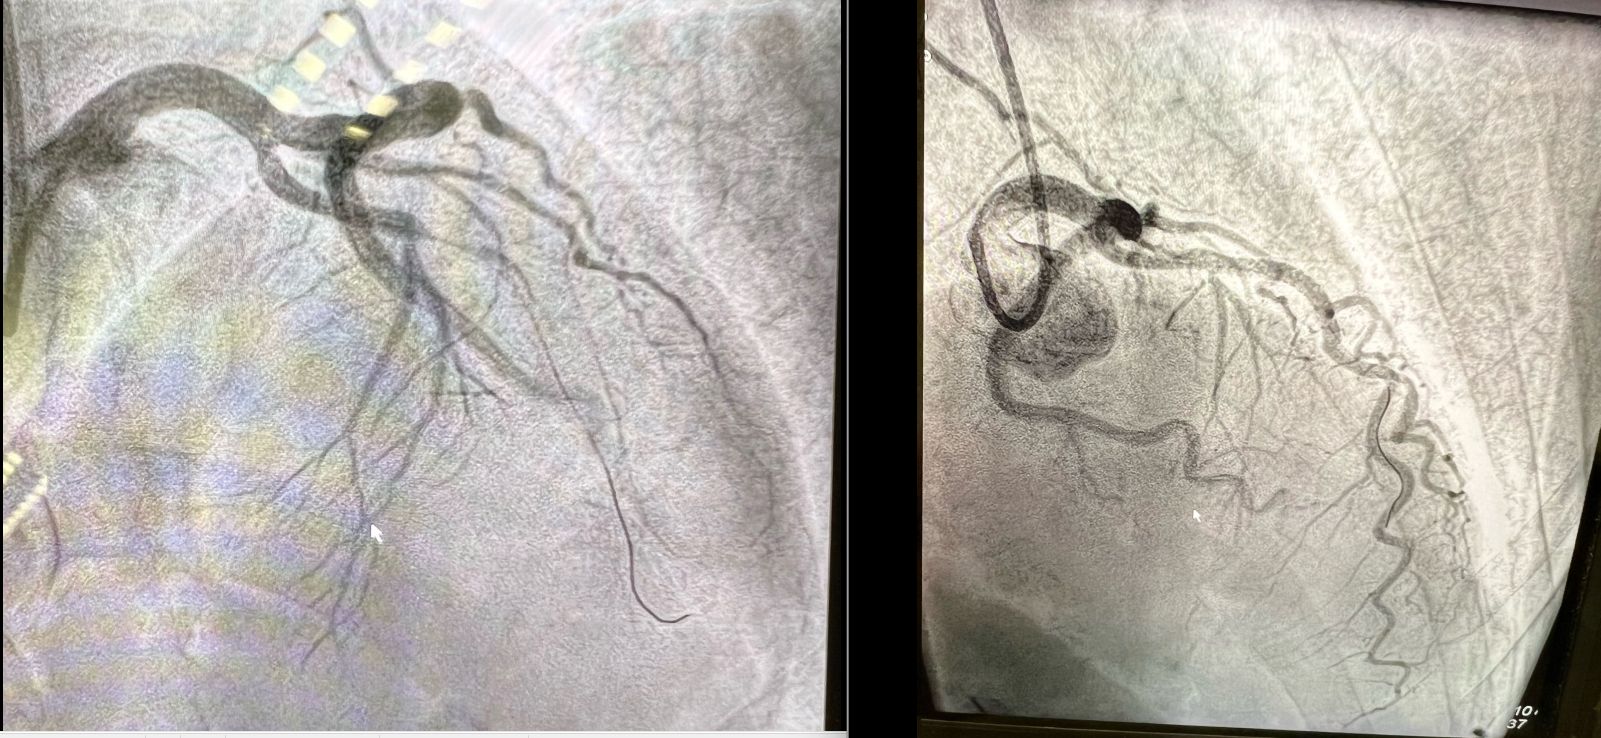
This series shows the evolution of ECG changes in anterior wall M.I. secondary to occlusion of the proximal left anterior descending artery.  The patient is an 88-year-old woman with chest pain.  She was designated a "cardiac alert" from the field by paramedics.  Her proximal LAD was opened and stented in the cath lab.  We do not have follow-up information on her.

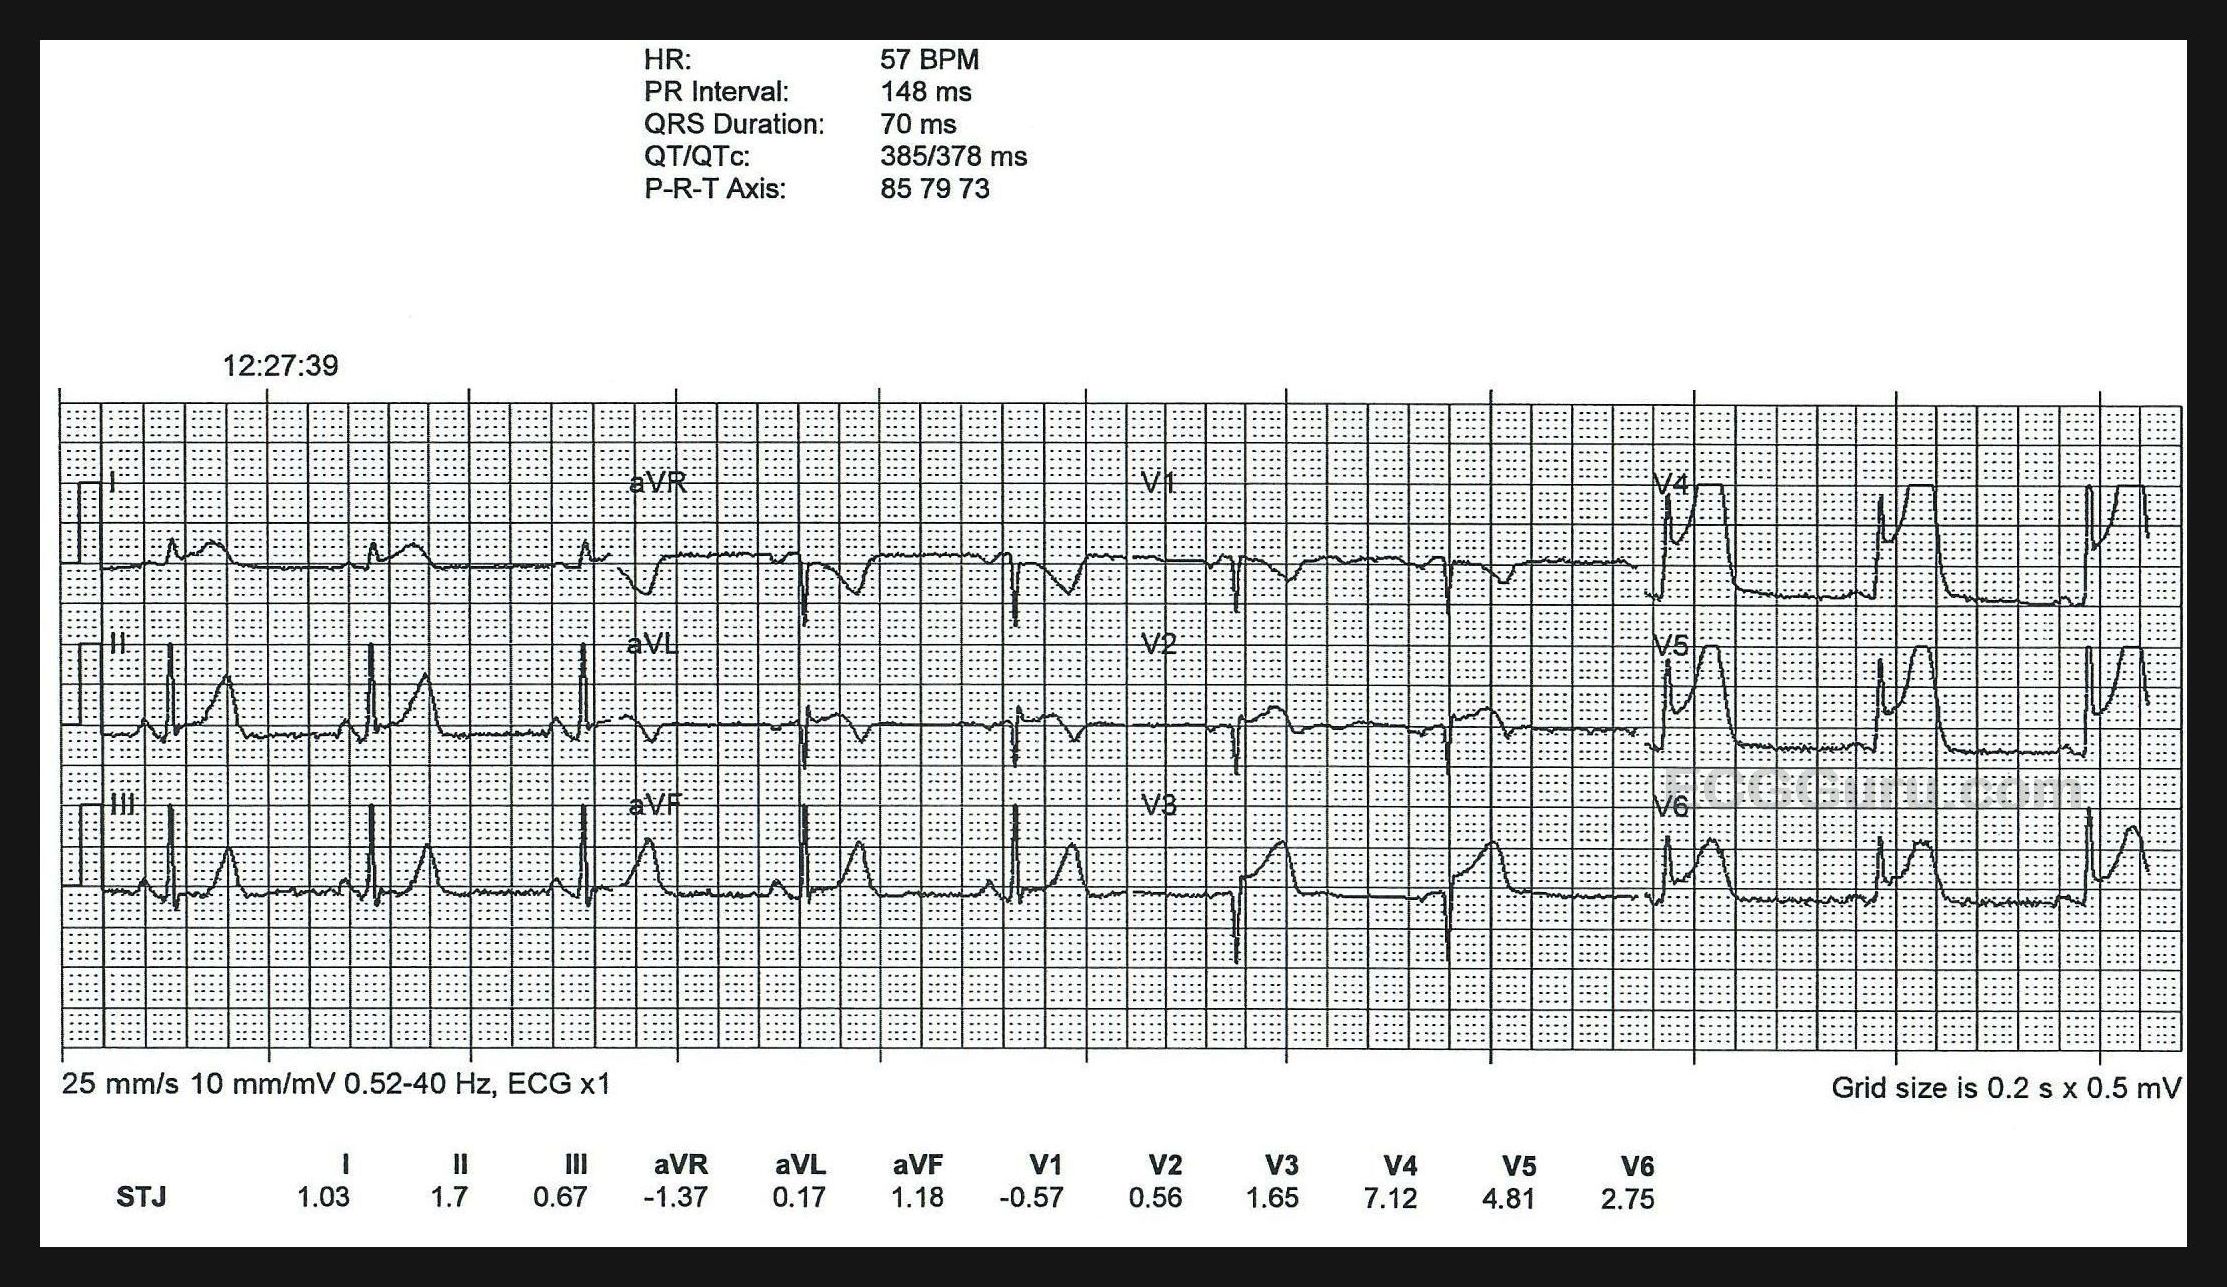
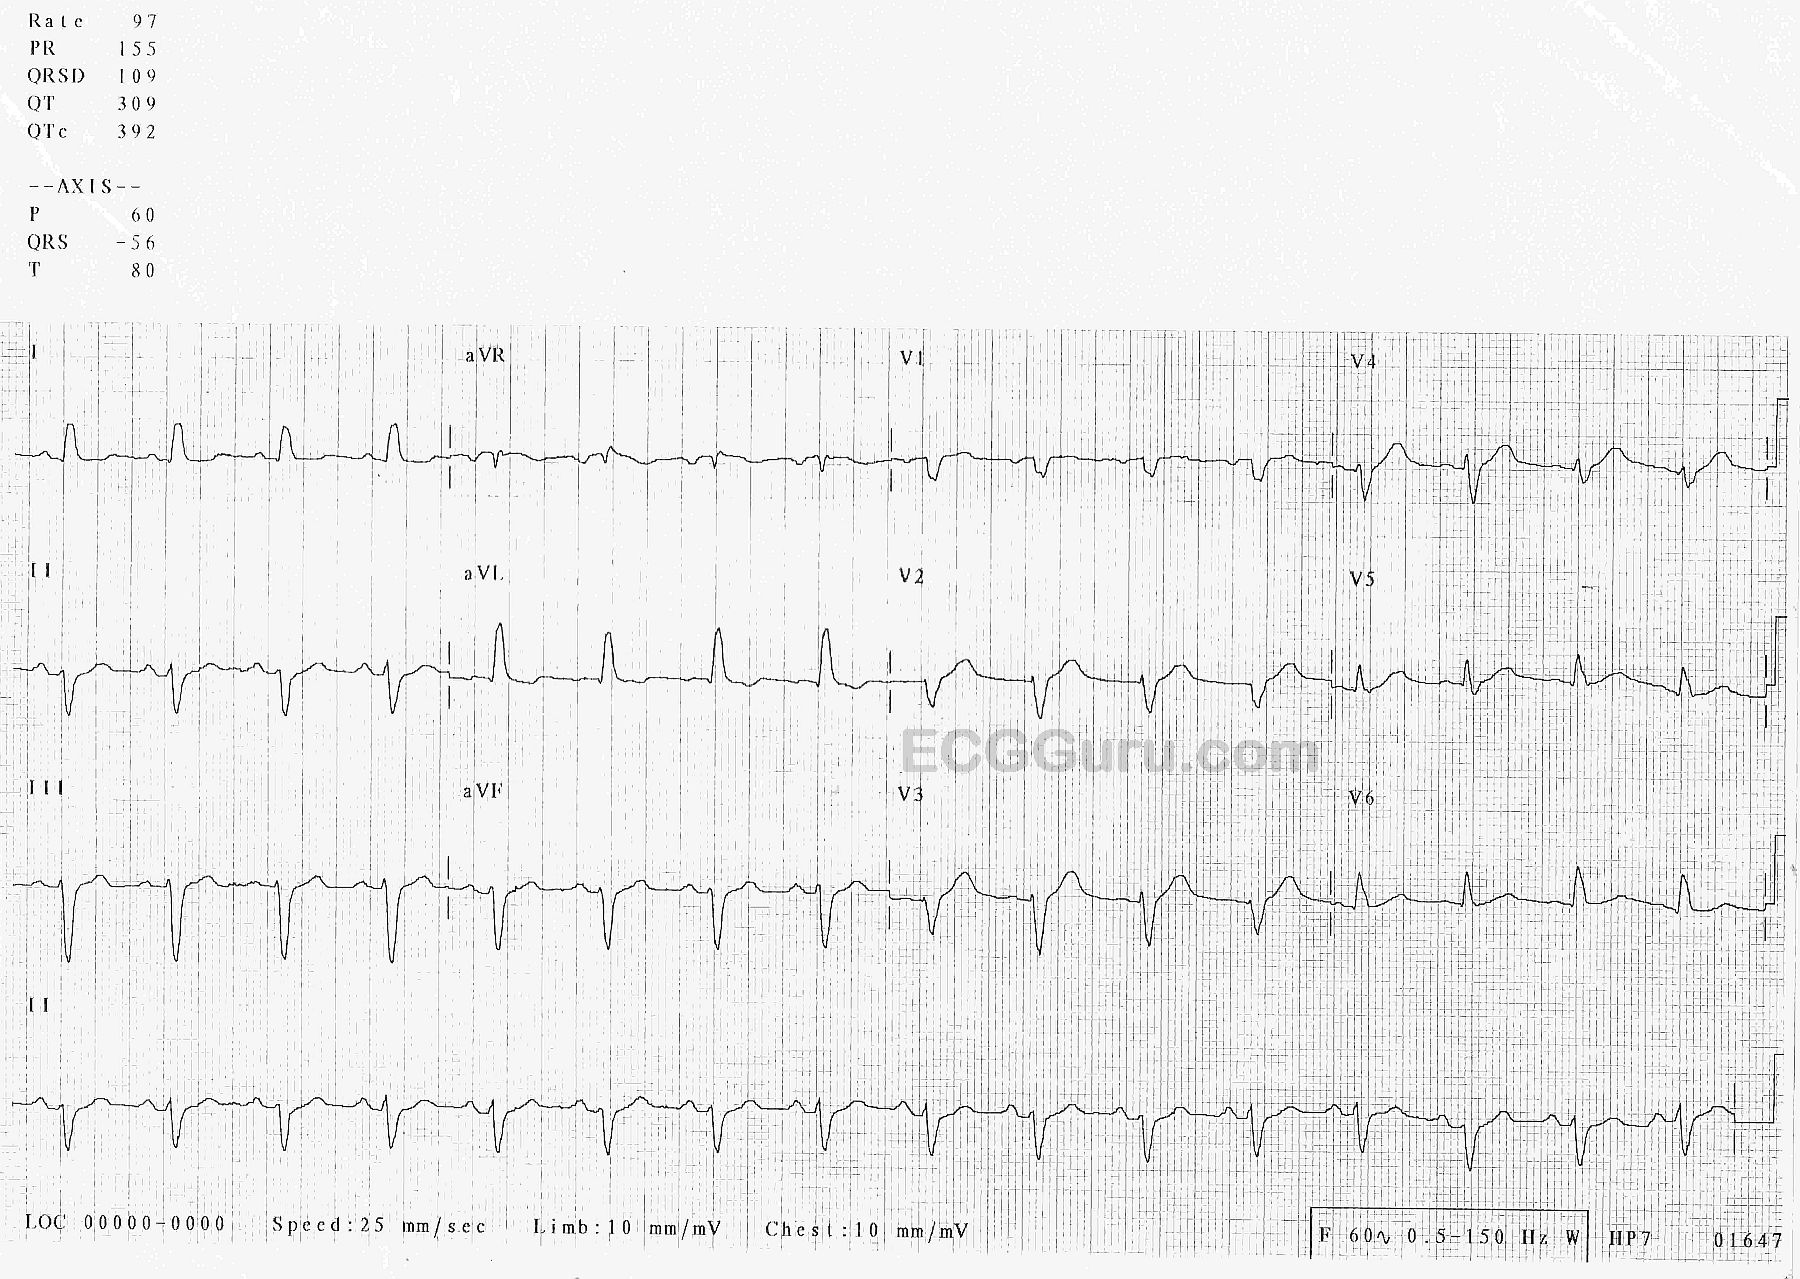
The first ECG in the series, titled "12-Lead 3", shows ST elevation at the J point in V1 through V3.  In addition, the T waves are "hyperacute" - tall, broad, and asymmetrical. This can be an early, transient sign of myocardial injury.  Slight reciprocal depressions are seen in the inferior leads.  Lead V4 has a T wave inversion that is out of place with the progression of the T waves in V3 and V5.  Lead placement may be to blame.  Hyperacute T waves in a patient with chest pain should be taken very seriously.

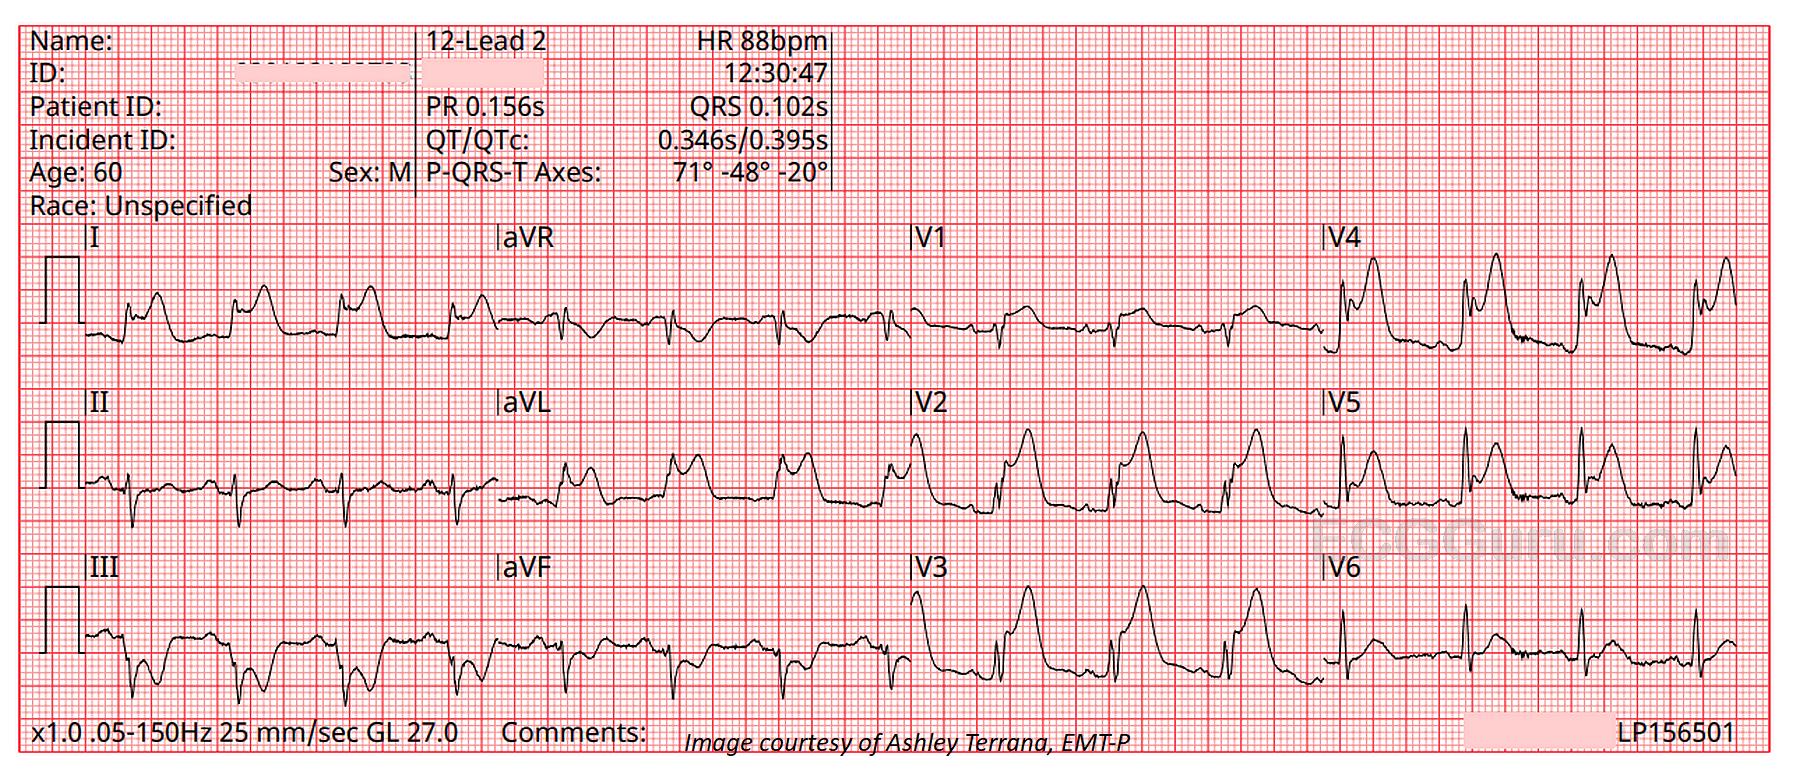
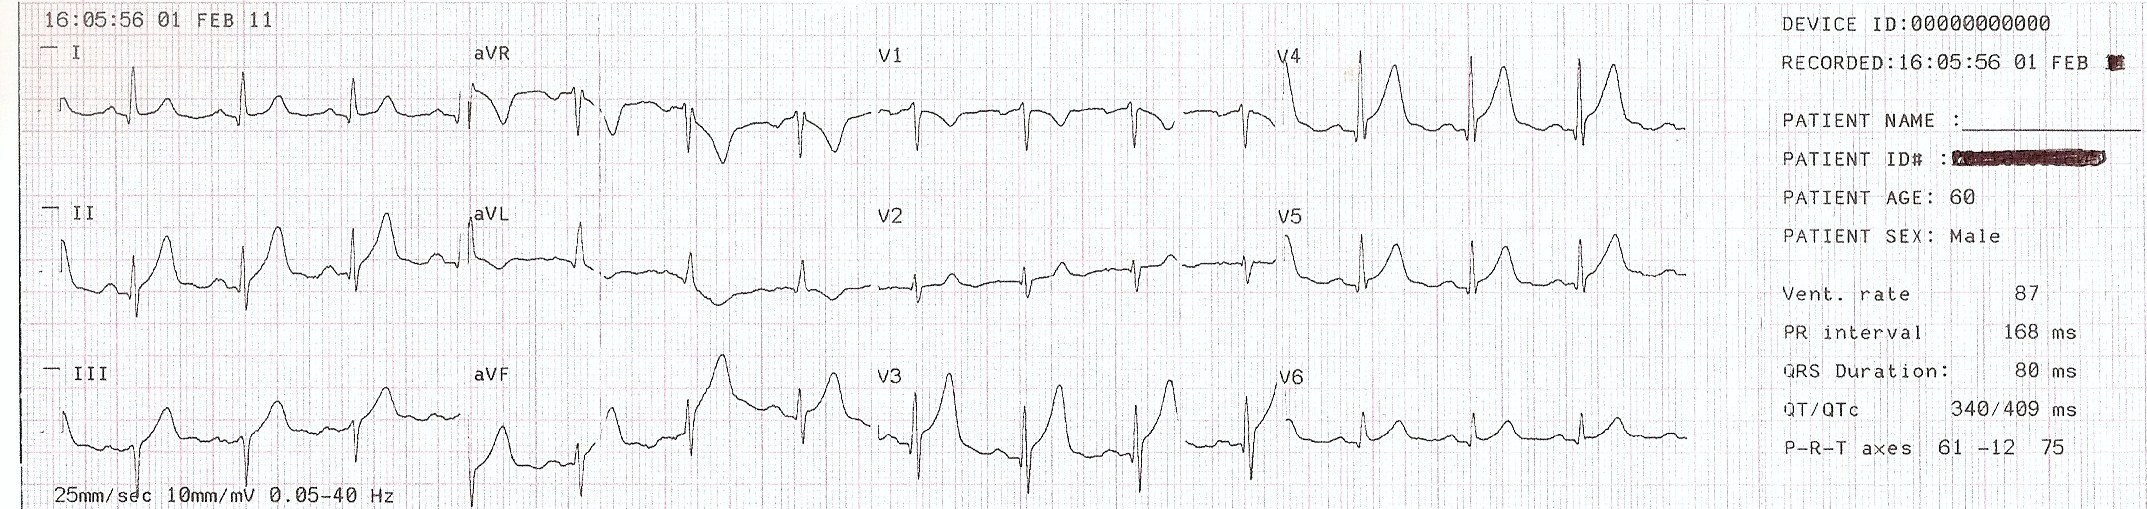
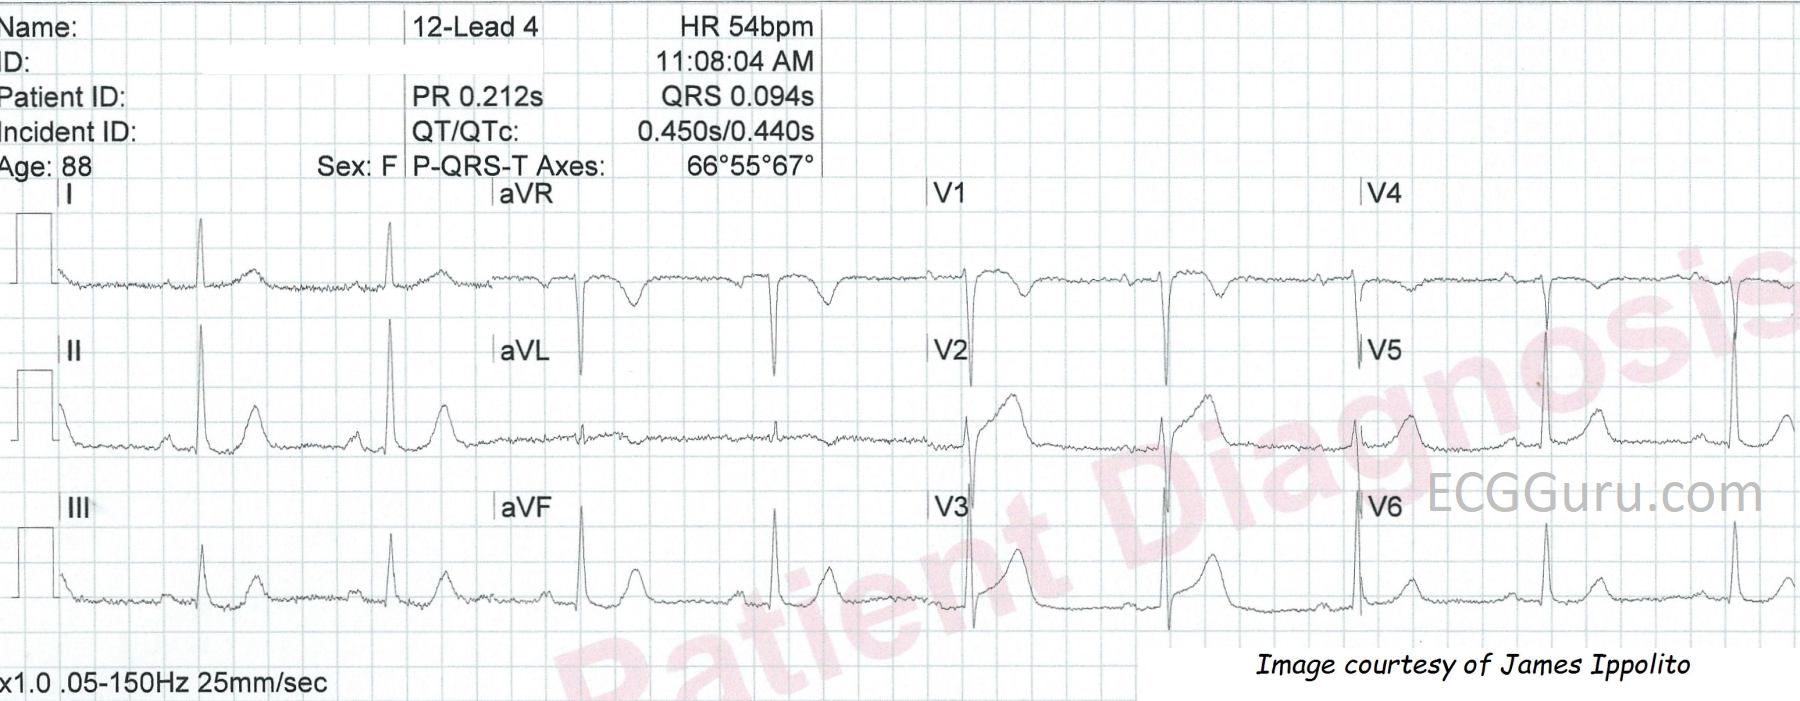
The second ECG, titled "12-Lead 4", shows continued elevation at the J point in Leads V1 through V3, with a lessening of T wave amplitude.  In addition, Lead aVL is showing some T wave changes. The T wave is biphasic, and may be about to become inverted.  This is not an improvement!  V1 through V3 show us the anterior-septal wall, and an M.I. here indicates occlusion in the LAD.  Leads I and aVL show the high lateral area of the anterior wall, and damage here is an indicator that the occlusion is proximal.

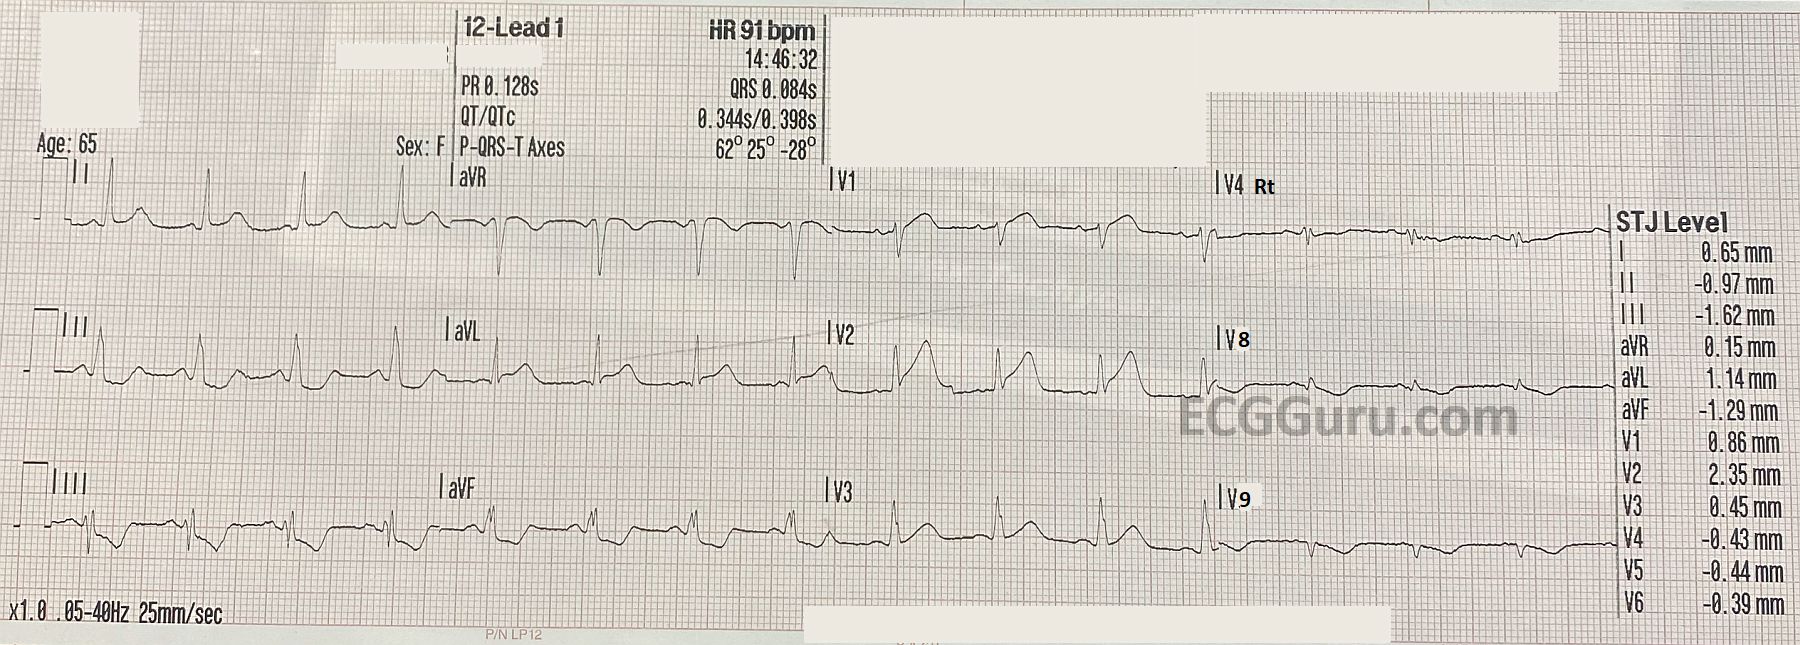
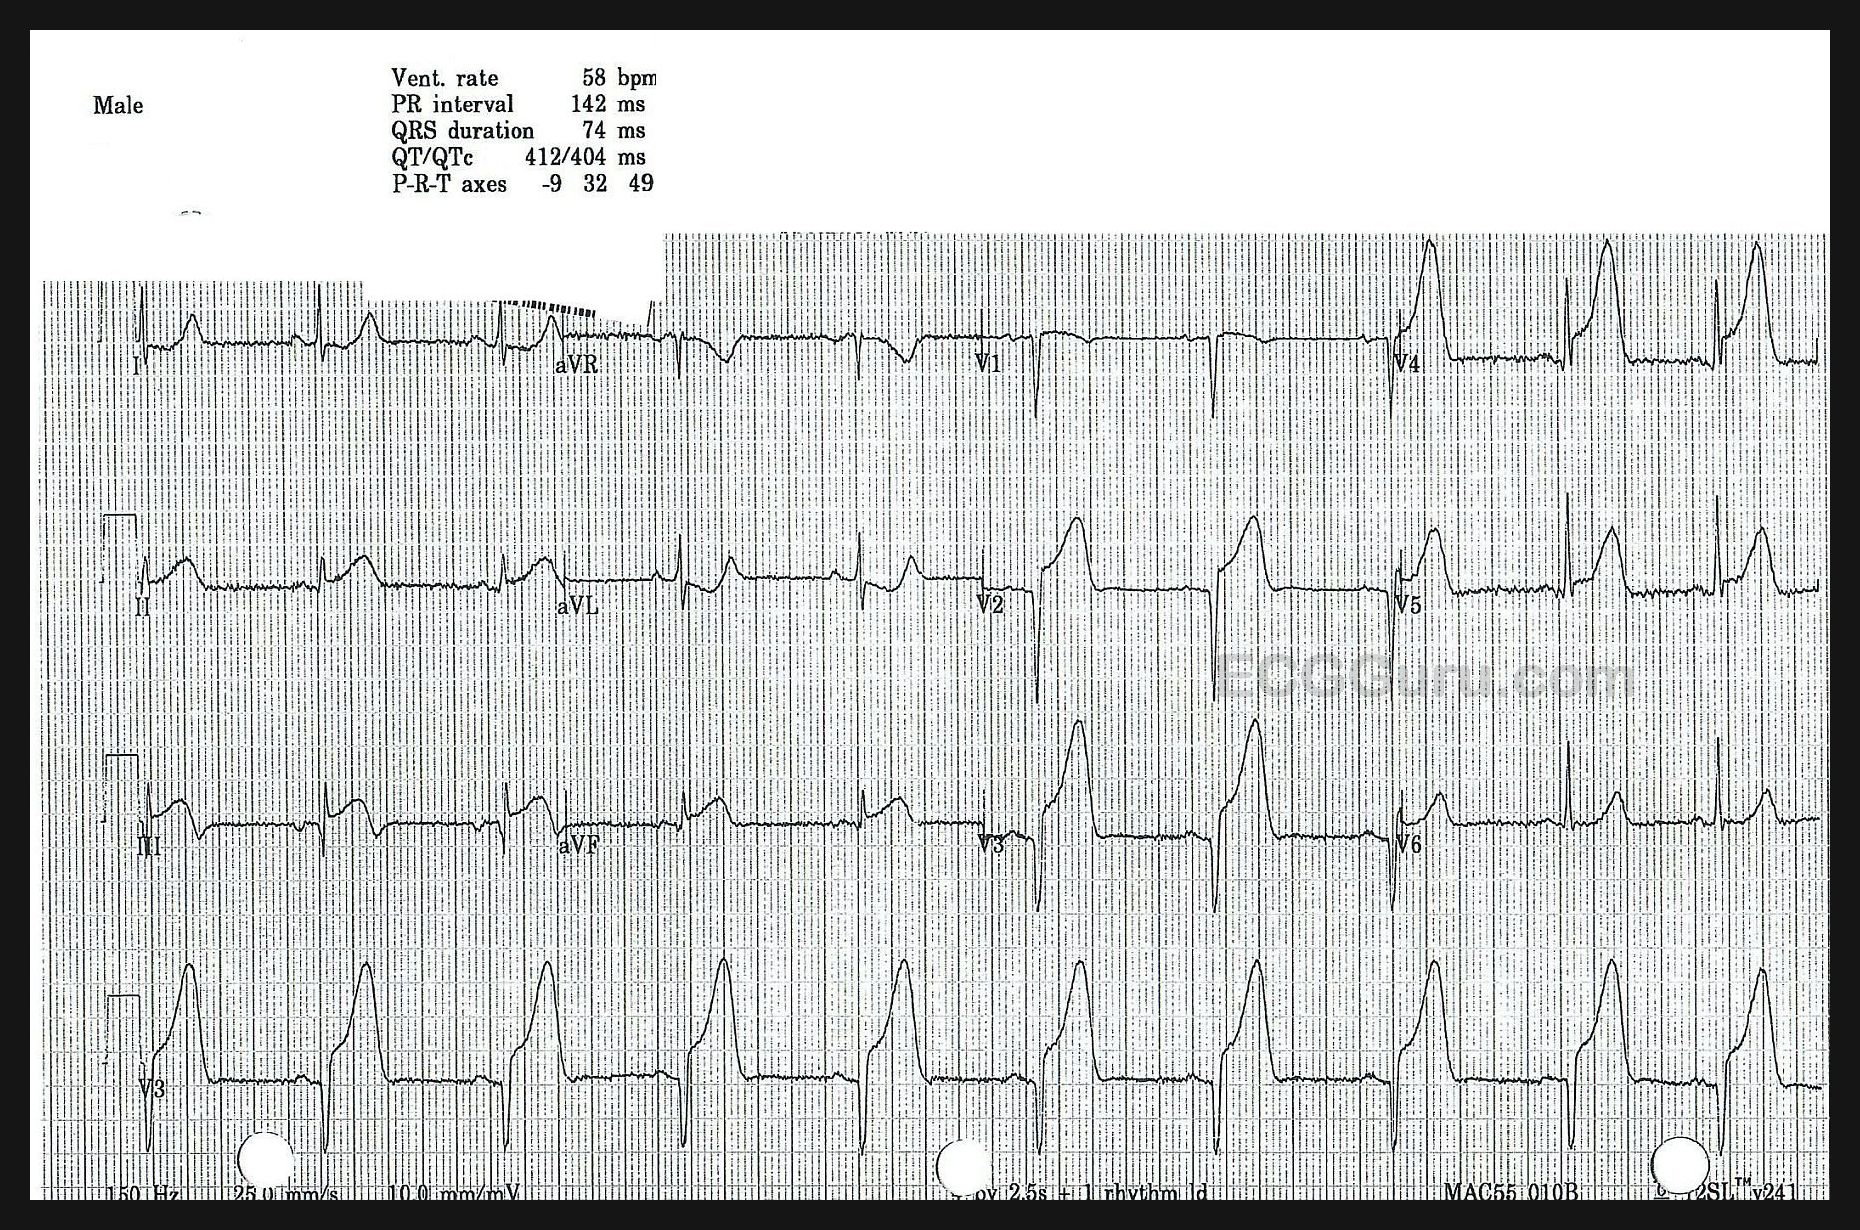
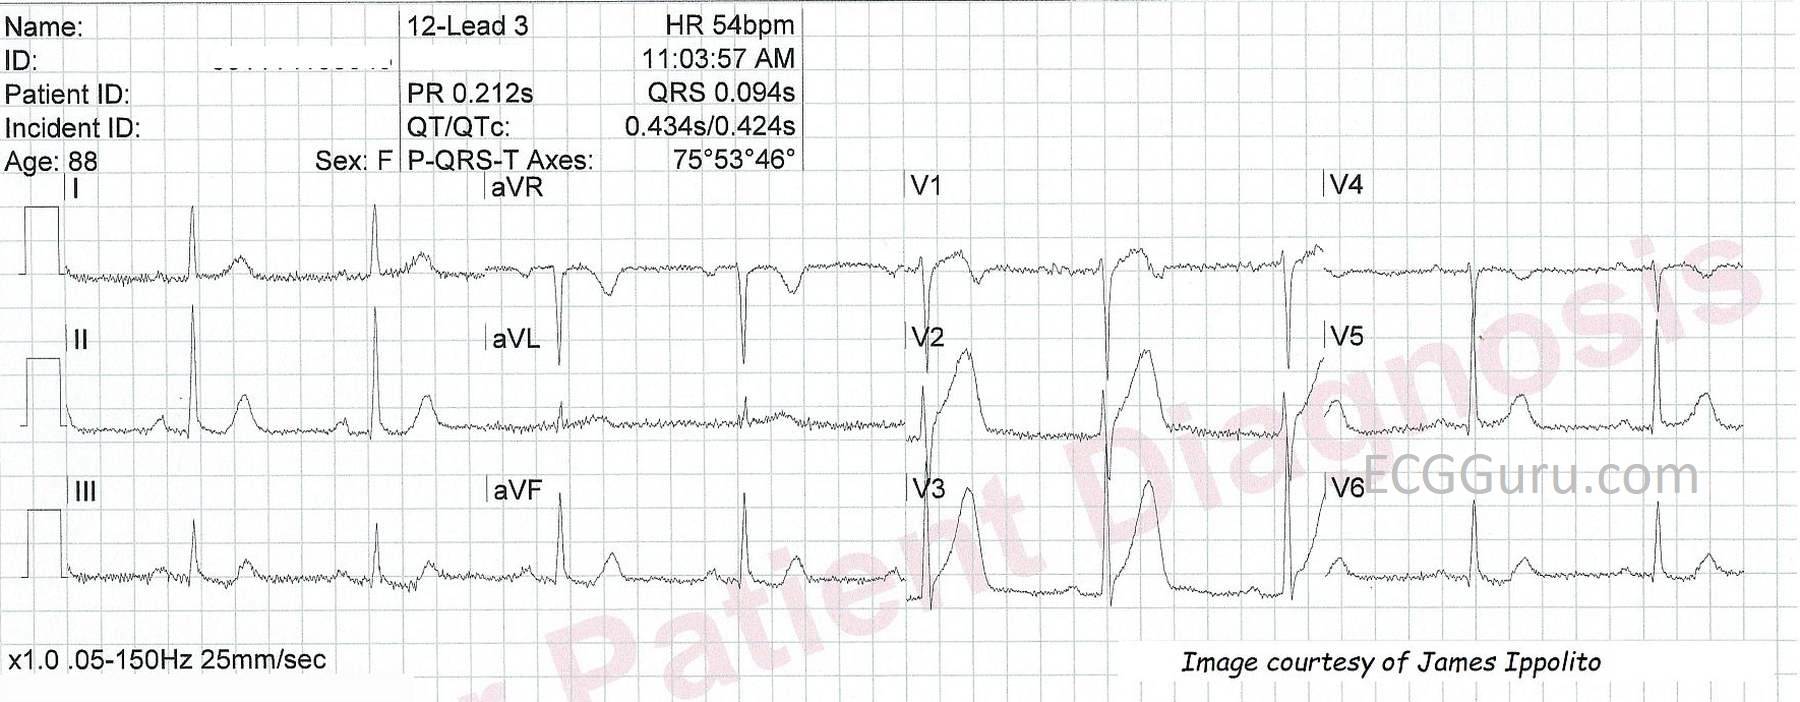
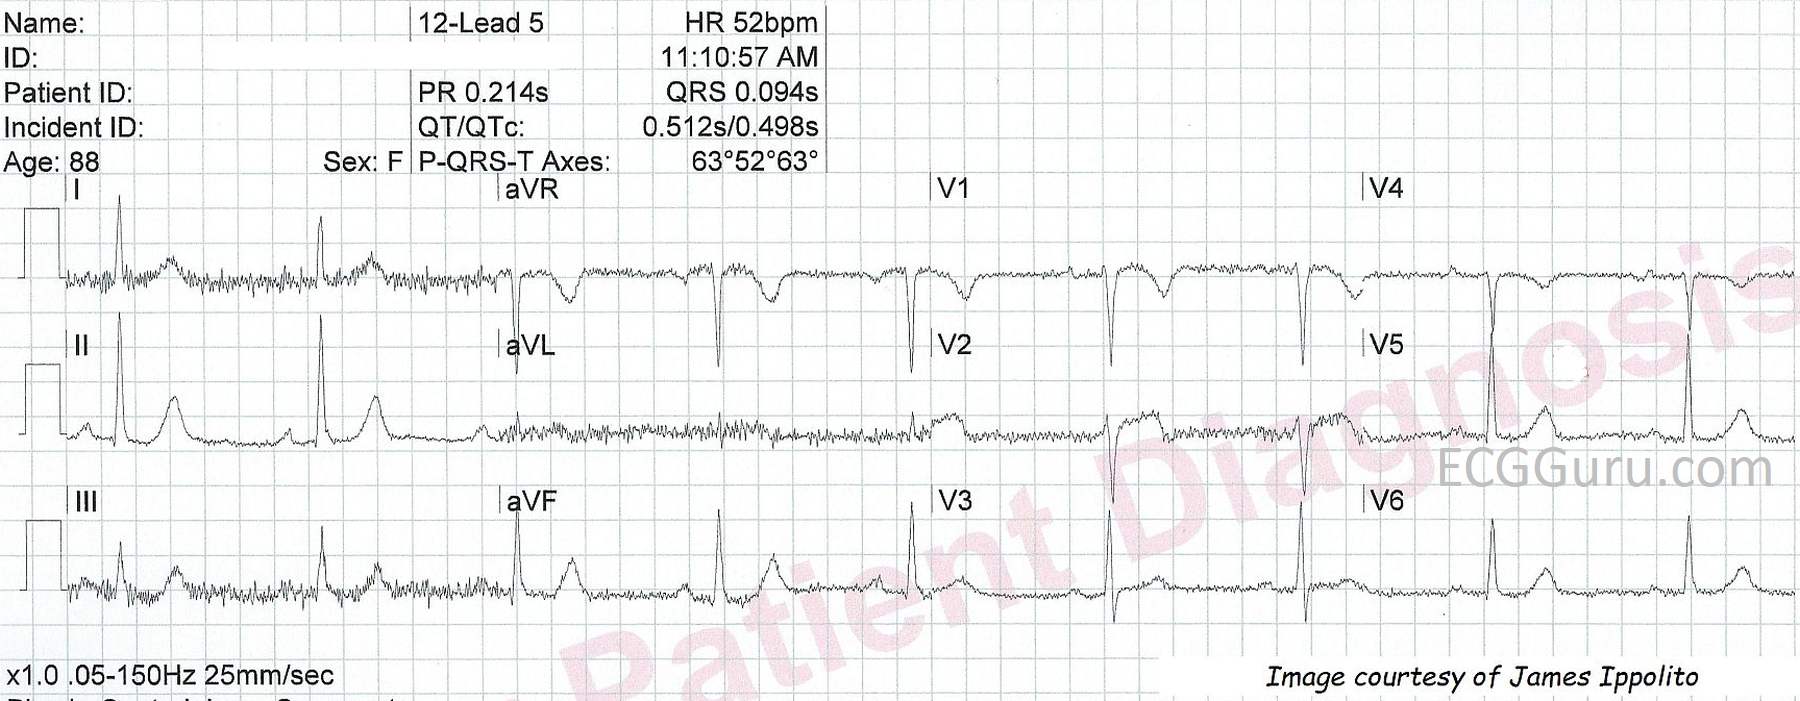
The third ECG, titled "12-Lead 5", shows a "maturing" of the ST segment elevation.  Even though there is some significant artifact, we can see that the ST segment in V1 is coved upward, and the ST segment in V2 is flat.  Both shapes are abnormal, and a sign of CAD.  The T waves have become less pronounced, but V2 looks as if the T wave may become inverted in the near future.  V3 looks improved in this image.

The patient's clinical symptoms did not improve during these ECG changes.  Hyperacute T waves are not a definitive sign of STEMI, but they provide a highly visible warning that may catch attention.  They definitely are an indication to run serial ECGs, as these paramedics did.


All our content is FREE & COPYRIGHT FREE for non-commercial use

Please be courteous and leave any watermark or author attribution on content you reproduce.