Displaying 1 - 10 of 19
Dr A Röschl's picture

Atrial Flutter With Right Bundle Branch Block and Left Anterior Fascicular Block In a Patient With Preexisting RBBB + LAFB

If a wide complex tachycardia occurs, the probability is very high that it is a ventricular tachycardia (approx. 80%, in patients with a previous myocardial infarction (...) approx. 90%). Here we see a broad complex tachycardia that looks like an RBBB + LAFB, which is regular. In this constellation, 3 causes must be considered:
1. fascicular tachycardia from the left posterior fascicle of the left tawara fascicle (QRS width usually only around 130 ms, but sometimes significantly longer).
2. AT/AFL with 2:1 conduction in the case of pre-existing bifascicular block

Dr A Röschl's picture

Impending Trifascicular AV Block

Here we see the EKG of a 63-year-old man with CAD without relevant coronary stenosis. He complains of slightly reduced performance, but no other symptoms. The ECG shows the following changes:

Dawn's picture

Non-specific IVCD With Peaked T Waves

The Patient:   This ECG was obtained from an elderly man who was suffering an exacerbation of congestive heart failure.  He had a history of CHF and hypertension.  We do not have other history available to us.

The ECG:  The rhythm is sinus at 97 bpm (fast for this patient). It is regular with no ectopy.  The PR interval is 155 ms (.15 seconds), and the P waves are upright in the inferior leads. The frontal plane QRS axis is -56 degrees – abnormally leftward.  Notice that Leads II, III, and aVF are all negative.  AVR is equiphasic – the axis travels perpendicular to the positive electrode of aVR, toward the patient’s left shoulder.  The QRS duration is 111 ms (.11 sec.).  This is very close to being wide enough for a diagnosis of left bundle branch block, and represents poor conduction throughout the ventricles. On the chest leads side, there is poor R wave progression. V1 through V4 look almost the same, small r and large S.

The ST segments are generally concave up, and the J points are at the baseline – no ST elevation or depression.  There are no pathological Q waves, unless we count V1, which may have lost it’s Q wave as part of the general poor R wave progression.

Dawn's picture

Wide Complex Tachycardia

This pair of ECGs feature one of our recurring themes:  wide-complex tachycardia (WCT). It is a fascinating topic, as tachycardia has many causes and many mechanisms, and wide QRS also has many causes, with the mechanism being slow conduction through the ventricles. 

Sometimes, it is not possible to diagnose the true origin of a WCT from one ECG, or even serial ECGs.  Is the tachycardia due to increased sympathetic activity (fear, dehydration, exercise, hypoxia, hypovolemia, etc.)?  Or is the fast rate due to reentry, where one impulse gets “caught” in a loop, repeating itself rapidly, and depolarizing the myocardium with each pass?  What is the location of the pacemaker that is responsible for the rhythm?  Is it a supraventricular rhythm that has suffered an intraventricular conduction delay, widening the QRS?  Or is the rhythm originating in a ventricular pacemaker, without the ability to travel on the fast highway that is the intraventricular conduction system? 

If you or your students work in an acute care setting, such as pre-hospital or emergency department, you may not be with the patient long enough or be able to conduct enough tests to determine without a doubt the answers to the above questions.  Some WCTs cause such severe symptoms that they must be dealt with quickly, to avoid rapid deterioration to ventricular fibrillation.  For that reason, there is a widely-accepted rule for WTC treatment:

TREAT ALL WIDE-COMPLEX TACHYCARDIA AS IF IT IS V TACH UNTIL PROVEN OTHERWISE.    

Dawn's picture

High-grade AV Block With Profound Bradycardia

If you are an ECG instructor, you probably carefully choose ECGs to illustrate the topic you are teaching. One of the reasons for the existence of the ECG Guru website is our desire to provide lots of such illustrations for you to choose from.

Sometimes, though, an ECG does not clearly illustrate one specific dysrhythmia well, because the interpretation of the ECG depends on so many other factors.  In order to get it “right”, we would need to know information about the patient’s history, presentation, lab results, or previous ECGs. We might need to see the ECG done immediately before or after the one we are looking at.  Some ECG findings must ultimately be confirmed by an electrophysiology study before we can know for sure what is going on.

For those of us who are “ECG nerds”, it can be fun to debate our opinions and even more fun to hear from wiser, more advanced practitioners about their interpretations.

My belief, as a clinical instructor, is that we must teach strategies for treating the patient who has a “controversial” ECG that take into account the level of the practitioner, the care setting, and the patient’s hemodynamic status.  In some settings, it might be absolutely forbidden for a first-responder to cardiovert atrial fibrillation, for example.  But atrial fib is routinely cardioverted under controlled conditions in hospitals.  The general rule followed by emergency providers that “all wide-complex tachycardias are v tach until proven otherwise” has no doubt prevented deaths in situations where care providers did not agree on the origin of the tachycardia.

The ECG:    We do not have much patient information to go with this ECG, just that it is from a 71-year-old woman who developed severe hypotension and lost consciousness, but was revived with transcutaneous pacing.   Here is what we do know about this ECG:

·        There are regular P waves, at a rate of about 39 bpm (sinus bradycardia).

Dawn's picture

Syncope and tachycardia

The patient:  This ECG is taken from a 55-year-old man whose wife called 911 because he had a syncopal episode.  When the paramedics arrived, he was conscious and alert, and denied any symptoms.  He gave a history of "cardiac", diabetes, and opiate abuse.  We do not know the nature of his cardiac history or his medications.  

It is difficult to pinpoint a definite diagnosis with this lack of information and a clearly abnormal ECG.  We will limit our discussion to listing the abnormalities seen:

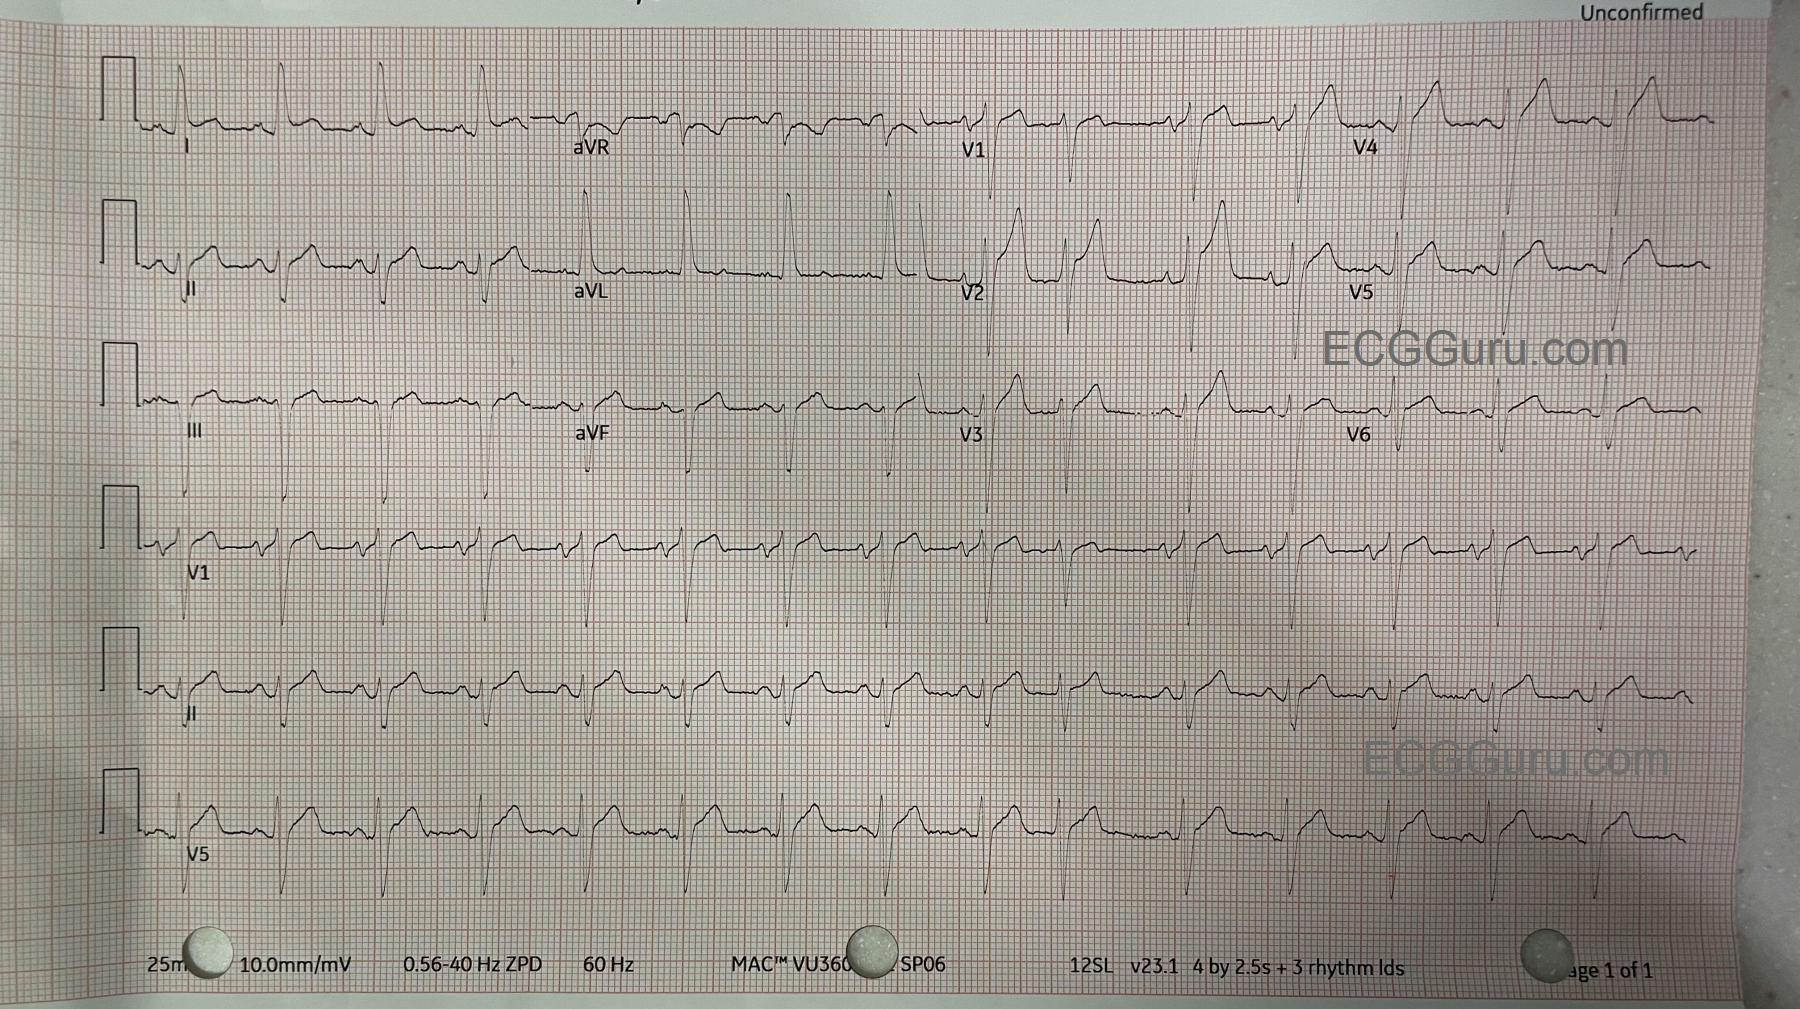
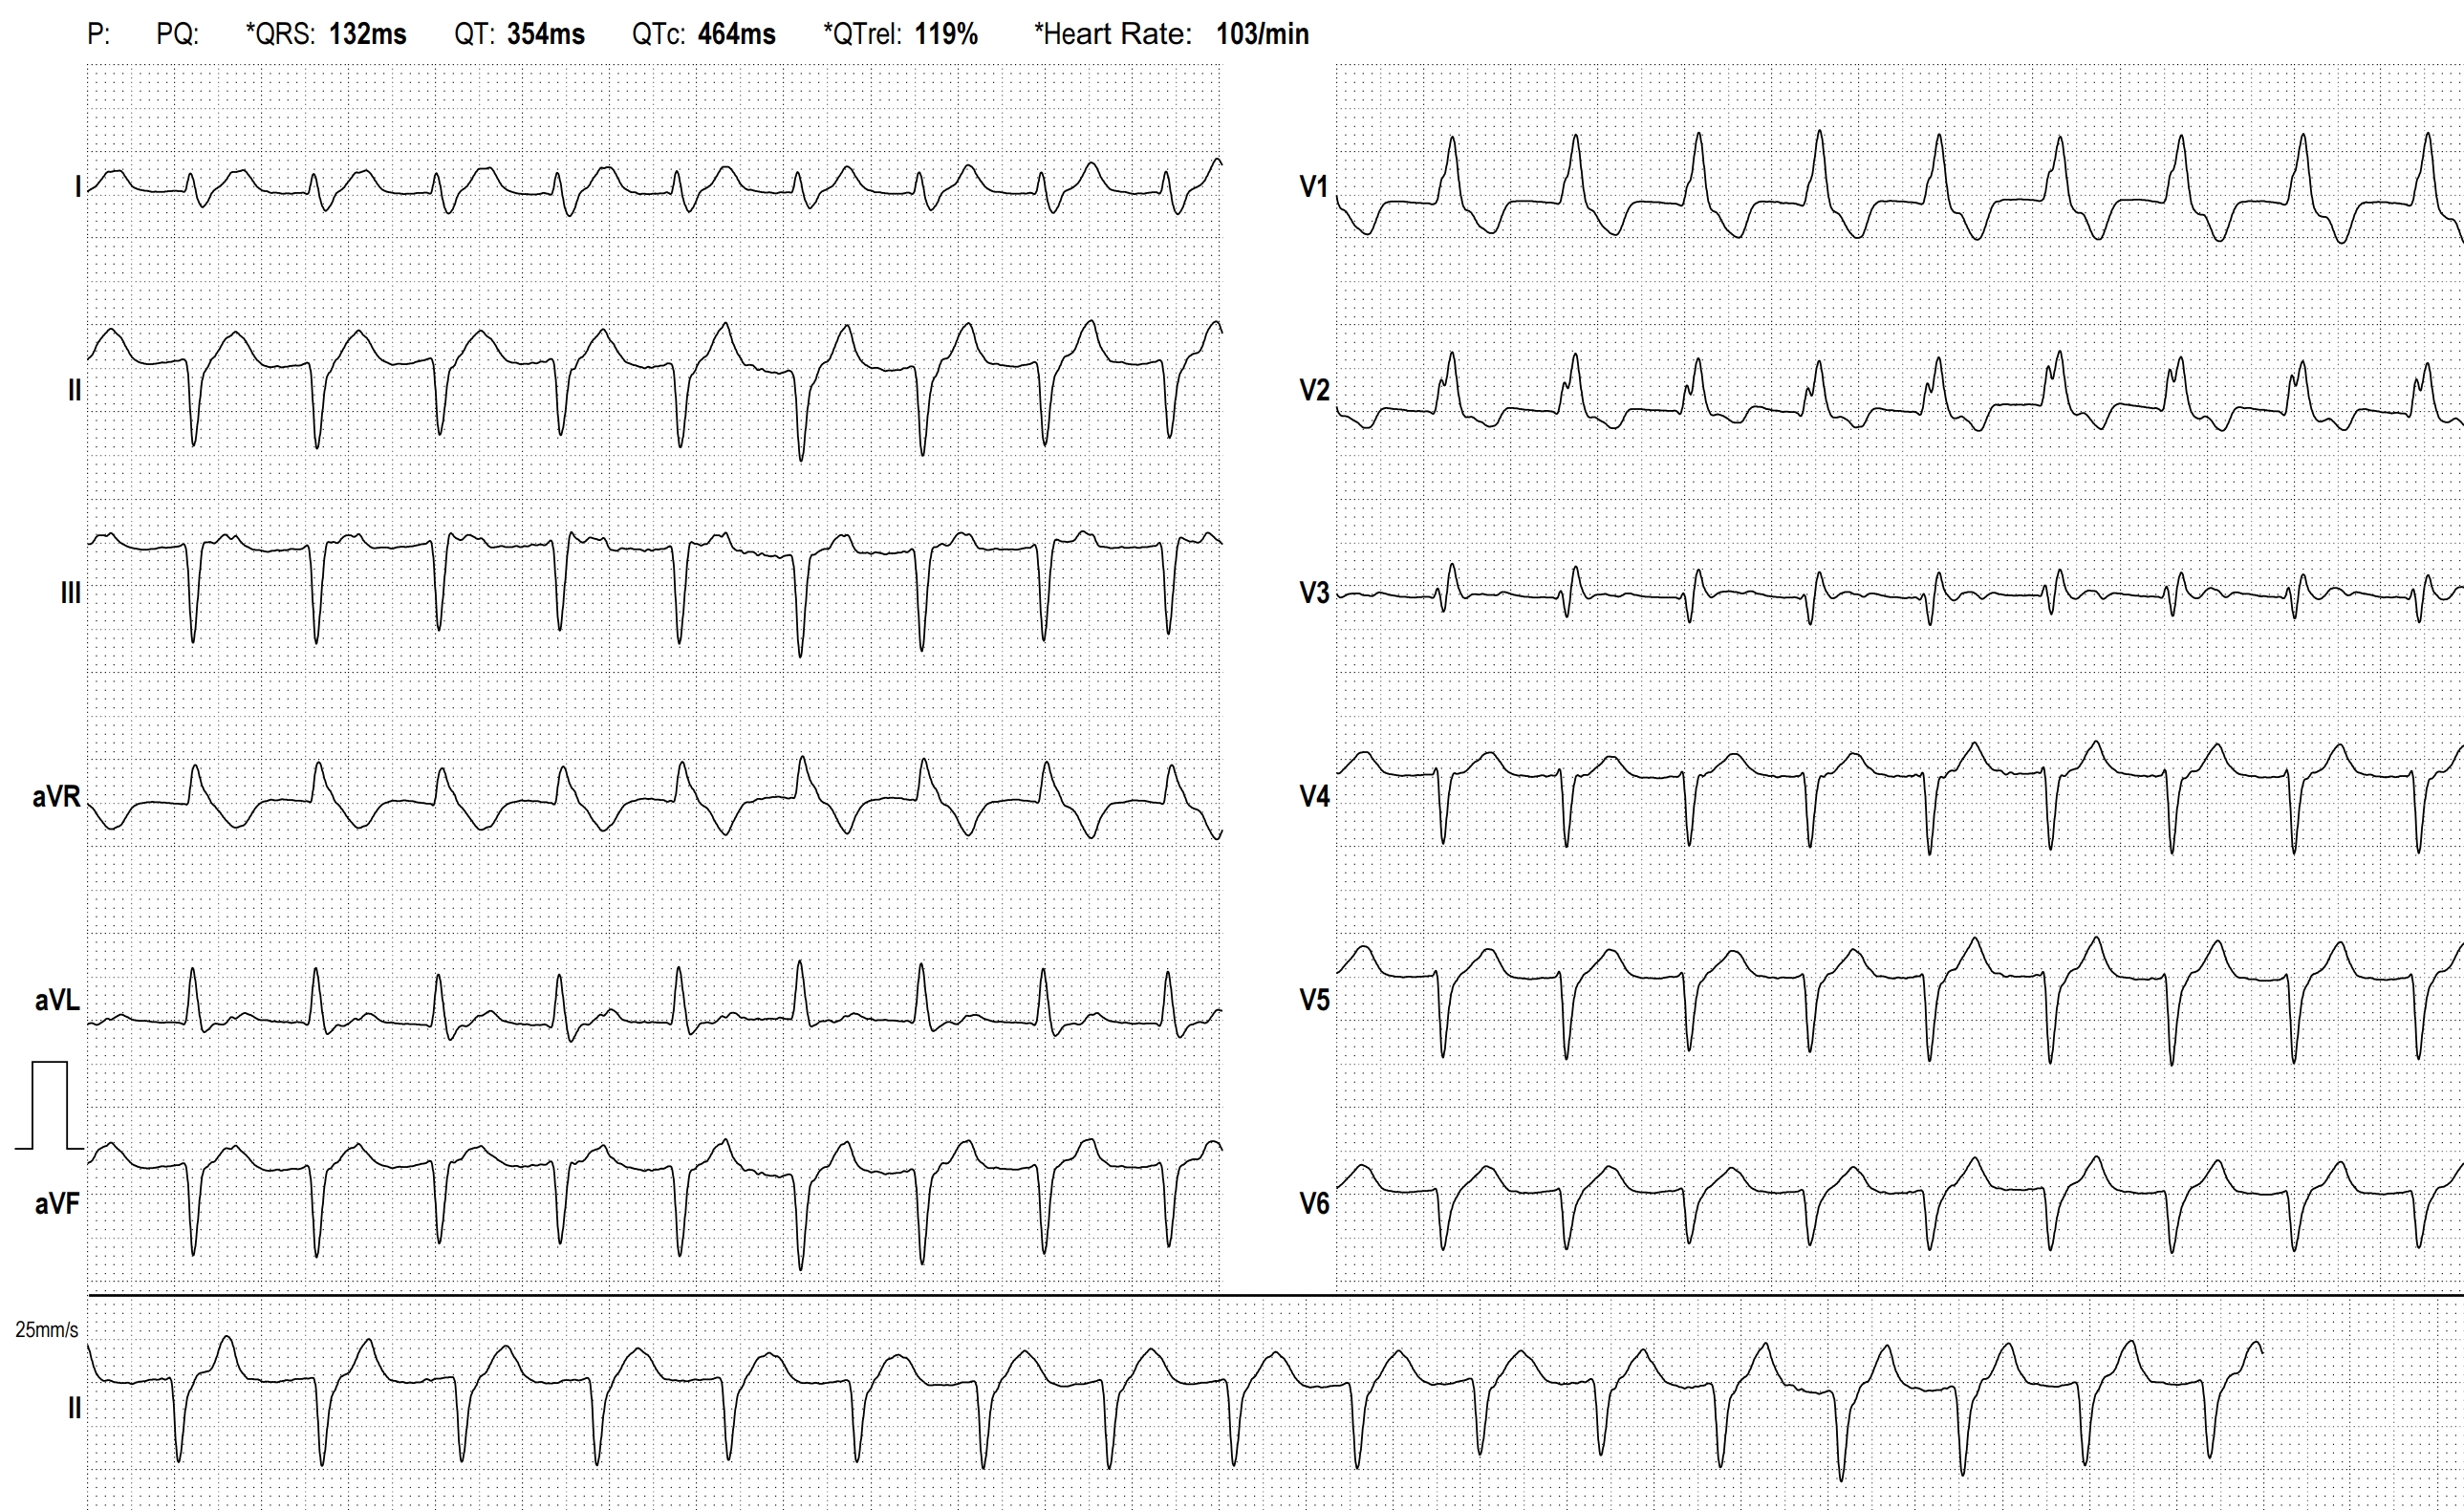
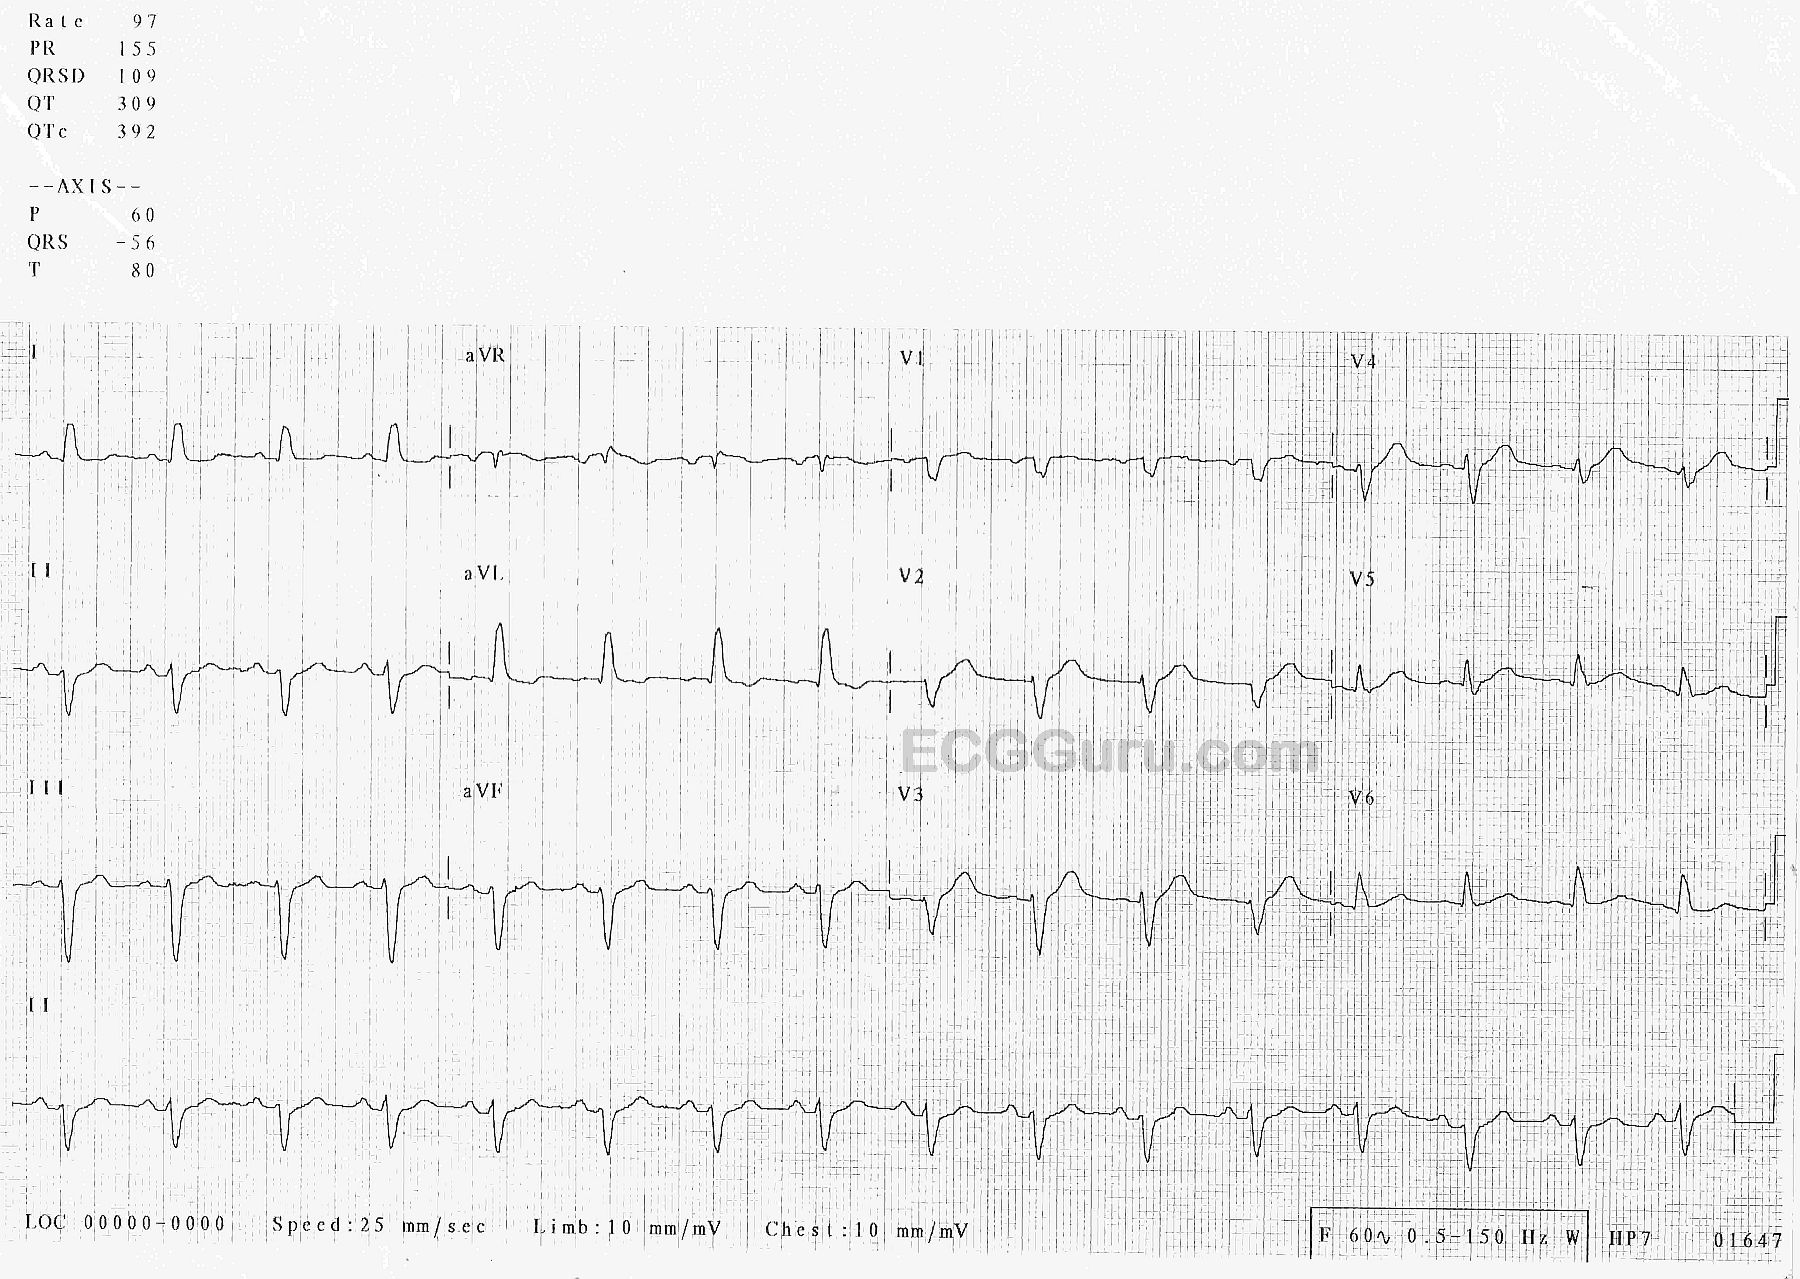
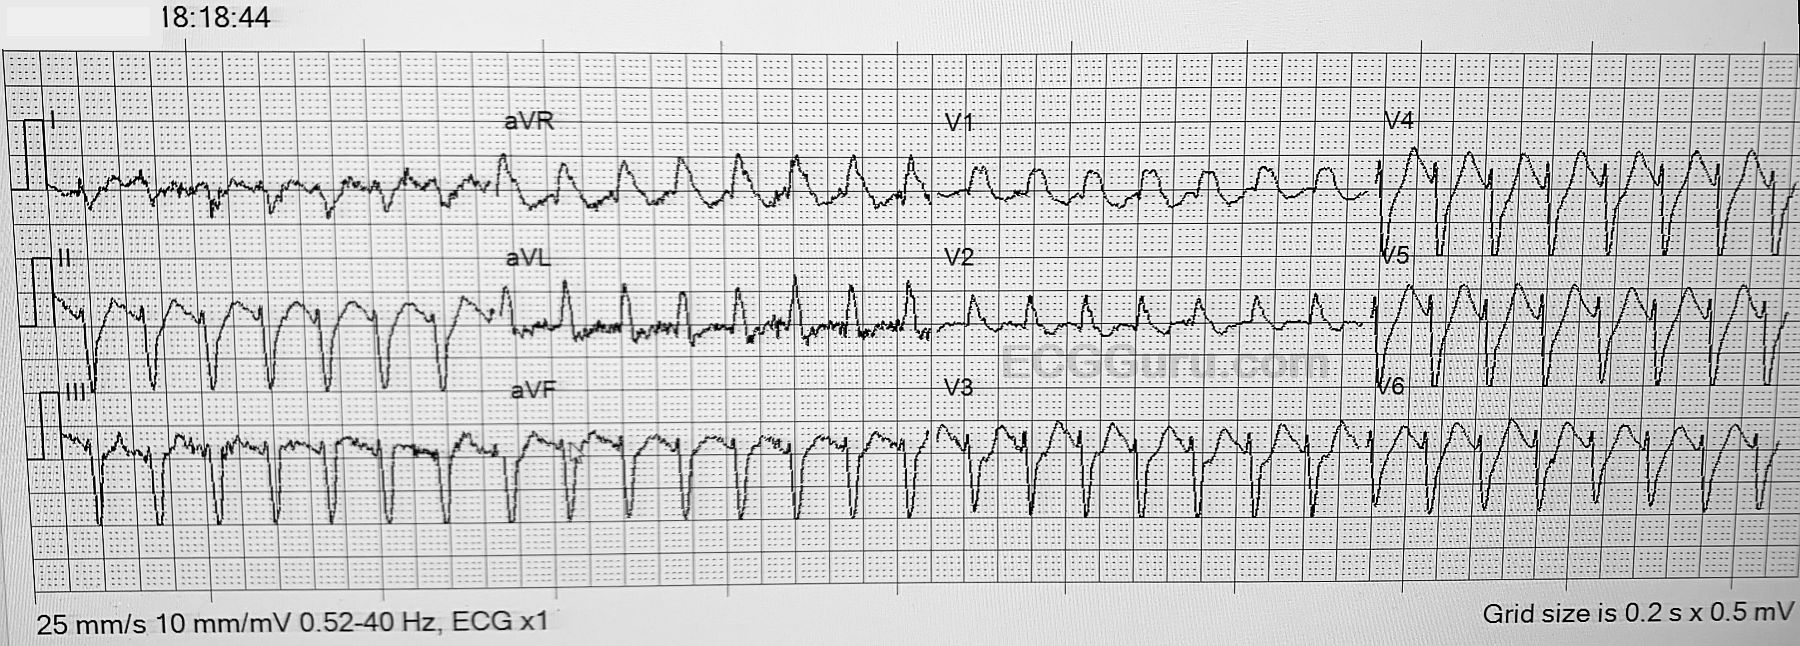
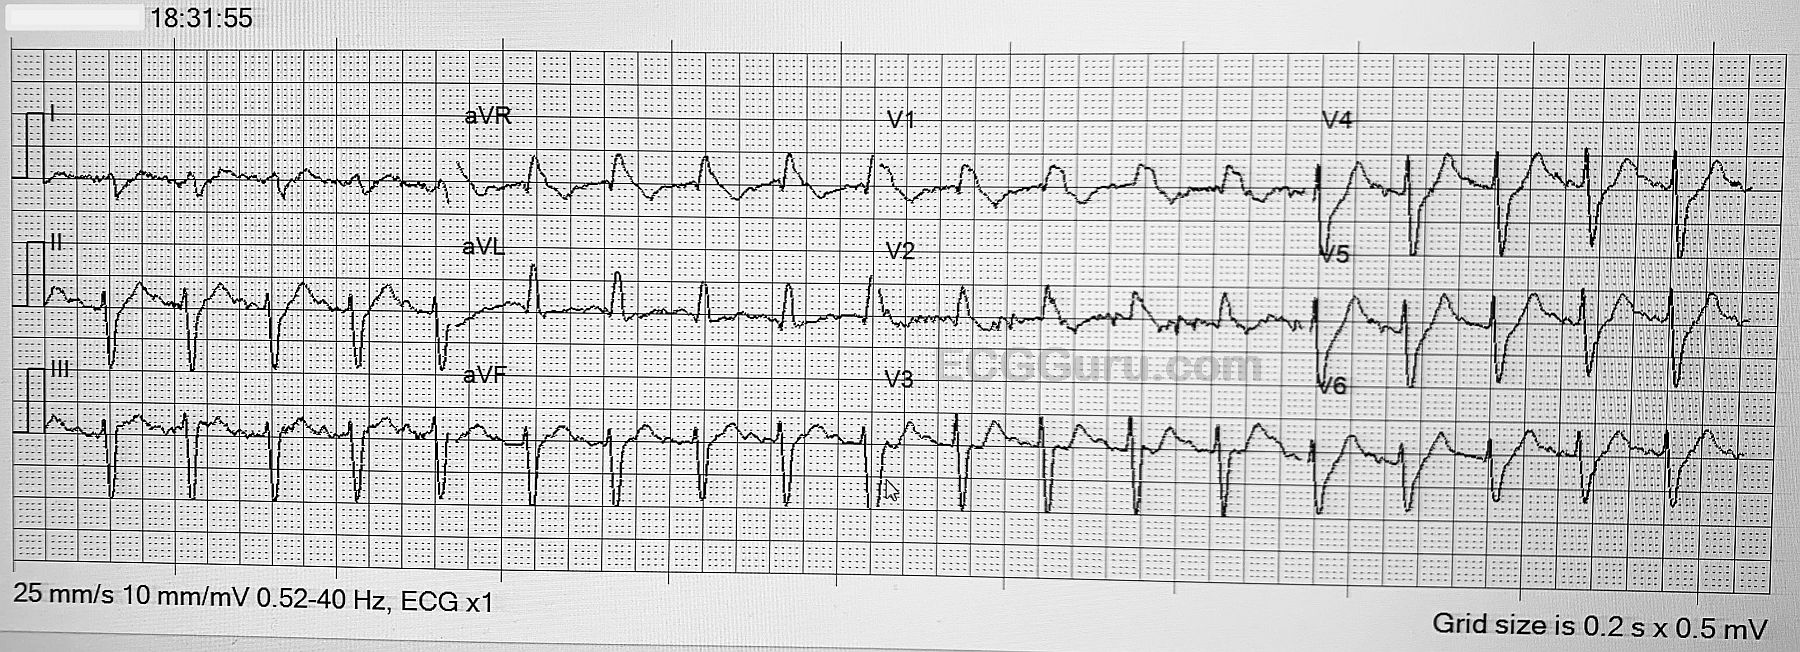
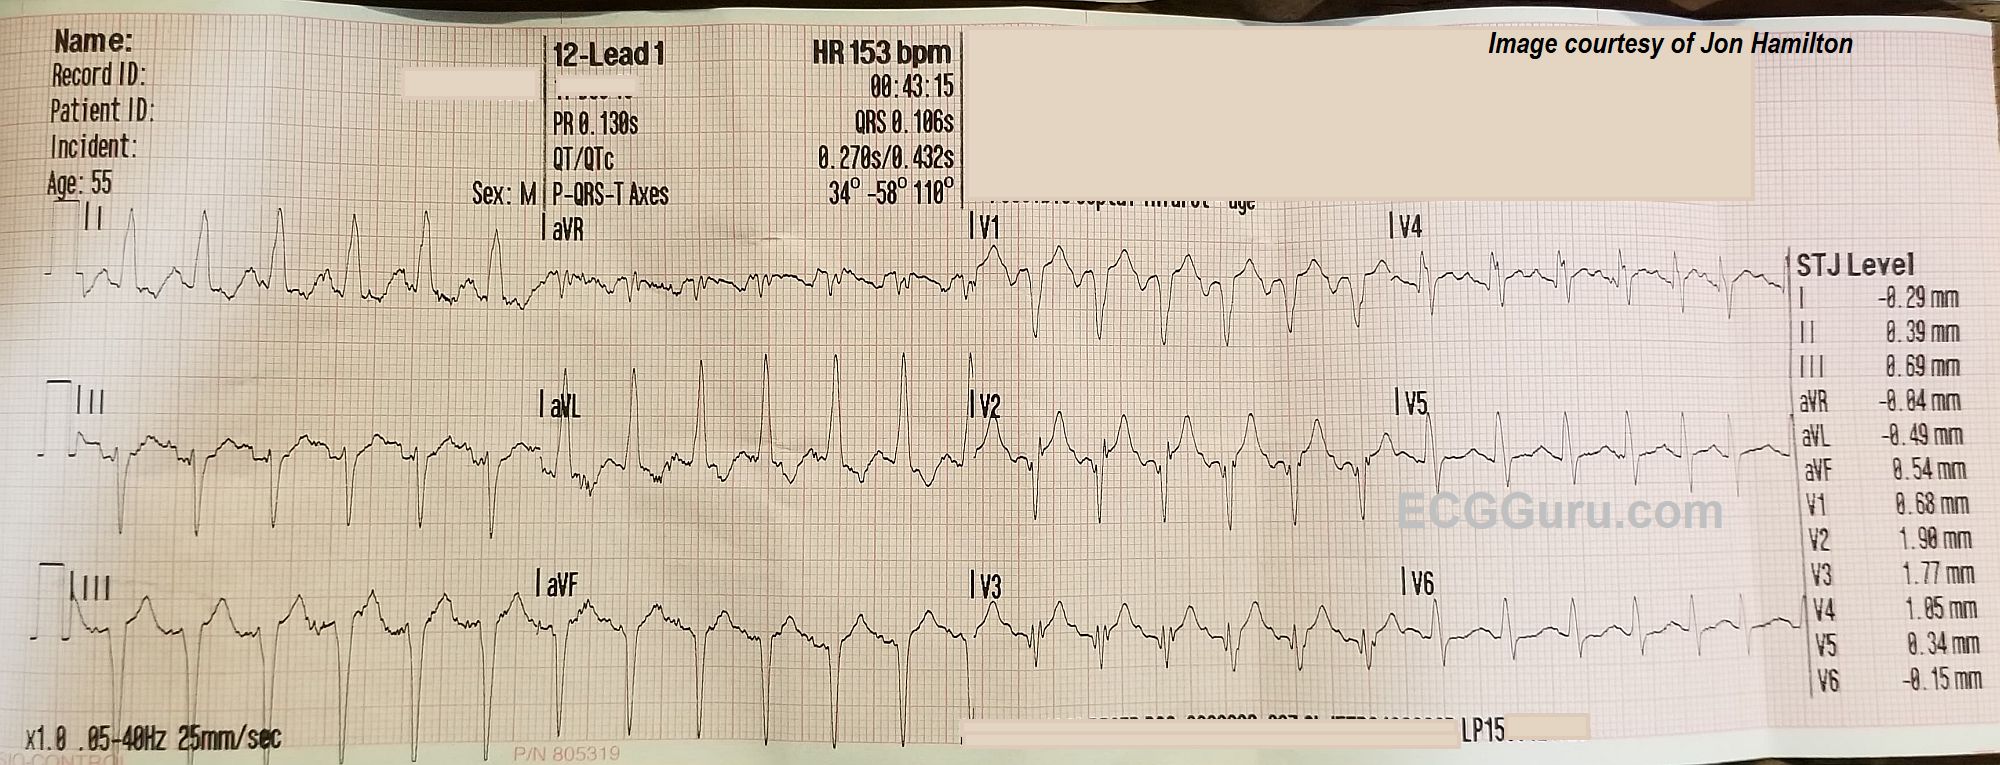
The ECG rhythm:  There is a fast, regular rhythm that is supraventricular in origin (there are P waves).  When a supraventricular rhythm has a rate of about 150 per minute, we should ALWAYS consider ATRIAL FLUTTER WITH 2:1 CONDUCTION.  Atrial flutter produces P waves (flutter waves) at approximately 250-350 per minute.  The normal AV node is able to conduct half of these, at a rate of about 150 per minute. Atrial flutter with 2:1 conduction is the most common presentation of new-onset atrial flutter.  It is often missed by people who expect to see several flutter waves in a row, producing the "sawtooth pattern".  That being said, atrial flutter is usually discernable in at least a few leads if it is present.  We do not see any signs of flutter waves in this ECG.

That leaves us with a differential diagnosis of sinus tachycardia vs. one of the regular supraventricular tachycardias like reentrant tachycardias or atrial tachycardia.  Sinus tachycardia can be recognized by several features. If we are fortunate enough to witness the onset or offset of the fast rhythm, will will recognize sinus tachycardia by a "warm up" or gradual speeding up of the rate, and a "cool down", or gradual slowing.  On the other hand, SVTs often have abrupt onset and offset.  Sinus tachycardia often has a very obvious cause, such as hypovolemia, fever, pain, anxiety, vigorous exercise, or hypoxia.  Sinus tachycardia usually has a distinct, upright P wave in Lead II, and a clearly-seen, often negative, P wave in Lead V1.  This ECG does not show the onset of the tachycardia, and is not long enough to evaluate for rate changes. Lead II appears to have upright P waves on the downslope of the previous T waves. V1 has deeply negative P waves, and V4 has the most clearly-seen P waves.  Without being positive, this looks more like sinus tachycardia than a reentrant tachycardia.  It would help to know more about the patient's condition.

Dawn's picture

Bifascicular Block

This ECG is from a 77 year old woman who was brought to the Emergency Department by EMS. She was found to be suffering from sepsis.

ECG Interpretation      The ECG shows the expected sinus tachycardia at 123 beats per minute.  There is significant baseline artifact, of the type usually seen with muscle tension.  The artifact makes it difficult to assess P waves and PR intervals.


What we do see is RIGHT BUNDLE BRANCH BLOCK and LEFT ANTERIOR HEMIBLOCK, also called LEFT ANTERIOR FASCICULAR BLOCK.  Together, these are called BIFASCICULAR BLOCK.  Most people have three main fascicles in the interventricular conduction system:  the right bundle branch and the two branches of the left bundle branch, the anterior-superior fascicle and the posterior-inferior fascicle.  In bifascicular block, two of the three are blocked.

The ECG criteria for right bundle branch block are:

     *     wide QRS (> .12 seconds)


     *     rSR’ pattern in V1 .  (the initial R wave may be hard to see, but the QRS will be predominantly upright.

Dawn's picture

Anterior Wall M.I. With Bifascicular Block

This ECG is taken from an 82-year-old man who called 911 because of chest pain.  He has an unspecified “cardiac” history, but we do not know the specifics. 

WHAT IS THE RHYTHM?  The heart rate is 69 bpm, and there are P waves before every QRS complex. The underlying rhythm is regular, with one premature beat that is wide without a P wave.  The PR interval is slightly prolonged at .25 seconds.  The rhythm is normal sinus rhythm with first-degree AV block and one PVC. 

WHY THE WIDE QRS?   The QRS complex is wide at .14 seconds. The QRS in V 1 has a wide R wave after a small Q wave.  This in consistent with right bundle branch block pattern, with loss of the normal initial small r wave (pathological Q waves).  The diagnosis of RBBB is further corroborated by the wide little S waves in Leads I and V6.  The QRS frontal plane axis is -66 degrees per the machine, and clearly “abnormal left” because the QRS in Lead II is negative, while the QRS in Leads I and aVL are positive.  This is left anterior fascicular block, also called left anterior hemiblock.  The combination of RBBB and LAFB is a common one, as the two branches have the same blood supply.  It is also called bi-fascicular block. 

WHAT ABOUT THE ST SEGMENTS?  The ST segments in leads V2 through V6 are elevated, and their shape is very straight, as opposed to the normal shape of coved upward (smile). Even though the amount of ST elevation at the J points appears subtle, the shape of the segments, the fact that they appear in related leads, and the fact that the patient is an elderly male with chest pain all point to the diagnosis of ANTERIOR WALL ST elevation M.I. (STEMI).  Additional ST changes include a straight shape in Leads I and aVL and ST depression in V1 and aVR.  

PATIENT OUTCOME  The patient was transported to a cardiac center, where he received angioplasty in the cath lab.  The left coronary artery was found to be occluded, and was repaired and stented.  He recovered without complications and was sent home in a few days.

Dawn's picture

Bifascicular Block and Sinus Bradycardia

Today’s ECG is from a 75 year old man who has been experiencing syncope. 

Examination of the ECG shows a sinus bradycardia at just under 40 bpm.  There is a first-degree AV block, with a PR interval of about .28 seconds (280 ms).  There is a right bundle branch block.  The ECG criteria for right bundle branch block are:  supraventricular rhythm, wide QRS (120 ms in this case), rSR’ pattern in V1, and  a small, wide S wave in Leads I and V6.  There is actually a “terminal delay”, or extra wave at the end of each QRS complex, reflecting late repolarization of the right ventricle. 

This ECG also shows a left anterior fascicular block, also called left anterior hemiblock.  The left bundle branch usually has two main branches, the anterior-superior and the posterior-inferior.  ECG criteria for left anterior fascicular block are: left axis deviation with a small r wave in Lead III and a small q waves with tall R waves in Leads I and aVL.  There is also a prolonged R wave peak time (> 45 ms) in aVL. There is usually a slightly prolonged QRS, but in this case, there is widening of the QRS due to the RBBB.   Because the right bundle branch is blocked, and one fascicle of the left bundle is blocked, the patient is said to have a “bifascicular block”.  Only one fascicle remains available for conduction from the atria to the ventricles.

We have no information about what caused the conduction block in these two fascicles, but should the third fascicle fail, the patient will be in a complete AV block.  An AV block at the level of the bundle branches will result in an idioventricular escape rhythm – wide QRS complexes with very slow rates – which is a low-output rhythm.  

This patient has also had syncope, which was determined to be related to his bradycardia.  He had an AV sequential pacemaker implanted and did well.

Dawn's picture

Teaching Series - Tachycardia and Left Anterior Fascicular Block

This series of three ECGs is from a 60-year-old man who was brought to the Emergency Department after being involved in a motor vehicle accident.  No injuries were found, but the patient was severely intoxicated by alcohol consumption.  He was conscious but agitated. 

ECG NO. 1     15:07:23

The first ECG was taken by fire-rescue personnel at the scene of the accident. His hemodynamic status was stable, and the rate was not addressed in the field. ECG No. 1 shows a supraventricular rhythm at 161 bpm, with a narrow QRS and P waves visible before each QRS. 

A notable feature of this ECG are the left axis deviation, by default diagnosed at left anterior hemiblock (left anterior fascicular block).  The .10 second QRS width is typical of LAHB, as is the rS pattern in Lead III.

Also  noted is the unusual R wave progression in the precordial leads.  The R waves are prominent in V2, and then fail to progress across the precordium, and the S waves persist. This is probably due to the hemiblock.  We do not know this patient’s medical history, except that he self-described as an “alcoholic”.  LAFB can be associated with coronary artery disease. 

ECG NO. 2      15:20:38

Now being evaluated in the Emergency Dept., we see the patient's heart rate is 163 bpm.  Some variability in the rate was noted with patient agitation and activity, so it was determined that the rhythm was probably sinus tachycardia.  There were no other significant changes in the ECG from the first one.  Unfortunately, we no longer have access to lab results, so we do not know his electrolyte or hydration status.  Labs confirmed ETOH intoxication. 

ECG NO. 3   15:43:26

Pages

All our content is FREE & COPYRIGHT FREE for non-commercial use

Please be courteous and leave any watermark or author attribution on content you reproduce.