Displaying 1 - 10 of 14
Dawn's picture

Acute Anterior-lateral STEMI

The Patient:  A 60-year-old man at work. He experienced a sudden onset of substernal chest pain, nausea & vomiting, and dizziness.  He states the pain is a 5 on 1-10 scale.  No cardiac history or current medications. 

The ECGs:  The first ECG, taken at 12:30:05, shows a sinus rhythm with ventricular bigeminy. In some leads, you can see the sinus P waves hidden in the beginnings of the PVCs, so we know the underlying sinus rhythm is about 82 bpm.

There is obvious ST elevation in V1 through V5, which is the anterior wall, an area perfused by the left anterior descending artery.  Remember – the ST elevation sign may also show in the PVCs, but because ventricular beats have secondary ST changes of their own, we should assess only the sinus beats for ST changes. 

There is also obvious ST elevation in Leads I and aVL.  This is the high lateral wall, which is perfused by the circumflex and first diagonal arteries, both proximal branches of the left coronary artery.  So, the involvement of the high lateral wall indicates a proximal lesion in the LCA – not good.  Leads III and aVF have distinct ST depression – this is a reciprocal change reflecting the ST elevation in Leads I and aVL.

Dawn's picture

Acute Anterior M.I. and Ventricular Fibrillation

The Patient:   This series of ECGs is from a 65-year-old woman who was complaining of a sudden onset of chest pain, nausea, and weakness. She stated that the pain increased on inspiration.  She reported a history of non-insulin-dependent diabetes mellitus (NIDDM). 

ECG No. 1, 14:46:  This ECG includes V4Right, V8 and V9 in place of V4, V5, and V6.  The rhythm is sinus at 91 beats per minute.  The PR interval is within normal limits, as is the QRS duration.  The QTc is WNL as well.  The frontal plane axis is also WNL.  The three standard chest leads show an early transition of R waves in V2.   There are noticeable ST and T wave abnormalities:

slight ST elevation in I and aVL with ST depression in II, III, and aVF.  In chest pain, possible M.I., STD should be presumed to be reciprocal in nature.  V1 has slight STE with a coved upward (frowning) appearance.  V2 has more noticeable STE, with a tall, wide-based T wave. This is called a “hyperacute T wave”.  We will have to evaluate V4 – V6 on ECG No. 2. 

V4 Right has no ST elevation, and V8 and V9 have ST depression (reciprocal to the anterior leads).  So far, we have all the signs of acute anterior wall M.I. 

Dawn's picture

Widespread ST Elevation With Right Bundle Branch Block

Usually, instructors of basic ECG classes look for examples of the most common conditions that are likely to be encountered by the learners.  But, sometimes, it is advantageous to show students more unusual presentations to remind them of the infinite possibilities when we care for living beings.  This series is a very good example of what can and does happen to some people with cardiovascular disease.  It will give your students an opportunity to think about possible interpretations, and also about anticipating clinical implications and emergencies that may arise.

The Patient:  This patient is a man in his 80s who has been active his whole life.  He considers himself to be healthy, giving no medical history and denying medication use. He states that he has had a yearly health exam.  Today, he felt “tired and dizzy” while raking leaves.  As he walked to his house to rest, he had a syncopal episode and fell, hitting his head. He was unconscious for a few minutes. A family member called for Emergency Medical Services (EMS). Paramedics found him awake and complaining of bilateral “shoulder and wrist” pain. He had no obvious trauma to his extremities, but had some bruising on his head and face.  He denied recent illness and substance abuse.  He was oriented x3. He was pale and diaphoretic, and complained of nausea. He denied chest or back pain.  He denied shortness of breath.  BP 100/60.  Heart rate bradycardic.  SPO2 above 95%.  He was given aspirin and ondasetron, and transported to a hospital.

Dawn's picture

Large Anterior Wall M.I. and Effect of Lead Reversal

EDIT: Please refer to the comments below this text. The second ECG in this series shows unexpected QRS and ST-T morphology changes, which I tried to explain by way of the patient's long anterior descending coronary artery. However, Dave Richley, who is a very well-known cardiac physiologist and ECG Guru took the time to analyze these morphologies and realize they can be explained by an inadvertent ECG LEAD MISPLACEMENT. This patient does have a proximal lesion of the LAD, proven and repaired in the cath lab. But the inferior wall does not have the injury it appears to have in this second ECG. Thanks to Dave for reminding us to slow down and look closely when things don't look "right".

The Patient:   These two ECGs, taken 26 minutes apart, were obtained from a 50-year-old man who complained of sudden onset of chest pain.  He denied history of coronary artery disease. He was Covid-positive, and the rest of his medical history was unremarkable.

ECG No. 1:  This ECG was obtained by paramedics enroute to the hospital.  For your beginner-level students, it will be easy to demonstrate the large ST elevations in V3 through V6. The machine’s measurements at the bottom confirm that this ECG meets any field criteria for ST elevation M.I. “STEMI”.

But there is so much more to see! Taking a methodical approach, and starting with rate and rhythm, we see sinus bradycardia at 57 bpm. Intervals and frontal plane axis are within normal limits. R wave progression in the chest leads is stalled in V1- V3 due to loss of initial r waves (narrow QS). The transition to positive deflections in V4 – V6 is abrupt.  These q waves in the V1 and V2 appear narrow, but V3 appears to have a Q wave that is almost wide enough to be considered pathological.  Narrow Q waves may be a transient sign of injury, while wide ones (>40 ms) are an ECG sign of necrosis.

Dawn's picture

Onset of Pathological Q Waves

 The Patient:     44-year-old man with chest pain.  Symptoms started over 24 hours ago. The EMS crew recognized an acute M.I. on the ECG and transferred him immediately to a cardiac hospital. They started two I.V.s and gave aspirin enroute. 


ECG No. 1 @17:43:    The rhythm is sinus tachycardia at 118 bpm.  The PR interval is within normal limits at 130 ms, and the QRS is narrow at 84 ms.  The QTCc is 478 ms by the machine’s measurement, but we measured the QT at 303 ms and QTc as 376-419 ms via various methods, which are within normal limits. The QRS frontal plane axis is at 15 degrees, within normal limits.

The ST segments are elevated and mostly straight in Leads V1 through V5, I and aVL. There is mild ST depression in III and aVF.  Very concerning are the pathological Q waves in V1 through V5, indicating loss (death) of myocardial tissue in the anterior wall. 

ECG No. 2 @ 17:53:  The second ECG was performed about 10 minutes later, and V4, V5, and V6 were replaced by V7, V8, and V9.  Reciprocal ST depression is observed in those additional leads. The heart rate is now 128 bpm.  It is notable that pathological Q waves have now appeared in Leads I and aVL. There has been no change in lead placement.  The onset of necrosis in the high lateral wall has shifted the frontal plane axis toward the right extreme of normal, at 86 degrees, and now II, III, and aVF have prominent R waves. Another cause for right axis shift in anterior wall M.I. to consider would be posterior hemiblock. However, that is a diagnosis of exclusion, and the new Q waves explain the axis shift.  It is interesting that the onset of pathological Q waves was captured in these serial ECGs.

Dawn's picture

Previous Anterior Wall M.I.


If you are an instructor, or a fairly new student, you don’t always need to see “challenging” ECGs. But, you may not want to see “standard” ECGs from an arrhythmia generator, either.  Every ECG contains subtle and not, so subtle characteristics of the person it belongs to.  Take a minute to look at this ECG before reading the discussion, and ask yourself what you might surmise about the patient.

The Patient: We don’t know much about the actual patient this ECG came from.  What we do know is that he is an elderly man with a history of heart disease who was hospitalized sometime in the past with an acute M.I.  He is now on beta blocker medication and is on a diet, as he is approaching the “morbidly obese” classification.  He is now in the ER with shortness of breath and mild chest pain.  What does his ECG tell us?

Dawn's picture

Anterior Wall M.I. With Ventricular Bigeminy

The Patient     This ECG was obtained from a 51-year-old man who presented to EMS with acute chest pain. He had a history of hypertension, 40 pack-year smoker.

Hospital Course     He was diagnosed with anterior wall STEMI and taken to the cath lab.  He was rated Killips Class 1 (no evidence of congestive heart failure), TIMI risk score 4  (14% risk of all-cause 30-day mortality).  He underwent primary percutaneous coronary intervention (PCI) of the proximal left anterior descending coronary artery (LAD).

Ten days post PCI, the patient had ventricular arrhythmias and went into cardiac arrest, but was resuscitated. He continued to have occurrences of non-sustained ventricular tachycardia (VT), progressing to sustained VT.  Electrolytes were monitored and corrected when necessary. The patient expired before any further diagnosis was made.

ECG Interpretation    The rhythm is sinus at a rate of about 80 bpm (first two beats).  The PR interval is about .18 seconds.  The QRS duration is about .10 seconds.  After the second sinus beat, ventricular bigeminy occurs. Every other sinus beat is obscured by the PVCs.  By the end of the strip, the underlying sinus rhythm has slowed slightly.

The ECG signs that the ectopic beats are ventricular are:  lack of P waves associated with the premature beats, QRS width about .16 seconds, and compensatory pauses.  The axis of the sinus beats is around 60 degrees (normal), but the axis of the premature beats is difficult to determine due to the low voltage and biphasic QRS complexes in the frontal plane leads.  It is also difficult to determine ST and T wave changes in the PVCs for the same reason.

Dawn's picture

Acute M.I. With Right Bundle Branch Block and Atrial Pacing

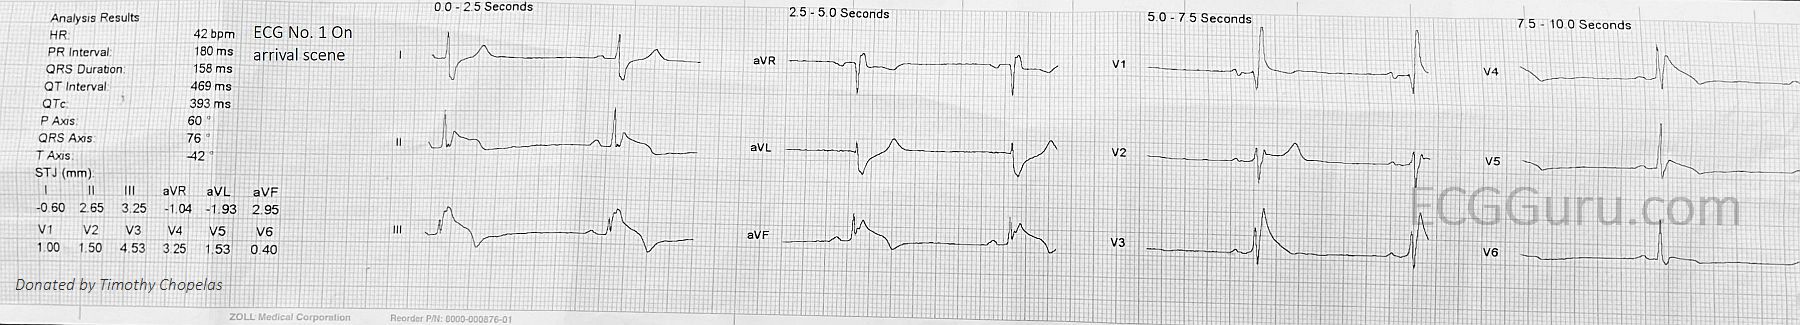
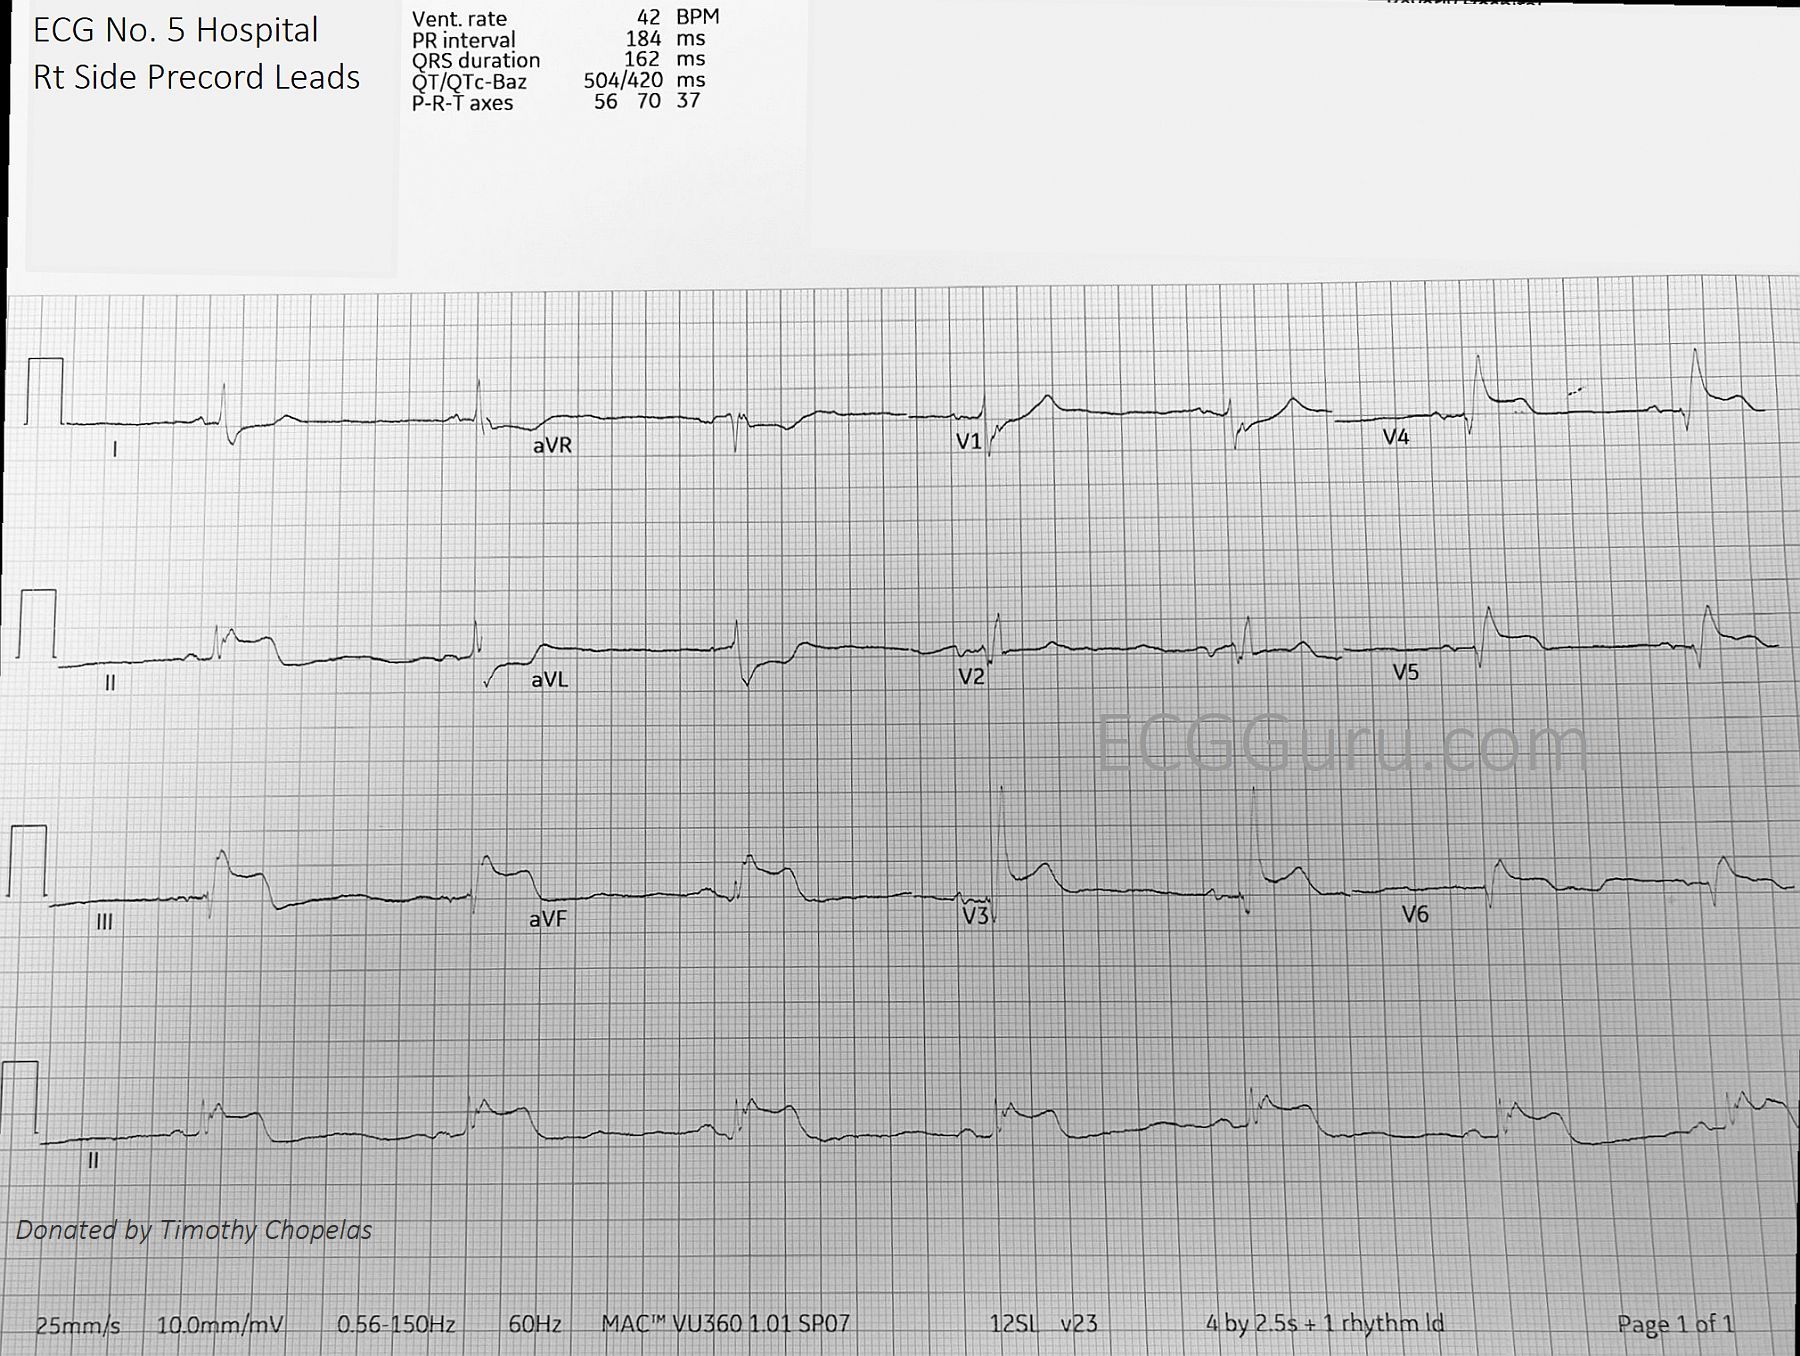
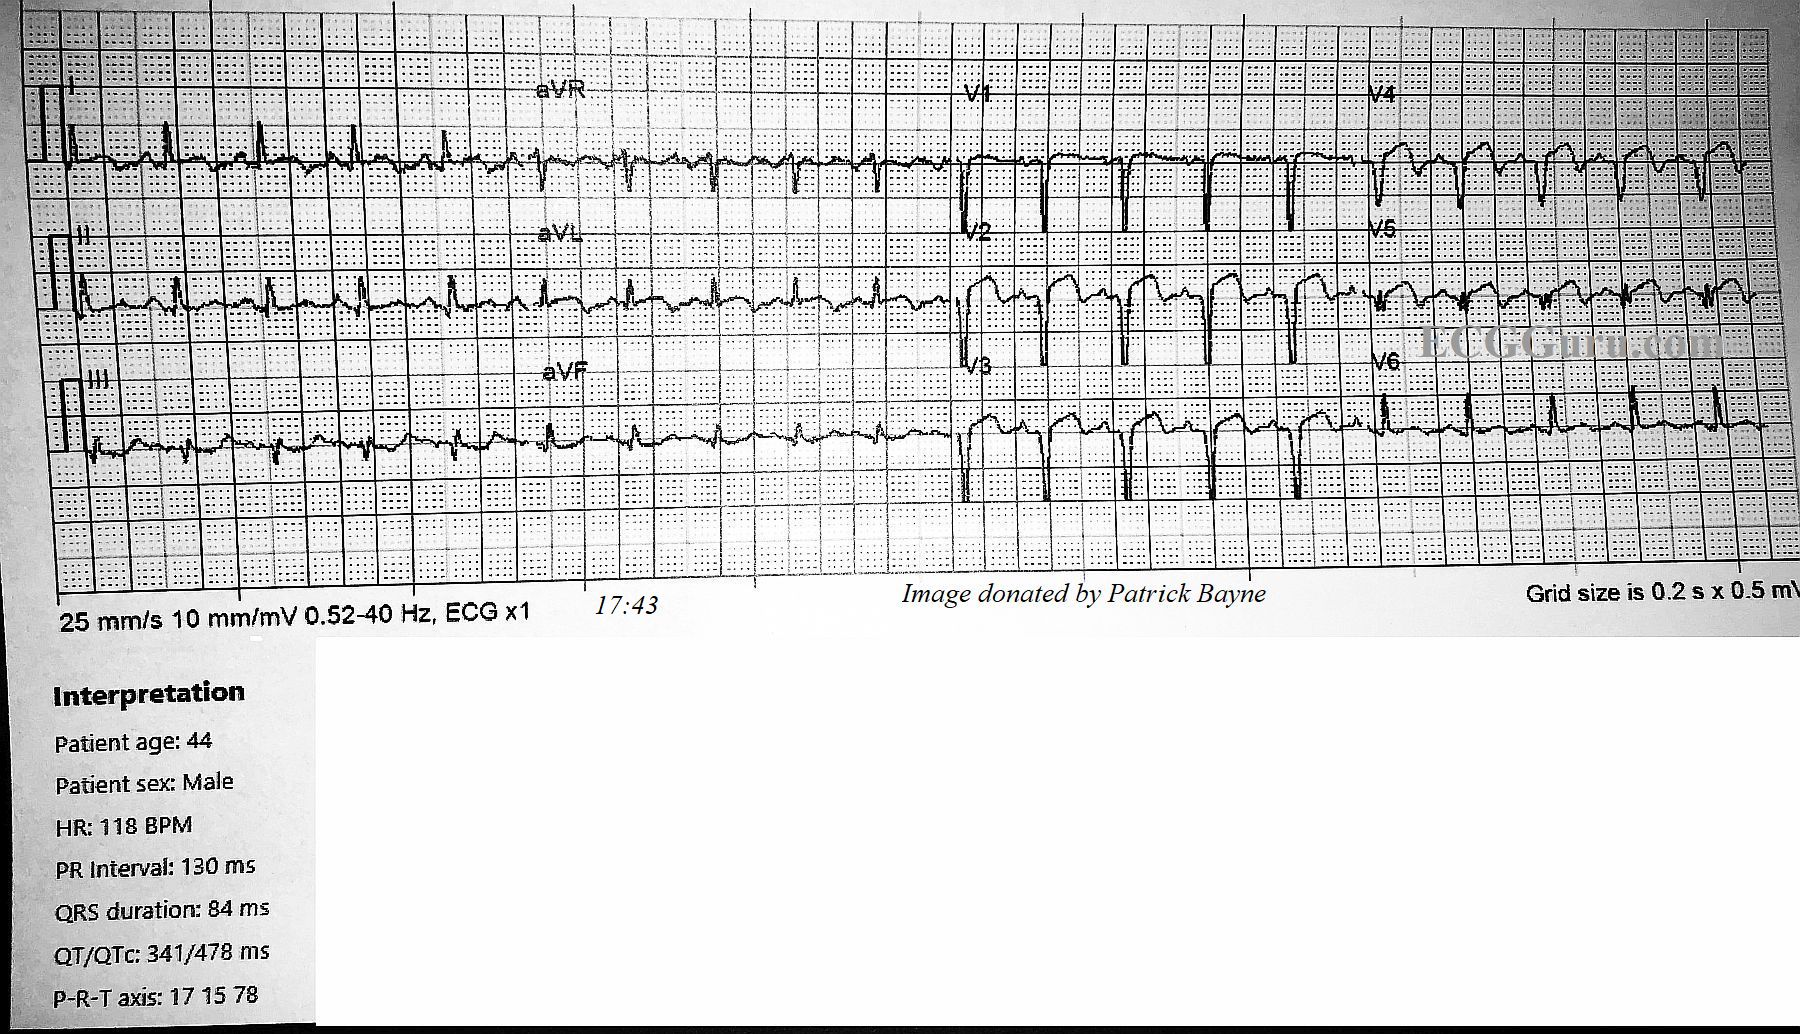
This ECG was taken from a 78-year-old man who was experiencing chest pressure in the morning, after having left shoulder pain since the night before. He has a history of hypertension and hypercholesterolemia, and has an implanted pacemaker.

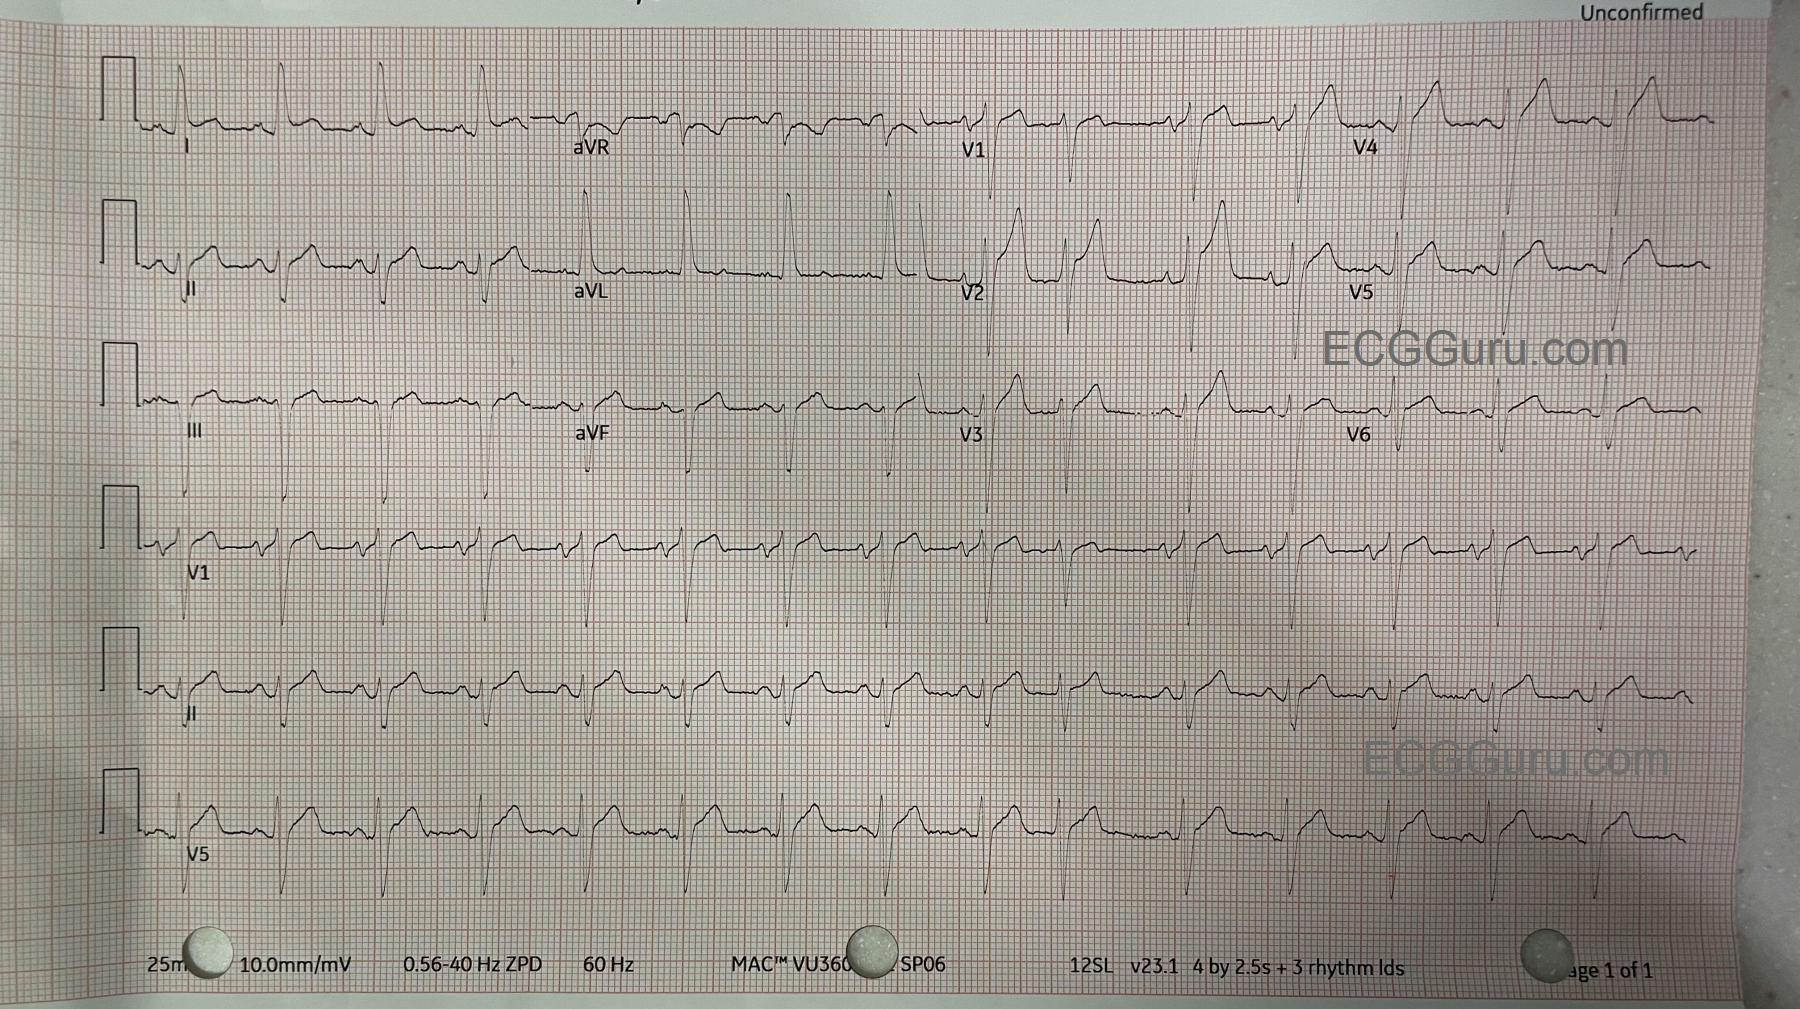
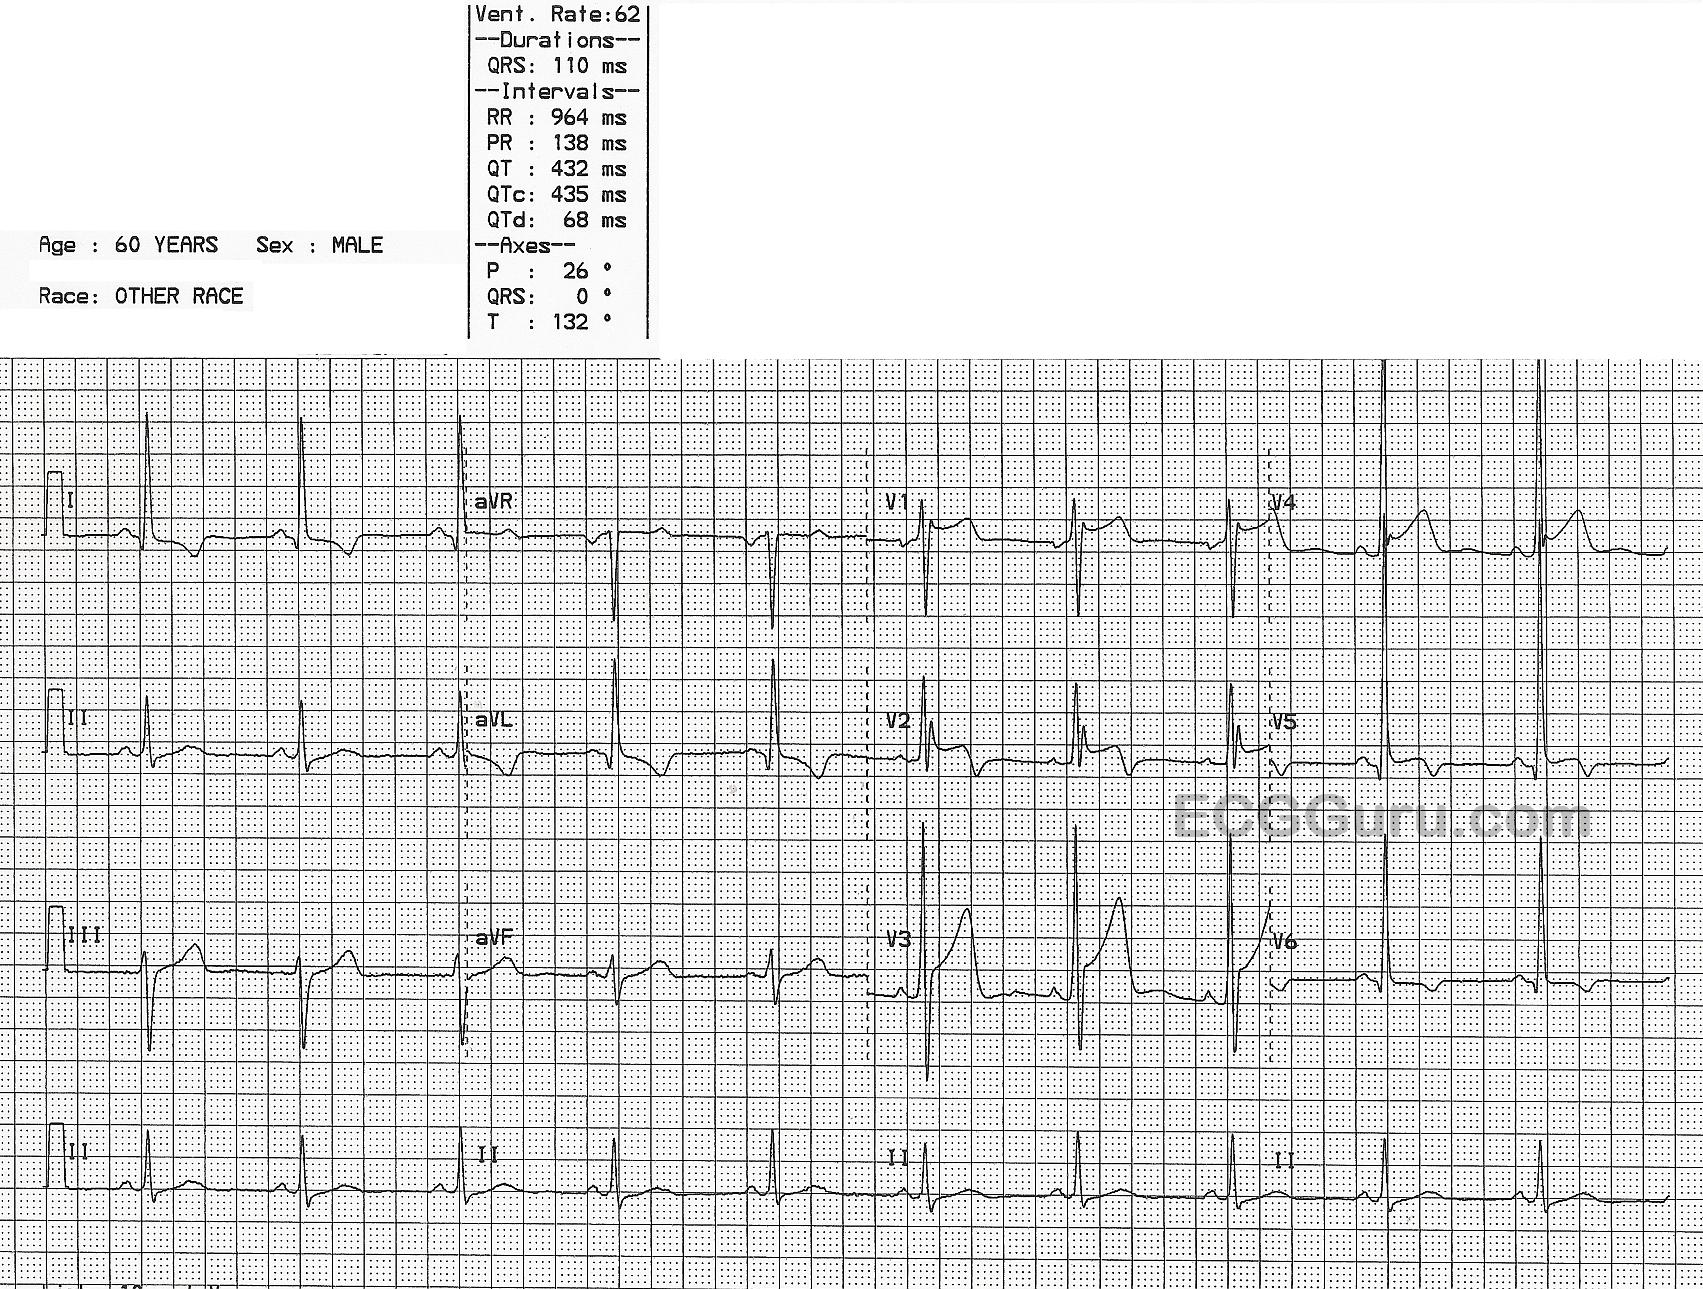
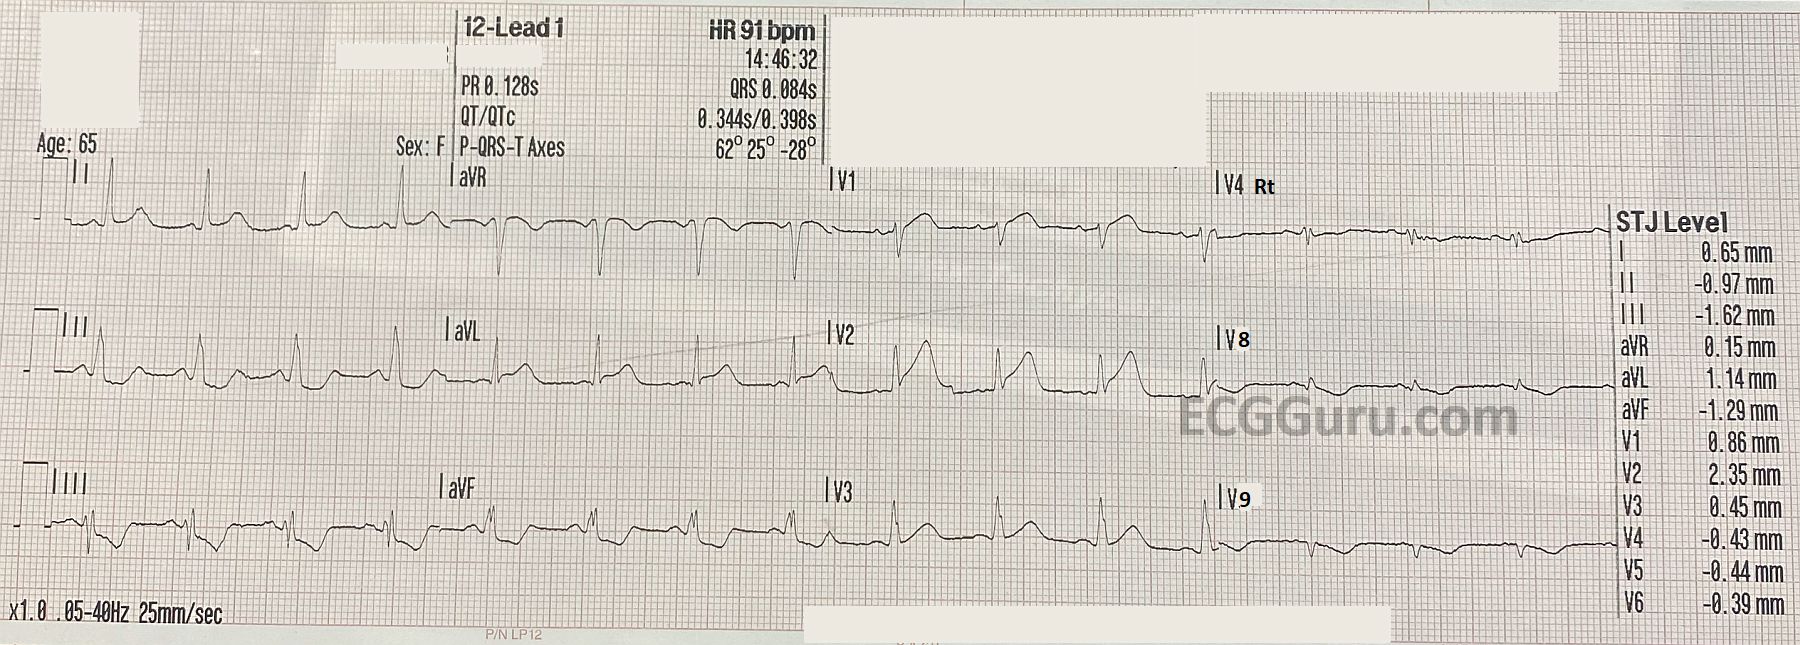
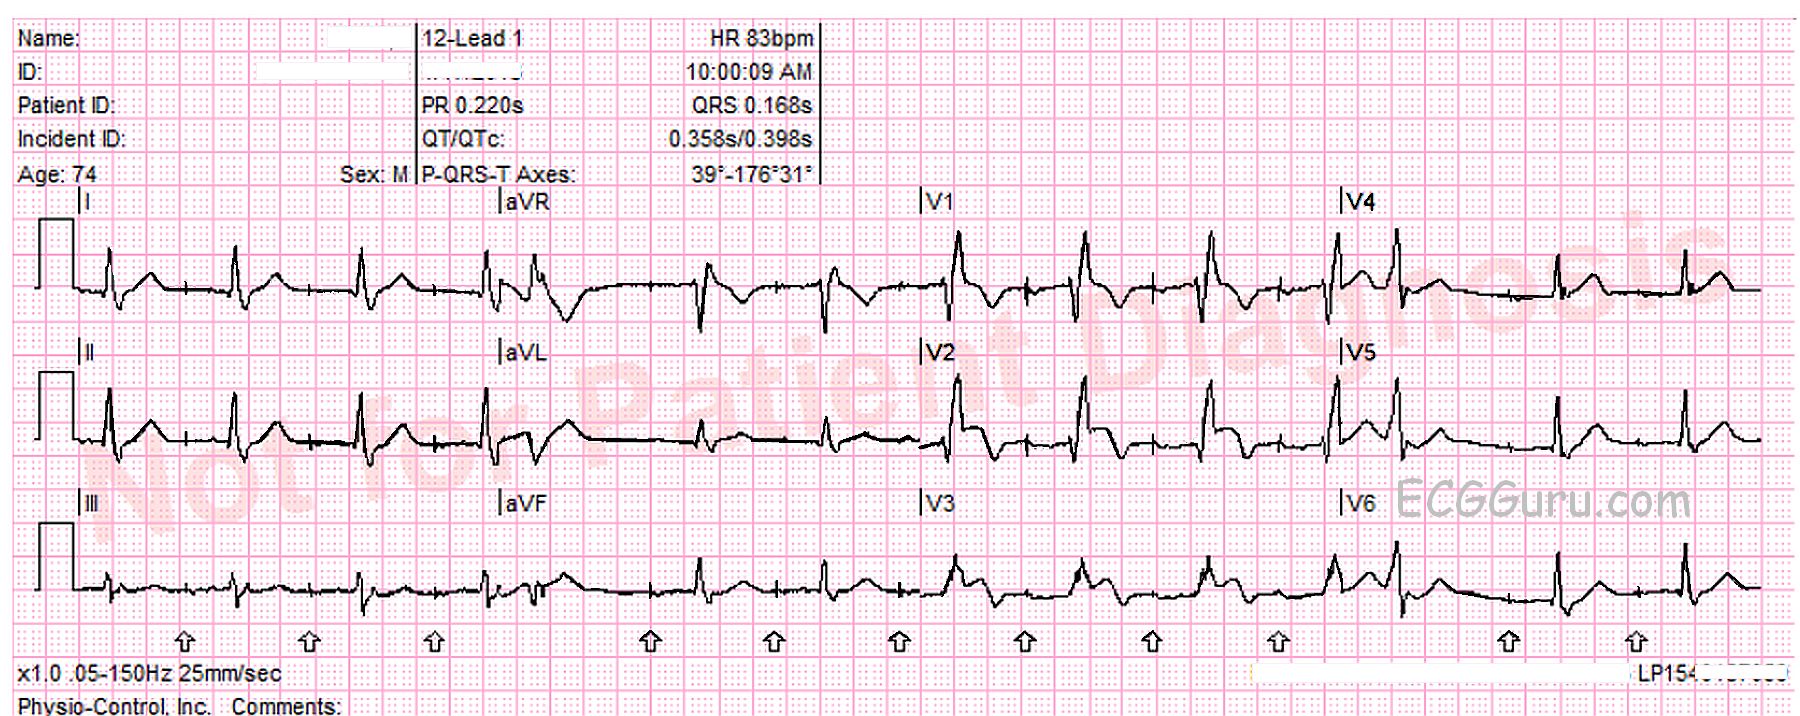
What does the ECG show?  The ECG shows an atrial paced rhythm, with two premature beats, beats number 5 and 12.  These are probably PVCs.  The patient has a functioning AV conduction system, so the paced atrial beats are conducting through the AV node and producing QRS complexes.  In the interventricular conduction system, the impulse encounters right bundle branch block. This causes each QRS to have an “extra” wave attached at the end, representing slightly delayed depolarization of the right ventricle.  Instead of an “rS” pattern in V1, for example, we see “rSR’ “.  The slight delay causes the QRS to be widened, as we are measuring the two ventricles separately, rather than synchronously.

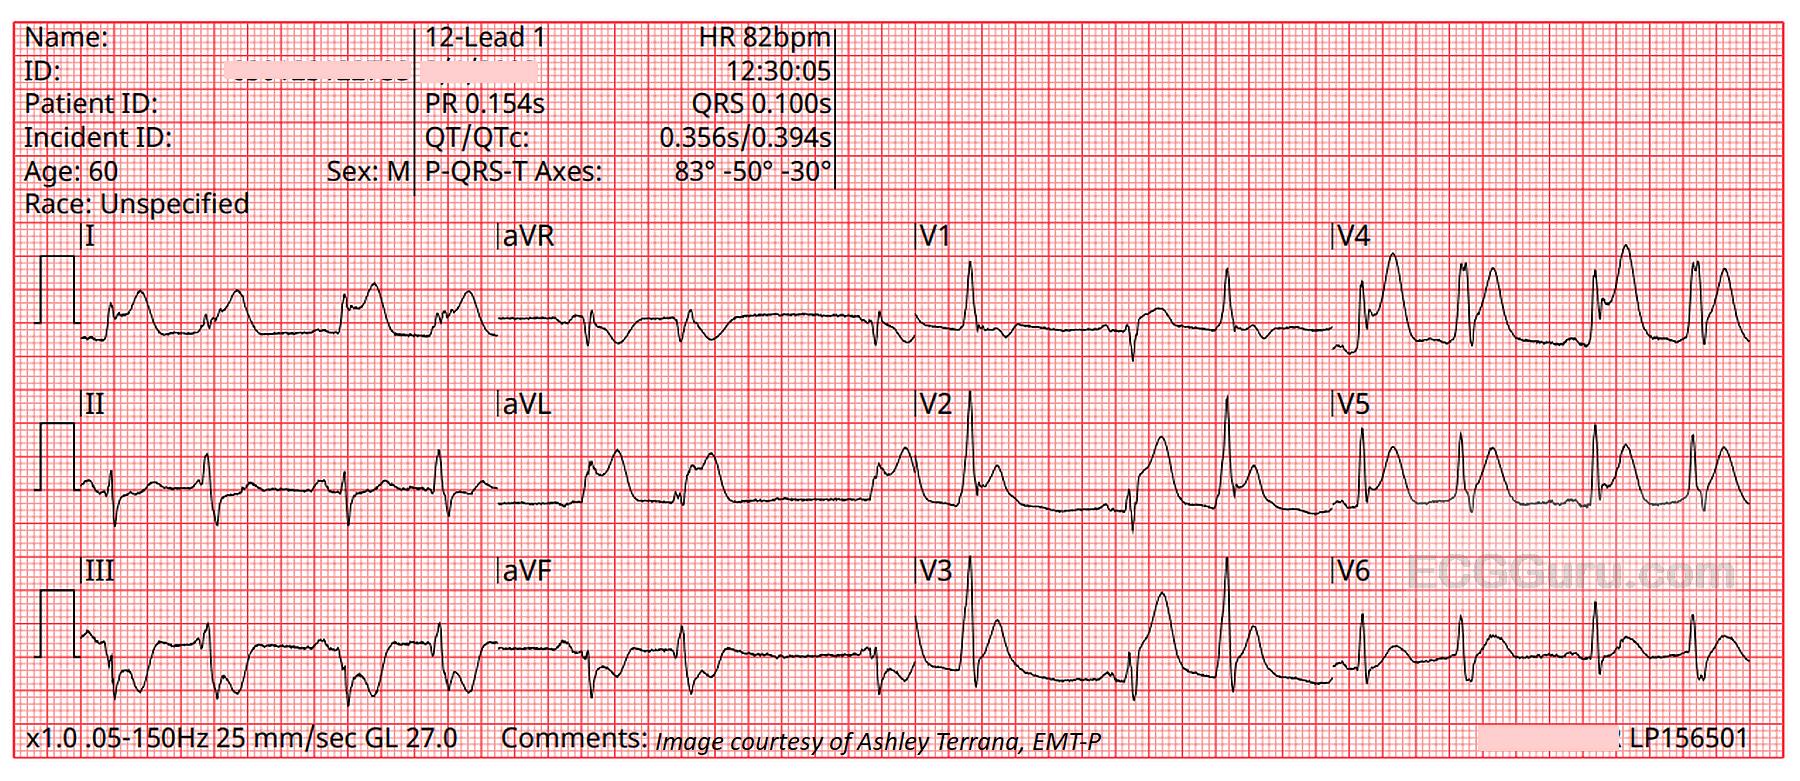
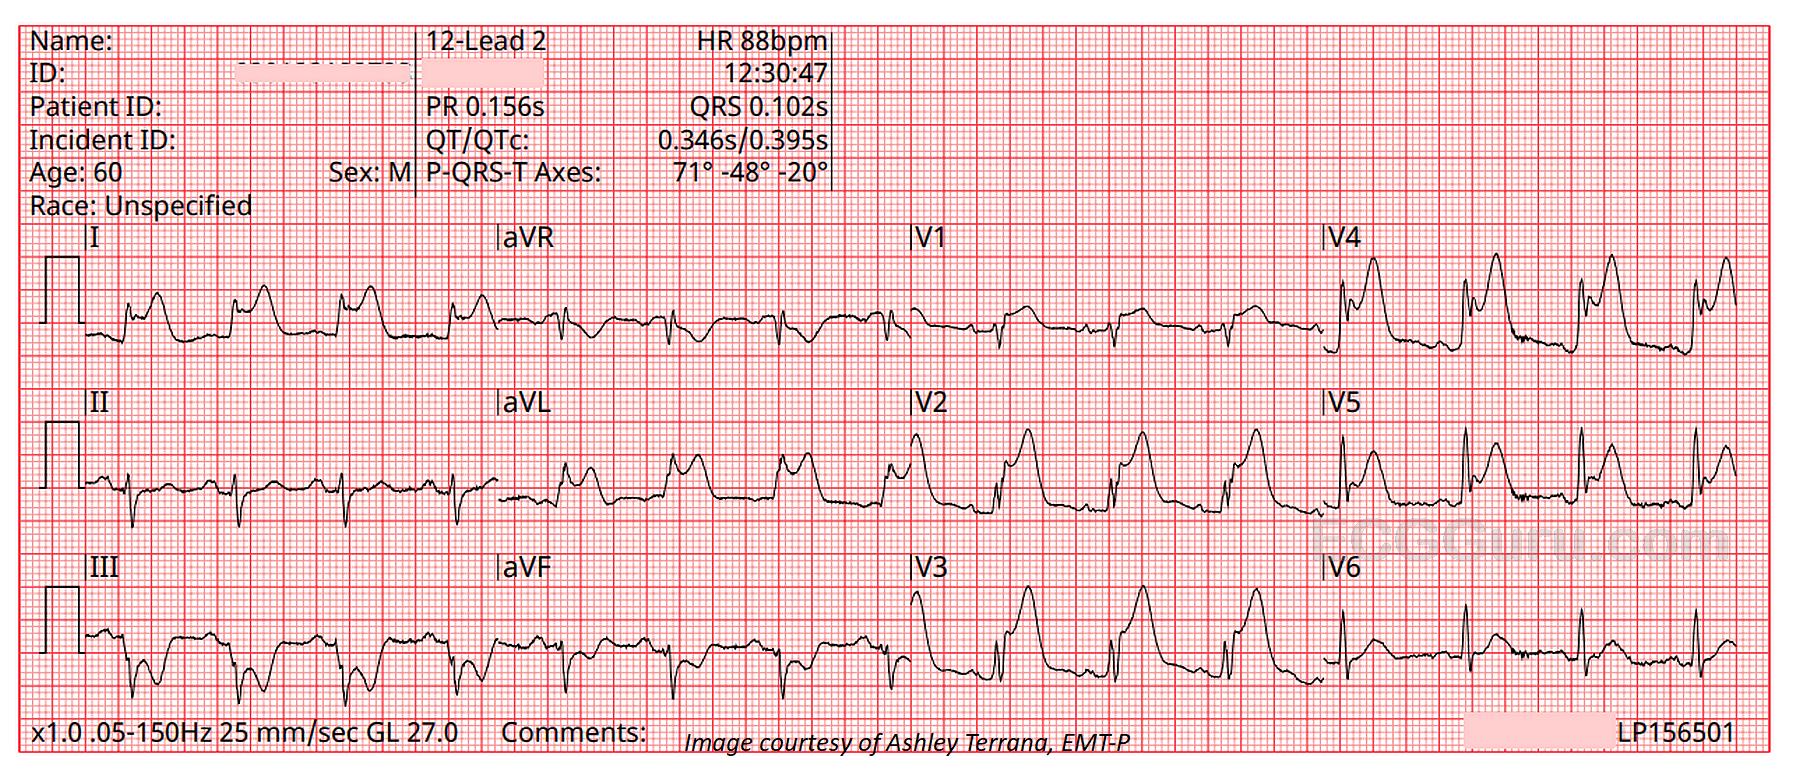
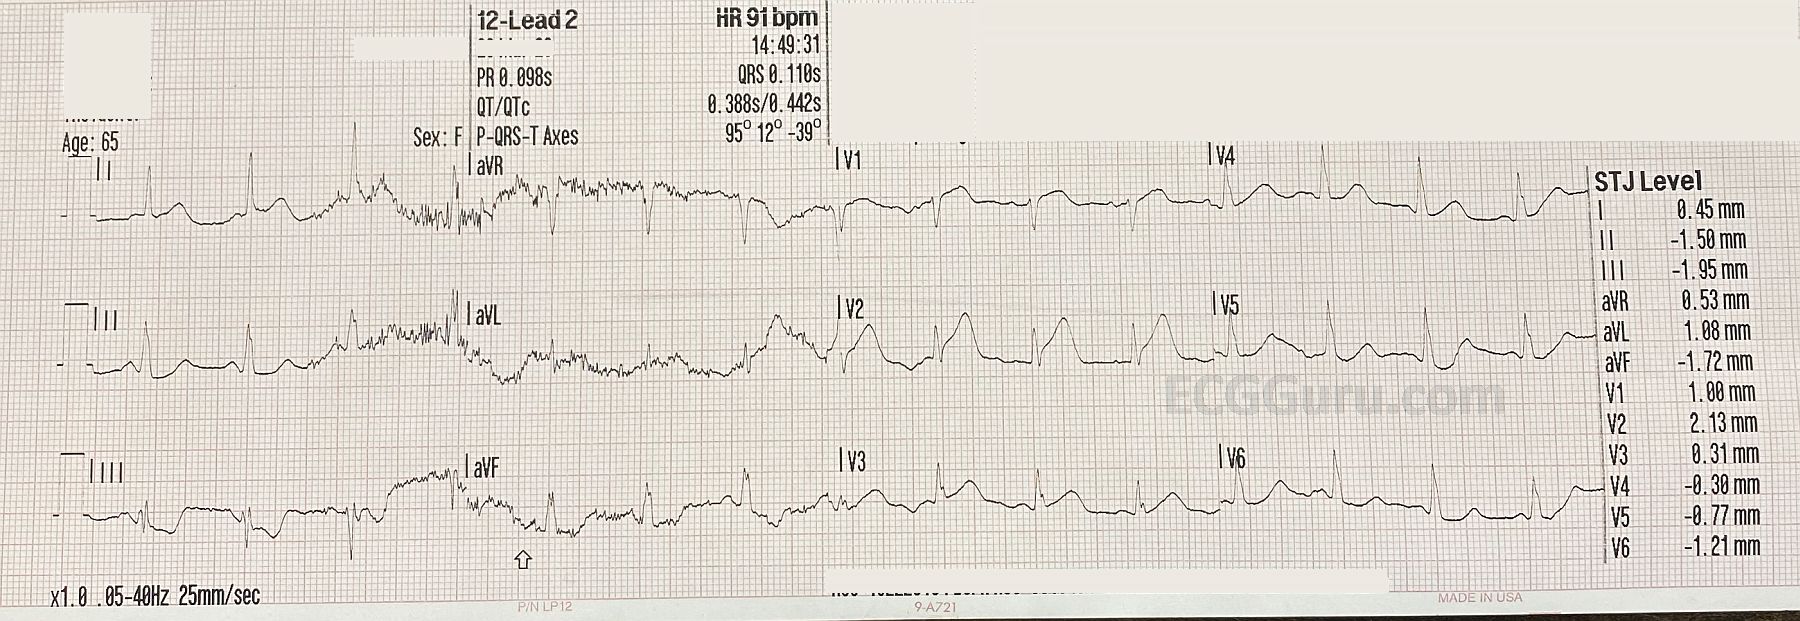
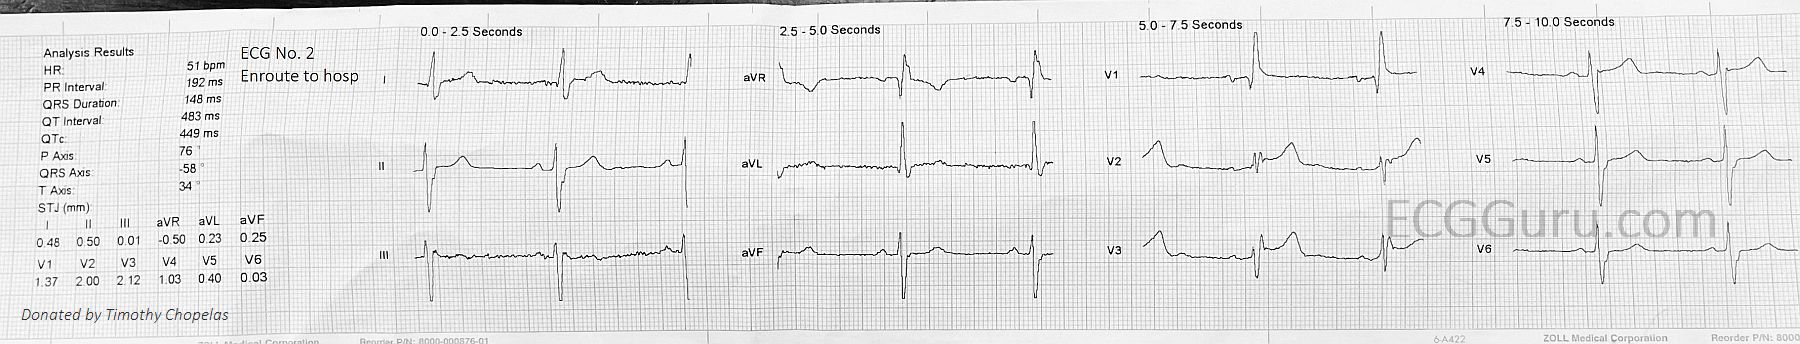
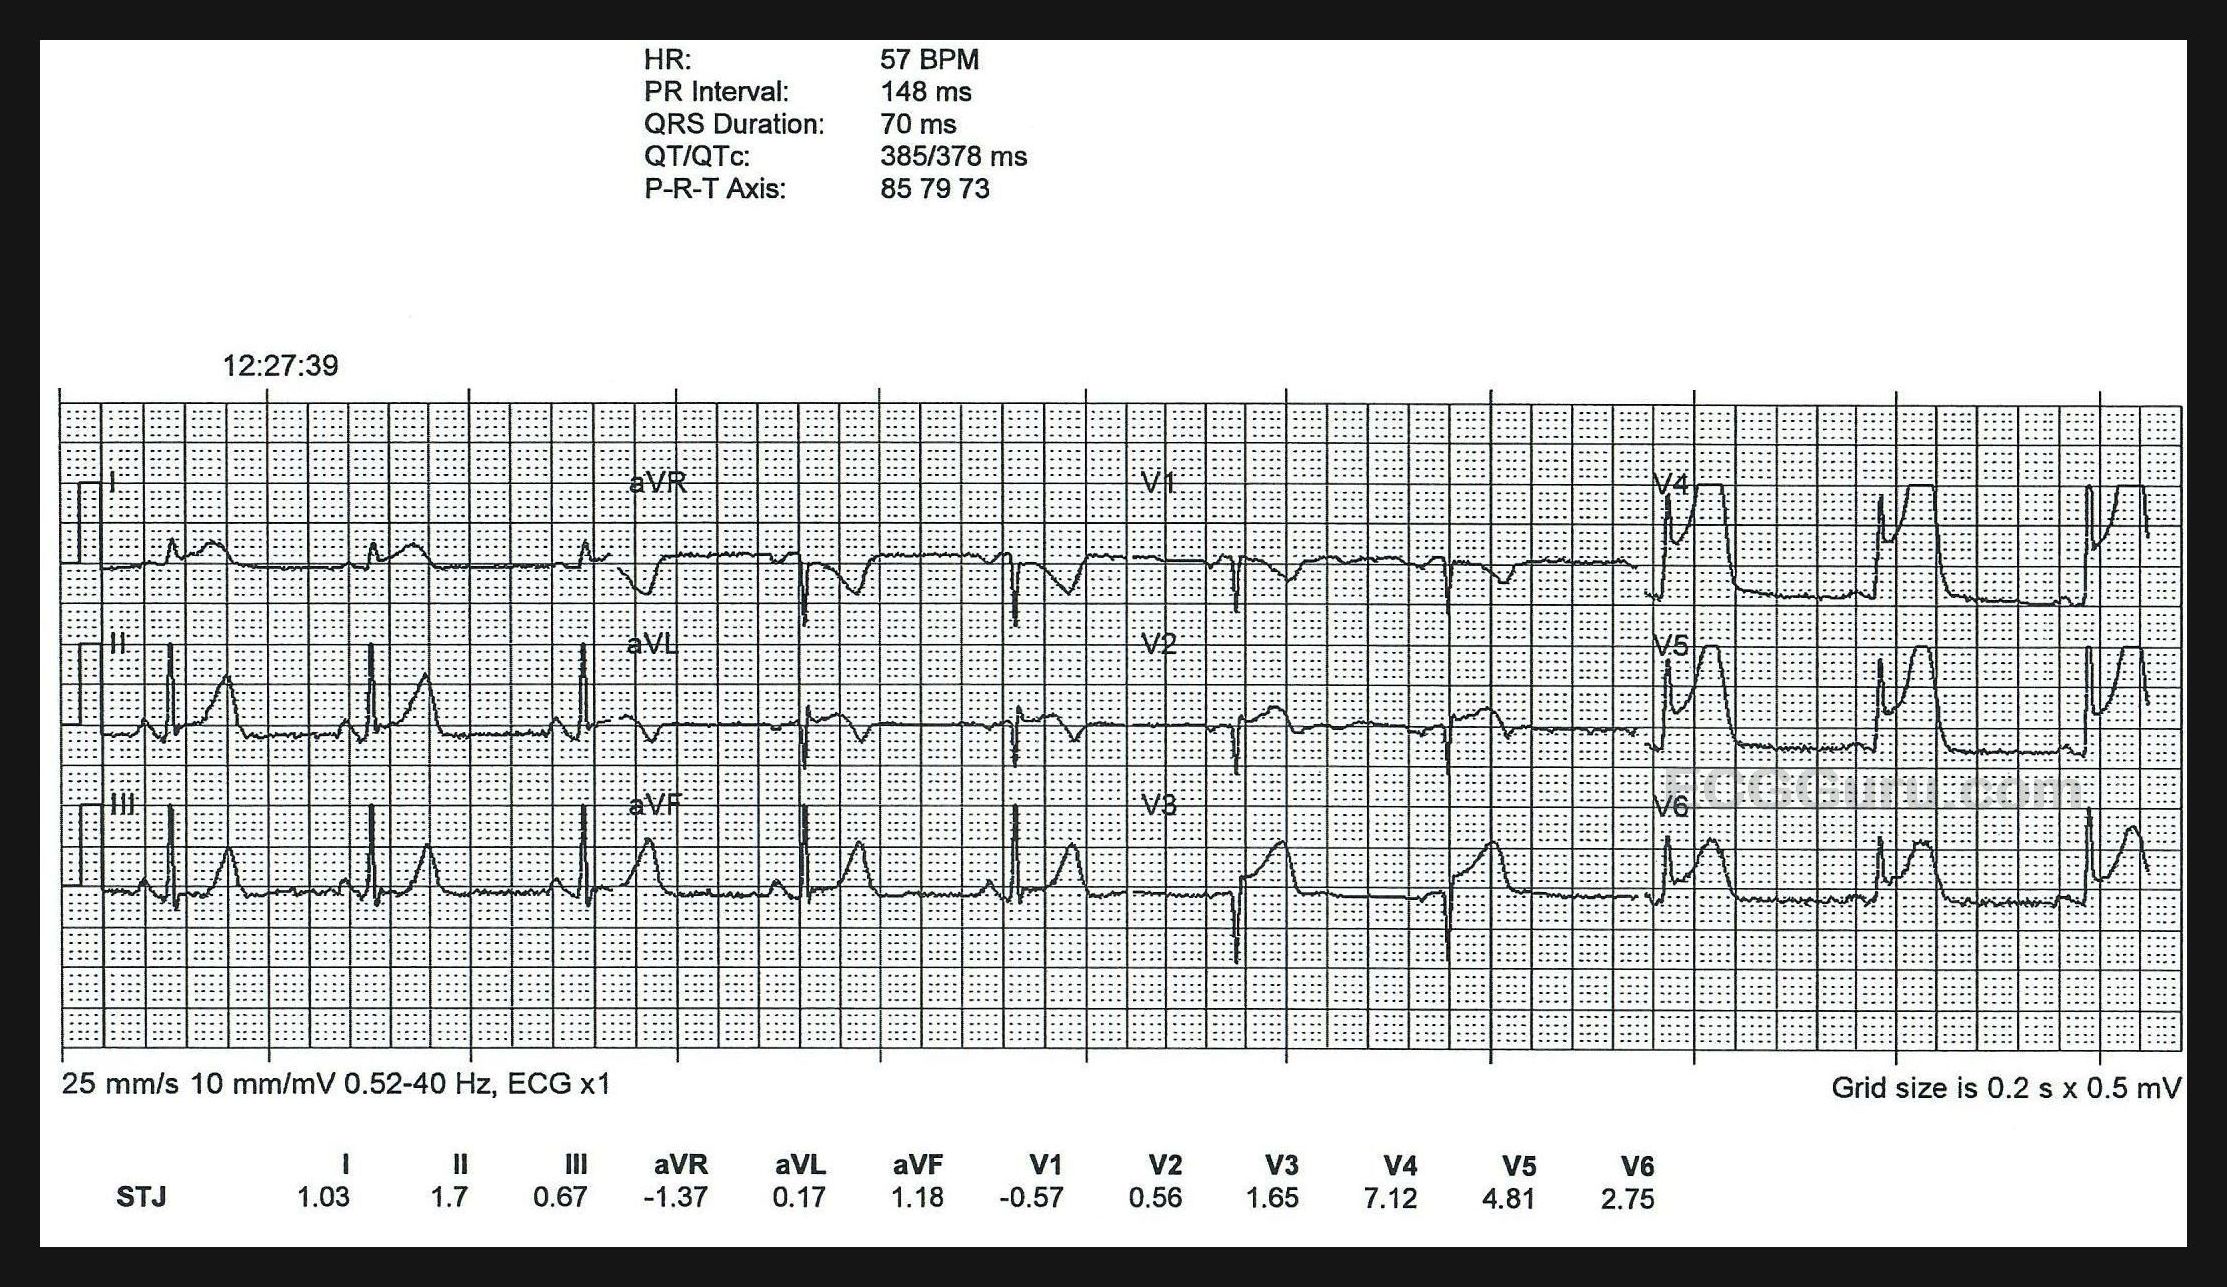
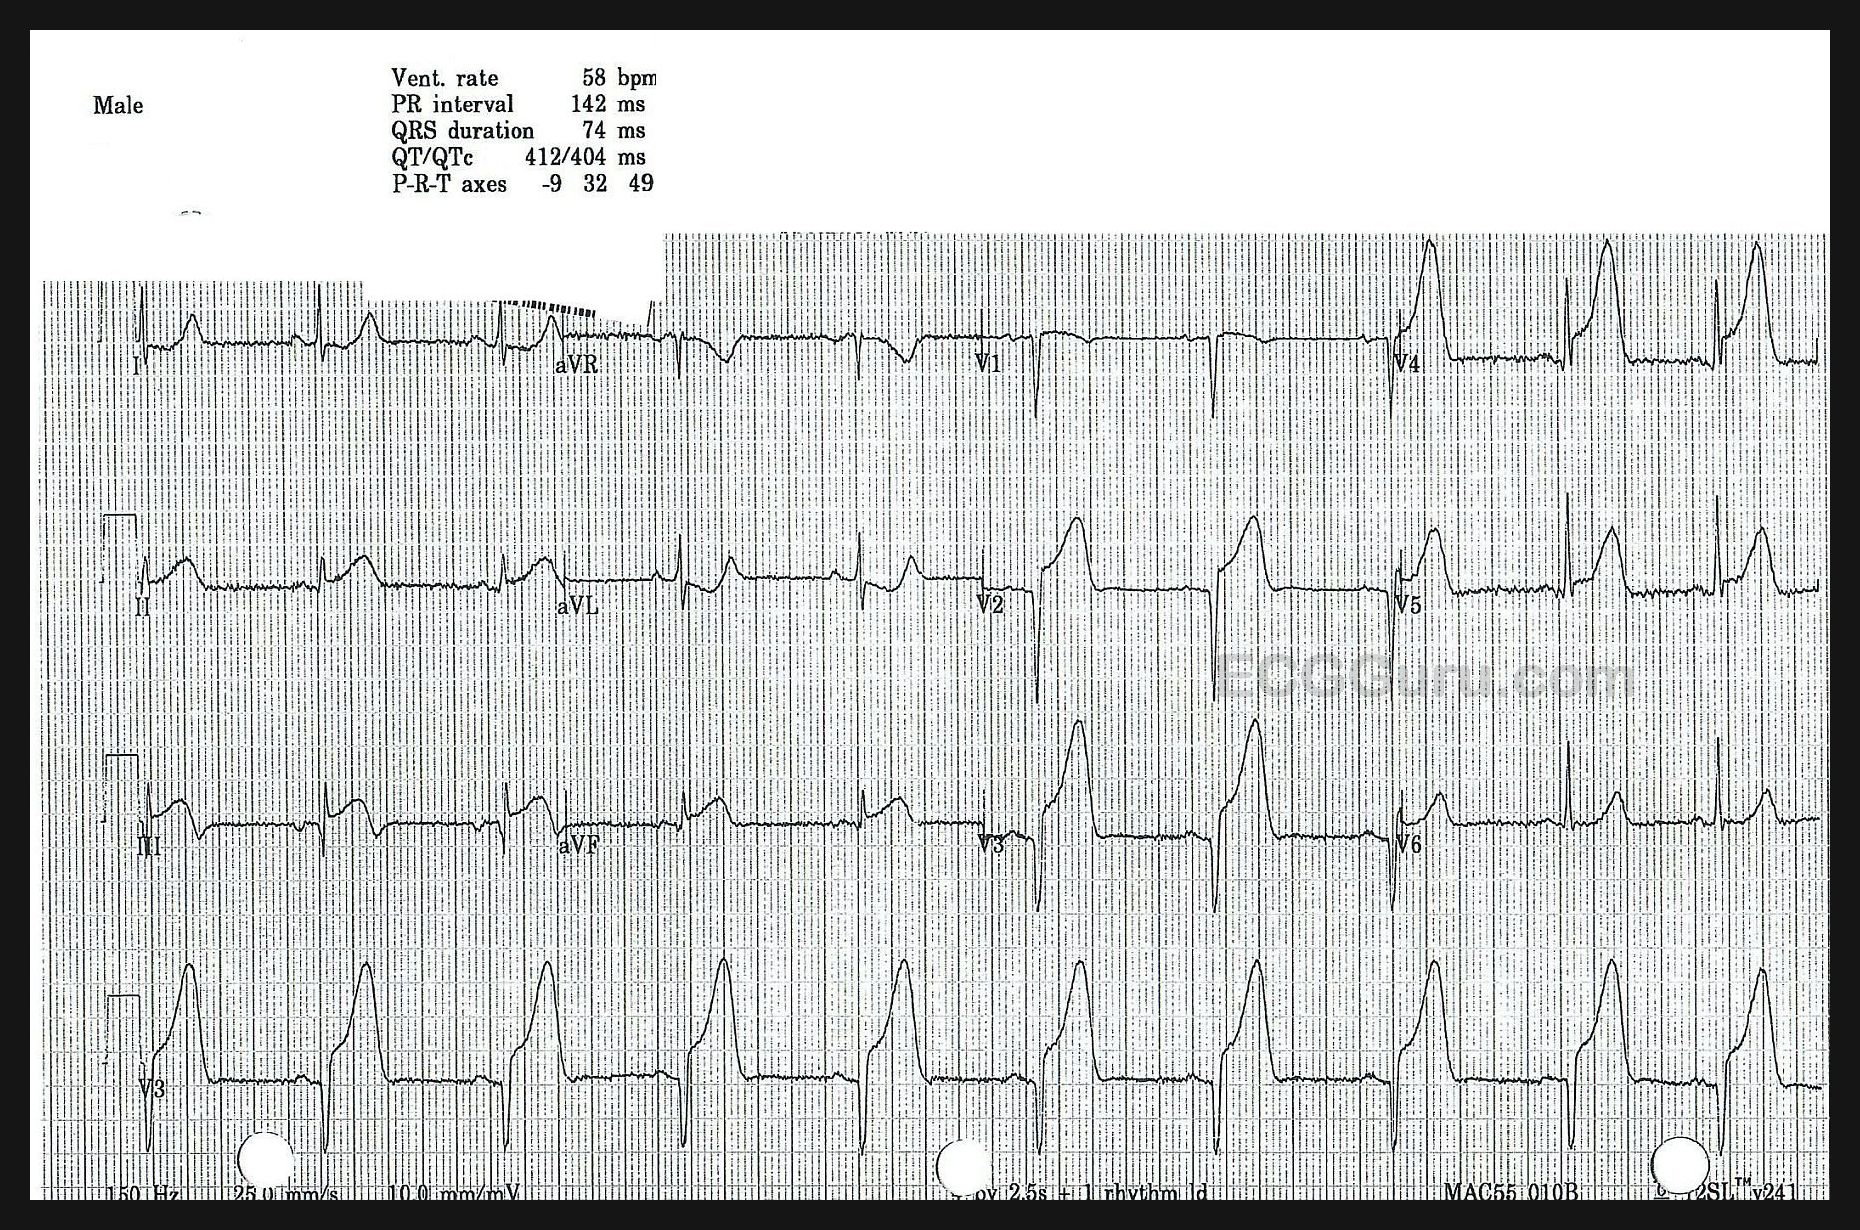
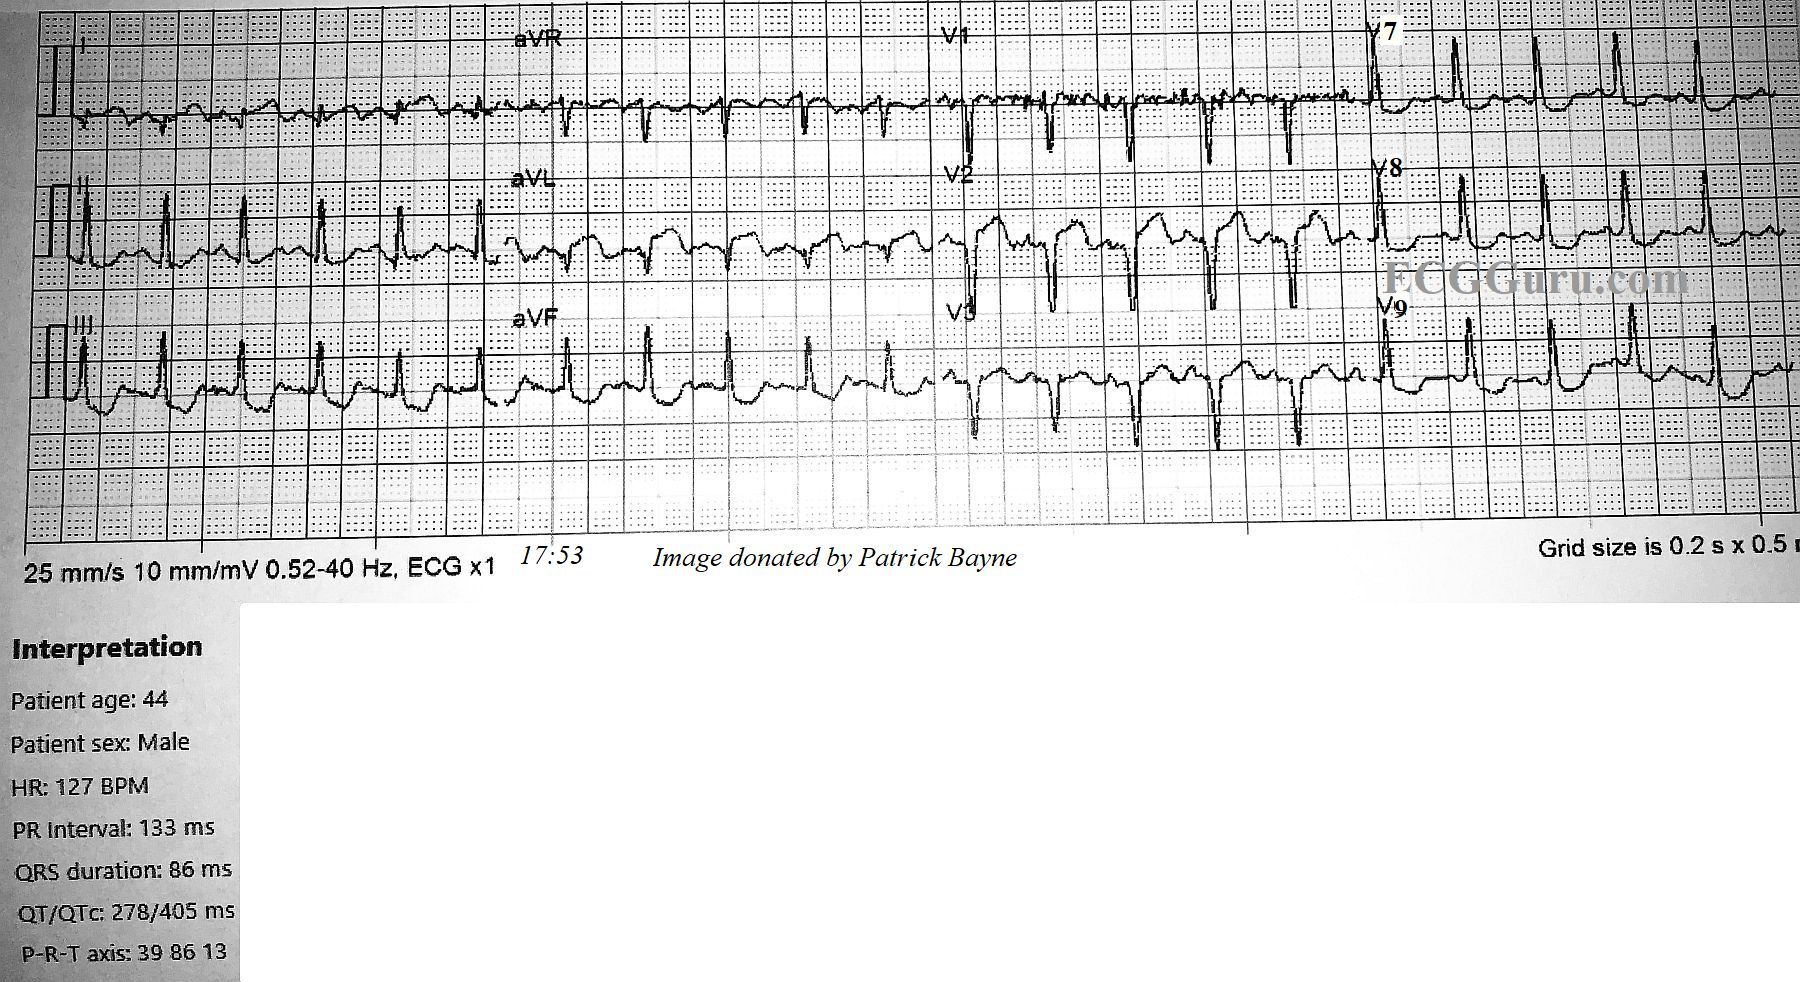
There is definite ST segment elevation in V2 and V3, and the shape of the ST segment is straight, having lost it’s normal “concave upward” appearance.  In an ECG taken three minutes later, the STE extends to V4.

Do the pacemaker or the right bundle branch block prevent us from diagnosing an ST-elevation M.I.?  The answer to that is a resounding “NO!” Pacemakers can sometimes make it difficult to assess ST elevation because ventricular pacing causes ST segment changes.  Pacing the right ventricle causes a depolarization delay in the left ventricle as the impulse travels “cell to cell” across the LV.  This means an RV-paced beat will resemble a PVC from the RV.  When LV depolarization is altered, repolarization will also be altered, causing ST elevation in leads with negative QRS complexes, and ST depression is leads with upright QRSs. These are called discordant ST changes. These changes are proportionate to the height or depth of the QRS, with very minimal or no ST changes in leads with short or biphasic QRS complexes.  We don’t have to worry about that in this situation – the pacemaker is not pacing the ventricles.

Dawn's picture

Simultaneous Occlusions in LAD and Diagonal

This ECG was obtained from a 35-year-old man who was complaining of crushing substernal chest pain which radiated down his left arm for the last ten minutes. He was diaphoretic, and described his pain as a “10” on the 1-10 scale. He got only modest relief from IV fentanyl.

He was transported to a full-service cardiac hospital, where he underwent angioplasty of simultaneous 100% occlusions of his proximal left anterior descending artery and diagonal artery. He was noted to have apical akinesia with a 35% ejection fraction.

He continued to improve following angioplasty, and was discharged home with an external defibrillator vest.

The ECG shows ST elevation in V2, V4, V5, and V6, which makes us suspect that the V2 and V3 wires were switched accidentally.  This reflects damage in the anterior wall of the LV. There is also very marked ST elevation in I and aVL, reflecting damage in the high lateral wall. There is reciprocal ST depression in the inferior leads aVF and III.  Fortunately, there are no pathological Q waves, which would indicate permanent damage from necrosis of the myocardium.

You can see films from his procedure in Heart Art, labeled “Simultaneous Occlusive Lesions in LAD and Diagonal”.

Dawn's picture

Anterior Wall M.I. With Bifascicular Block

This ECG is taken from an 82-year-old man who called 911 because of chest pain.  He has an unspecified “cardiac” history, but we do not know the specifics. 

WHAT IS THE RHYTHM?  The heart rate is 69 bpm, and there are P waves before every QRS complex. The underlying rhythm is regular, with one premature beat that is wide without a P wave.  The PR interval is slightly prolonged at .25 seconds.  The rhythm is normal sinus rhythm with first-degree AV block and one PVC. 

WHY THE WIDE QRS?   The QRS complex is wide at .14 seconds. The QRS in V 1 has a wide R wave after a small Q wave.  This in consistent with right bundle branch block pattern, with loss of the normal initial small r wave (pathological Q waves).  The diagnosis of RBBB is further corroborated by the wide little S waves in Leads I and V6.  The QRS frontal plane axis is -66 degrees per the machine, and clearly “abnormal left” because the QRS in Lead II is negative, while the QRS in Leads I and aVL are positive.  This is left anterior fascicular block, also called left anterior hemiblock.  The combination of RBBB and LAFB is a common one, as the two branches have the same blood supply.  It is also called bi-fascicular block. 

WHAT ABOUT THE ST SEGMENTS?  The ST segments in leads V2 through V6 are elevated, and their shape is very straight, as opposed to the normal shape of coved upward (smile). Even though the amount of ST elevation at the J points appears subtle, the shape of the segments, the fact that they appear in related leads, and the fact that the patient is an elderly male with chest pain all point to the diagnosis of ANTERIOR WALL ST elevation M.I. (STEMI).  Additional ST changes include a straight shape in Leads I and aVL and ST depression in V1 and aVR.  

PATIENT OUTCOME  The patient was transported to a cardiac center, where he received angioplasty in the cath lab.  The left coronary artery was found to be occluded, and was repaired and stented.  He recovered without complications and was sent home in a few days.

Pages

All our content is FREE & COPYRIGHT FREE for non-commercial use

Please be courteous and leave any watermark or author attribution on content you reproduce.