Displaying 1 - 3 of 3
Dawn's picture

Marked Bradycardia With Bifascicular Block

The Patient:    This ECG was taken from an elderly woman. Unfortunately, we do not know any details about the case.  That acknowledged, there are many interesting aspects to this ECG.

The ECG:  The first thing we notice is the severe bradycardia – almost certain to be symptomatic.  The rate is 32 bpm and the rhythm is regular.  There are no P waves.  This is a junctional rhythm, slightly slower than expected from junctional escape.

The QRS shows the presence of right bundle branch block.  Each QRS on the ECG starts as a narrow complex, but then adds an “extra” wave onto the end – the delay caused by the right ventricle depolarizing late.  The terminal delay is very noticeable in V1 as an R’ wave, and in Leads I and V6 as a small, wide s wave.  There is right axis deviation, so the diagnosis of bifascicular block (RBBB and left posterior fascicular block) can be made.

V2 through V6 show fragmentation of the QRS complexes and a loss of voltage and R wave progression.  This points to anterior wall M.I. We can’t know the age of the M.I. without clinical correlation, but the ST segments in those leads are very flat, with uniformly symmetrical inverted T waves all the way to V6.  All of these signs indicate recent injury.  An anterior M.I. can cause the bifascicular block we are seeing, since the bundle branches begin in the septum.

Dawn's picture

Right Bundle Branch Block and More

The Patient:    These tracings are taken from a 75-year-old man who became weak while playing golf on a very hot day.  He was pale and diaphoretic.  He was hypotensive, but we do not know his BP reading. He denies chest pain or discomfort. The patient reported a history of lung cancer and hypertension. We have no other history, and unfortunately, no follow-up information.

ECG Number 1:           The first ECG shows the standard 12 leads.  The rhythm is sinus with frequent appearances of PAC couplets.  The sinus rate varies slightly from about 76 bpm to 68 bpm, tending to slow a bit after the premature atrial contractions.  There is a right bundle branch block, and the QRS duration is about .12 seconds (120 ms). The PR interval is slightly log at 223 ms.  We do not know what medications the patient is on, and we do not have an older ECG for comparison.

There are some interesting, if subtle, changes worth mentioning.  The QRS complexes in most leads are fragmented.  That is, they have notching in the terminal S or R waves that is not due to the bundle branch block. This can be a sign of scarring, and can also be considered an equivalent to a pathological Q wave.  Speaking of pathological Q waves, they are seen in the inferior leads, II, III, and aVF.  There are also prominent, though not large Q waves in V4 through V6, leads which normally do not have them. All this points to scarring and possibly long-term coronary artery disease, with possible old M.I.  In addition, the ST segments are not entirely normal.  There is ST depression in the inferior and low lateral leads, a little ST elevation in aVL.  Also, the SHAPES of the ST segments tend to be straight throughout the ECG, instead of the usual curved (concave up) appearance.

Dawn's picture

Inferior-lateral M.I. With QRS Fragmentation

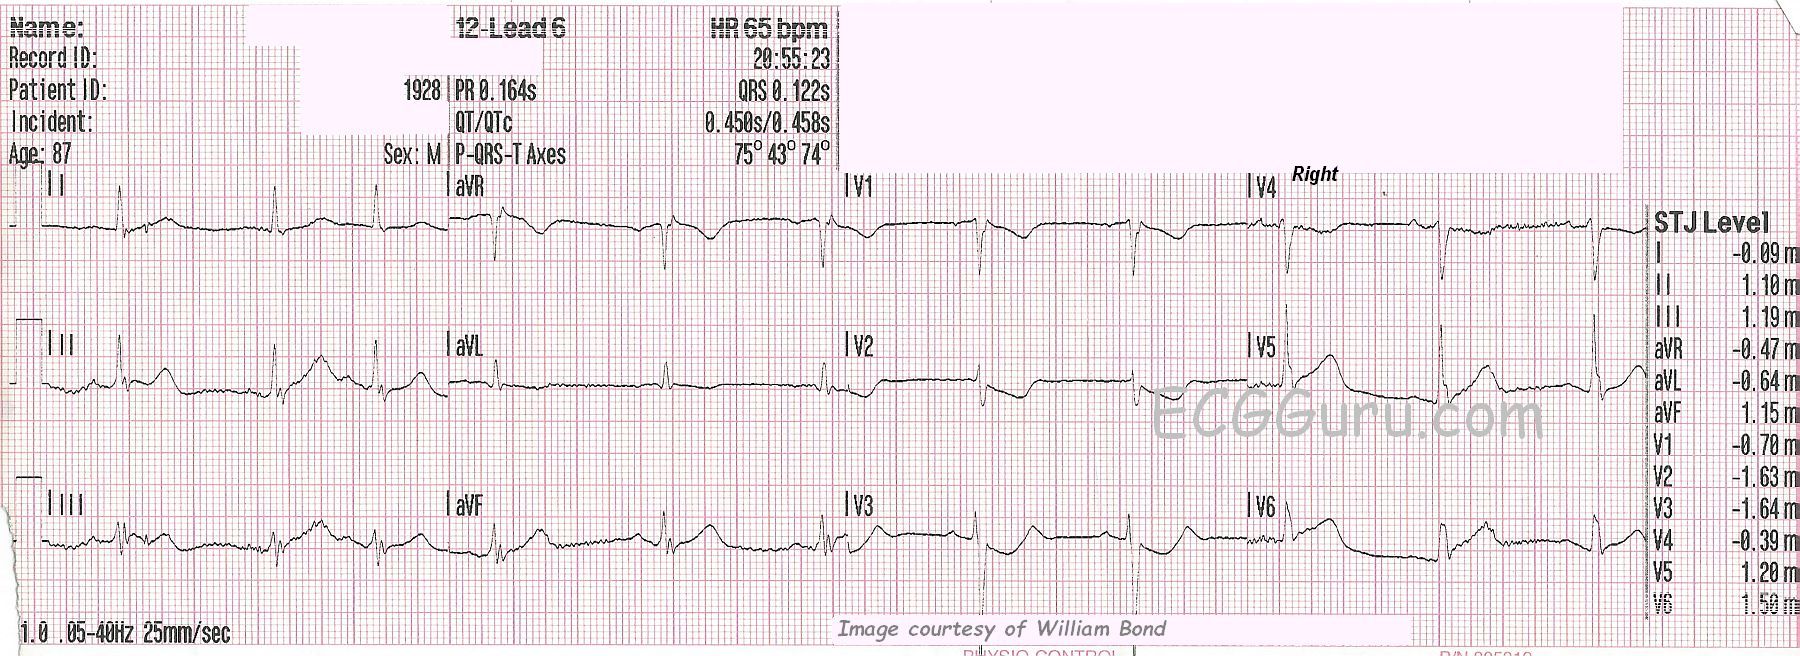
SUBTLE ST CHANGES   This ECG was obtained from an 87-year-old man who was experiencing chest pain.  Due to the subtle ST elevation in Leads II, III, aVF, V5, and V6, (inferior- lateral walls) the ECG was transmitted to the hospital by the EMS crew, and the cath lab was activated.  The patient denied previous cardiac history. 

In addition to the subtle ST elevation, there is ST depression in V1 through V4, which represents a reciprocal view of the injury in the inferior-posterior-lateral wall.  Because the anterior wall is superior in its position in the chest, it is opposite the inferior/posterior wall, and can show ST depression when the inferior-posterior area has ST elevation. This ECG was the 6th one done during this EMS call.  Prior to this one, the ST segments were elevated less than 1 mm.  This is a good example of the value of repeat ECGs during an acute event.  

RIGHT VENTRICULAR M.I.?     This ECG was done with V4 placed on the right side, to check for right ventricular M.I., which is a protocol for this EMS agency. When the right coronary artery is the culprit artery (about 80% of IWMIs), RVMI is likely.  In RVMI, we would usually see reciprocal ST depression in Leads I and aVL, but the STE is very subtle here, so the depression would likely be also.  When the culprit artery is the left circumflex artery (<20%), lateral lead ST elevation is more likely, as we see here in V5 and V6. 

WHAT ABOUT RHYTHM?     The rhythm is sinus with PACs.  PACs are considered to be benign in most situations, but in a patient with acute M.I., any dysrhythmia can be concerning. The QT interval, measured as QTc (corrected to a heart rate of 60 bpm), is slightly prolonged at .458 seconds (458 ms).  Over .440 seconds is considered prolonged in men, and over .500 sec. places the patient at increased risk of developing torsades de pointes.  CAD and myocardial ischemia can lead to this modest increase in QTc.

All our content is FREE & COPYRIGHT FREE for non-commercial use

Please be courteous and leave any watermark or author attribution on content you reproduce.