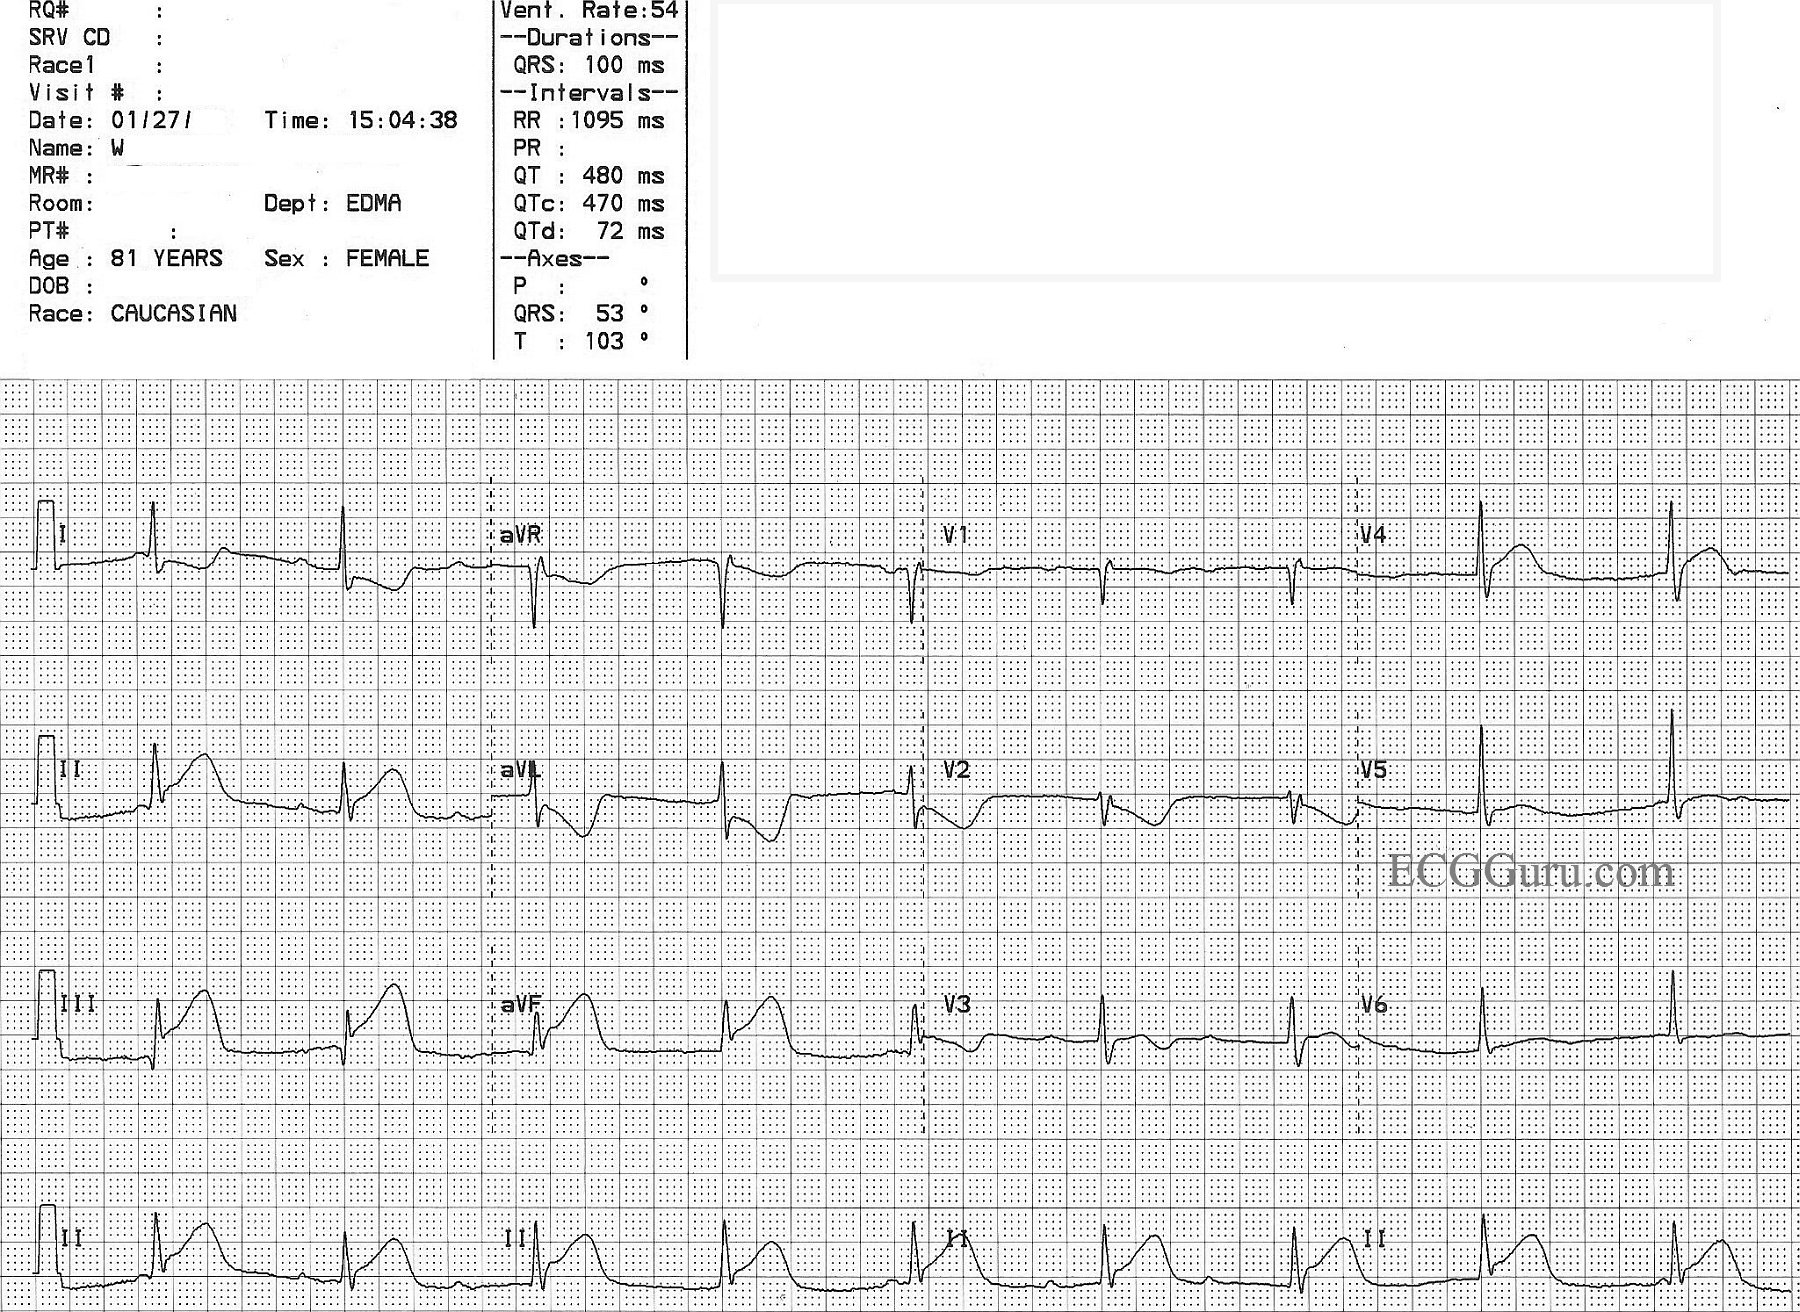
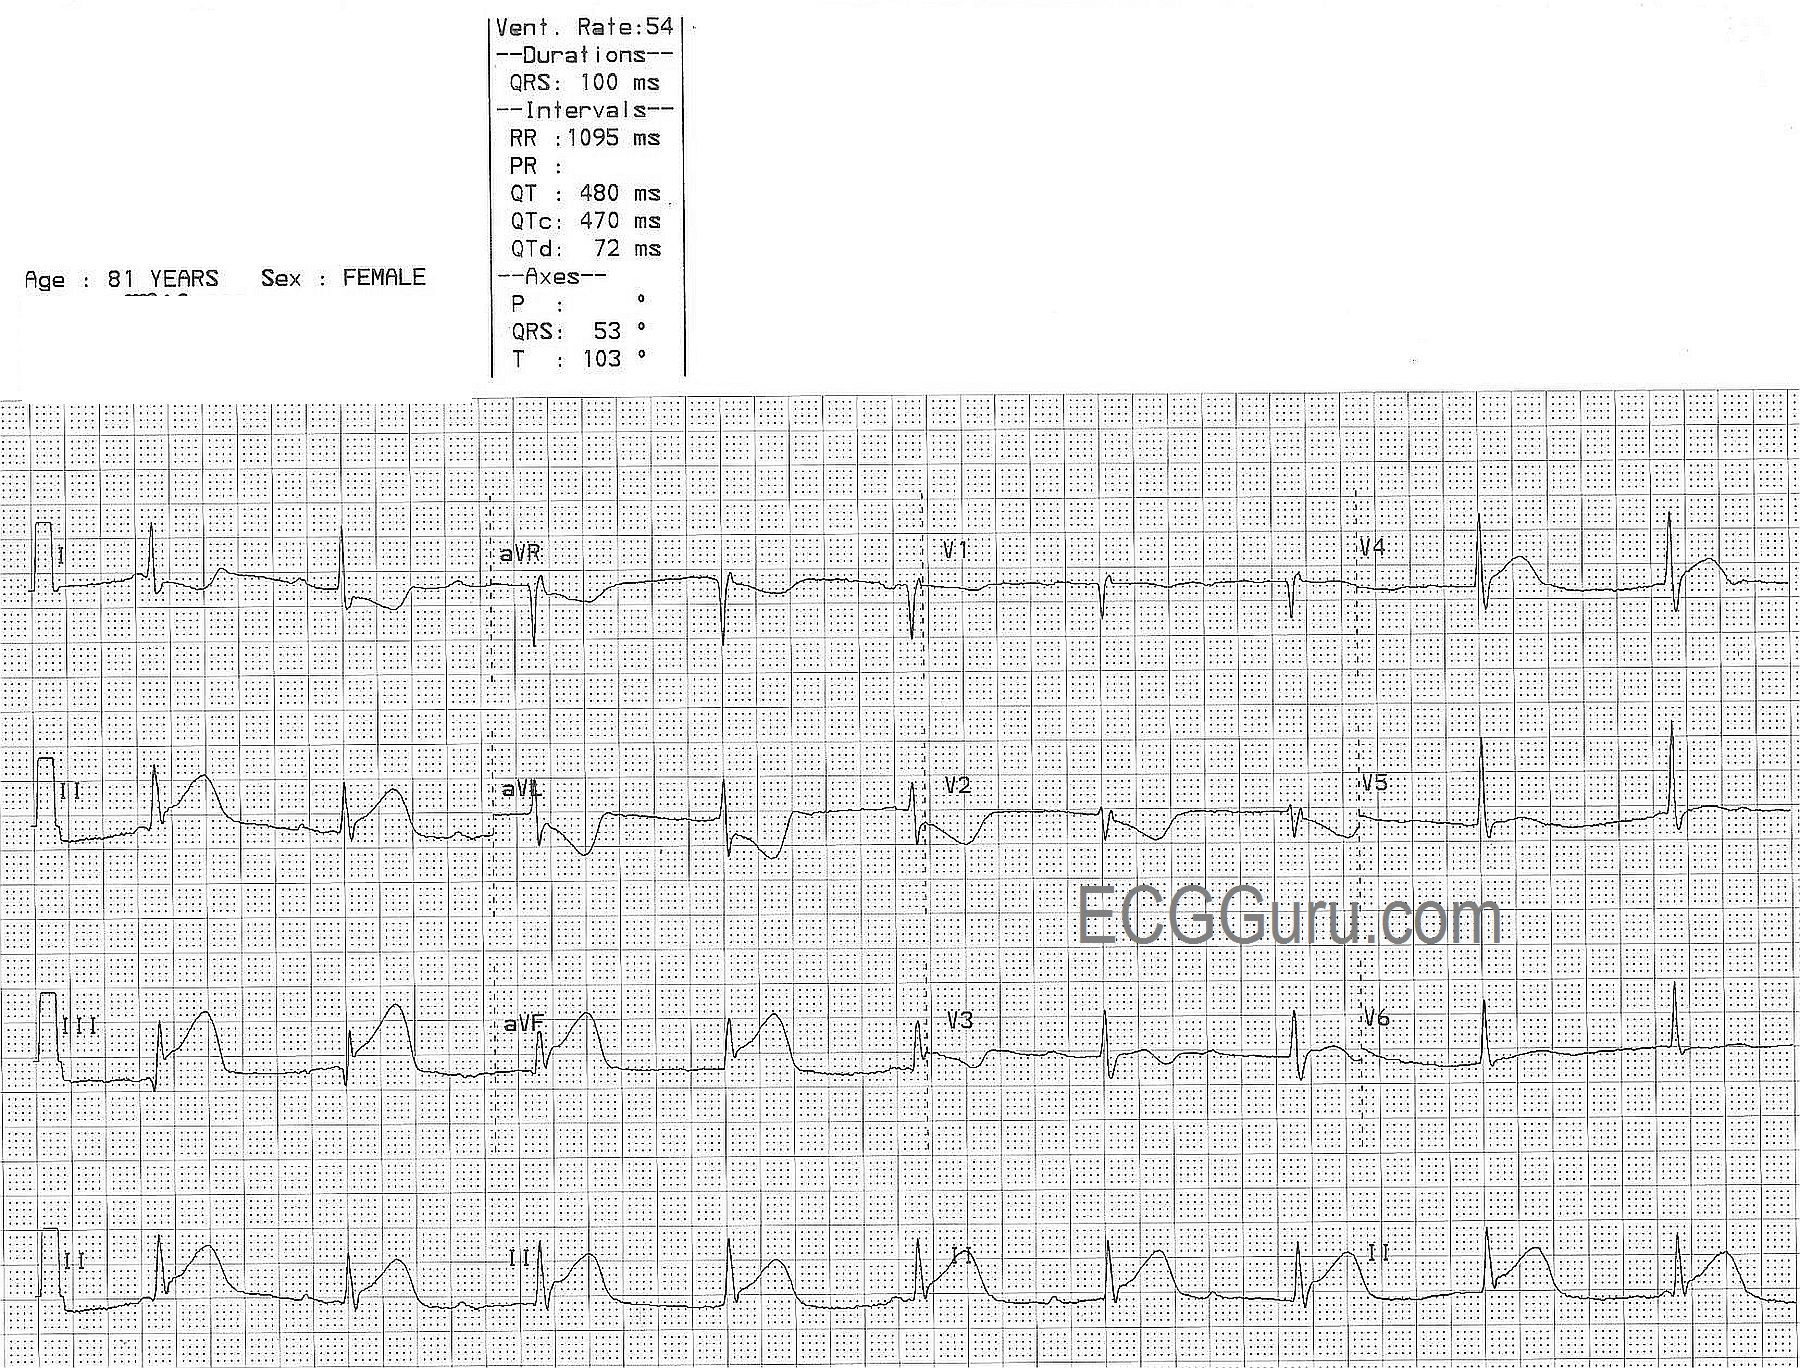
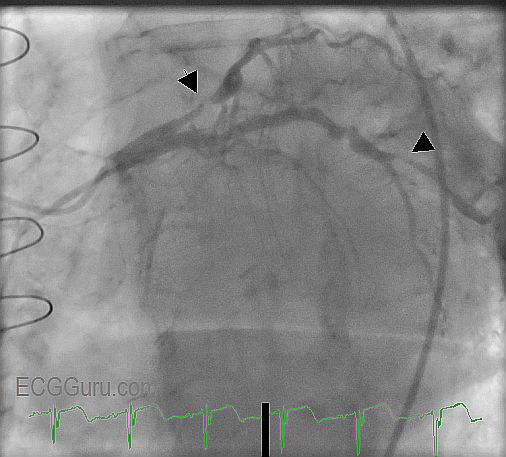
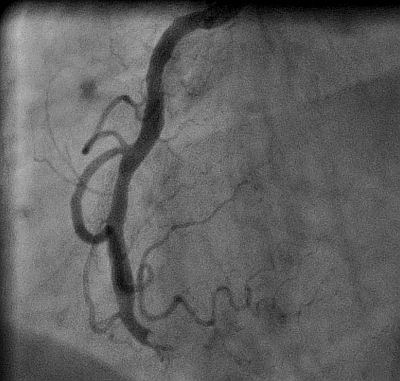
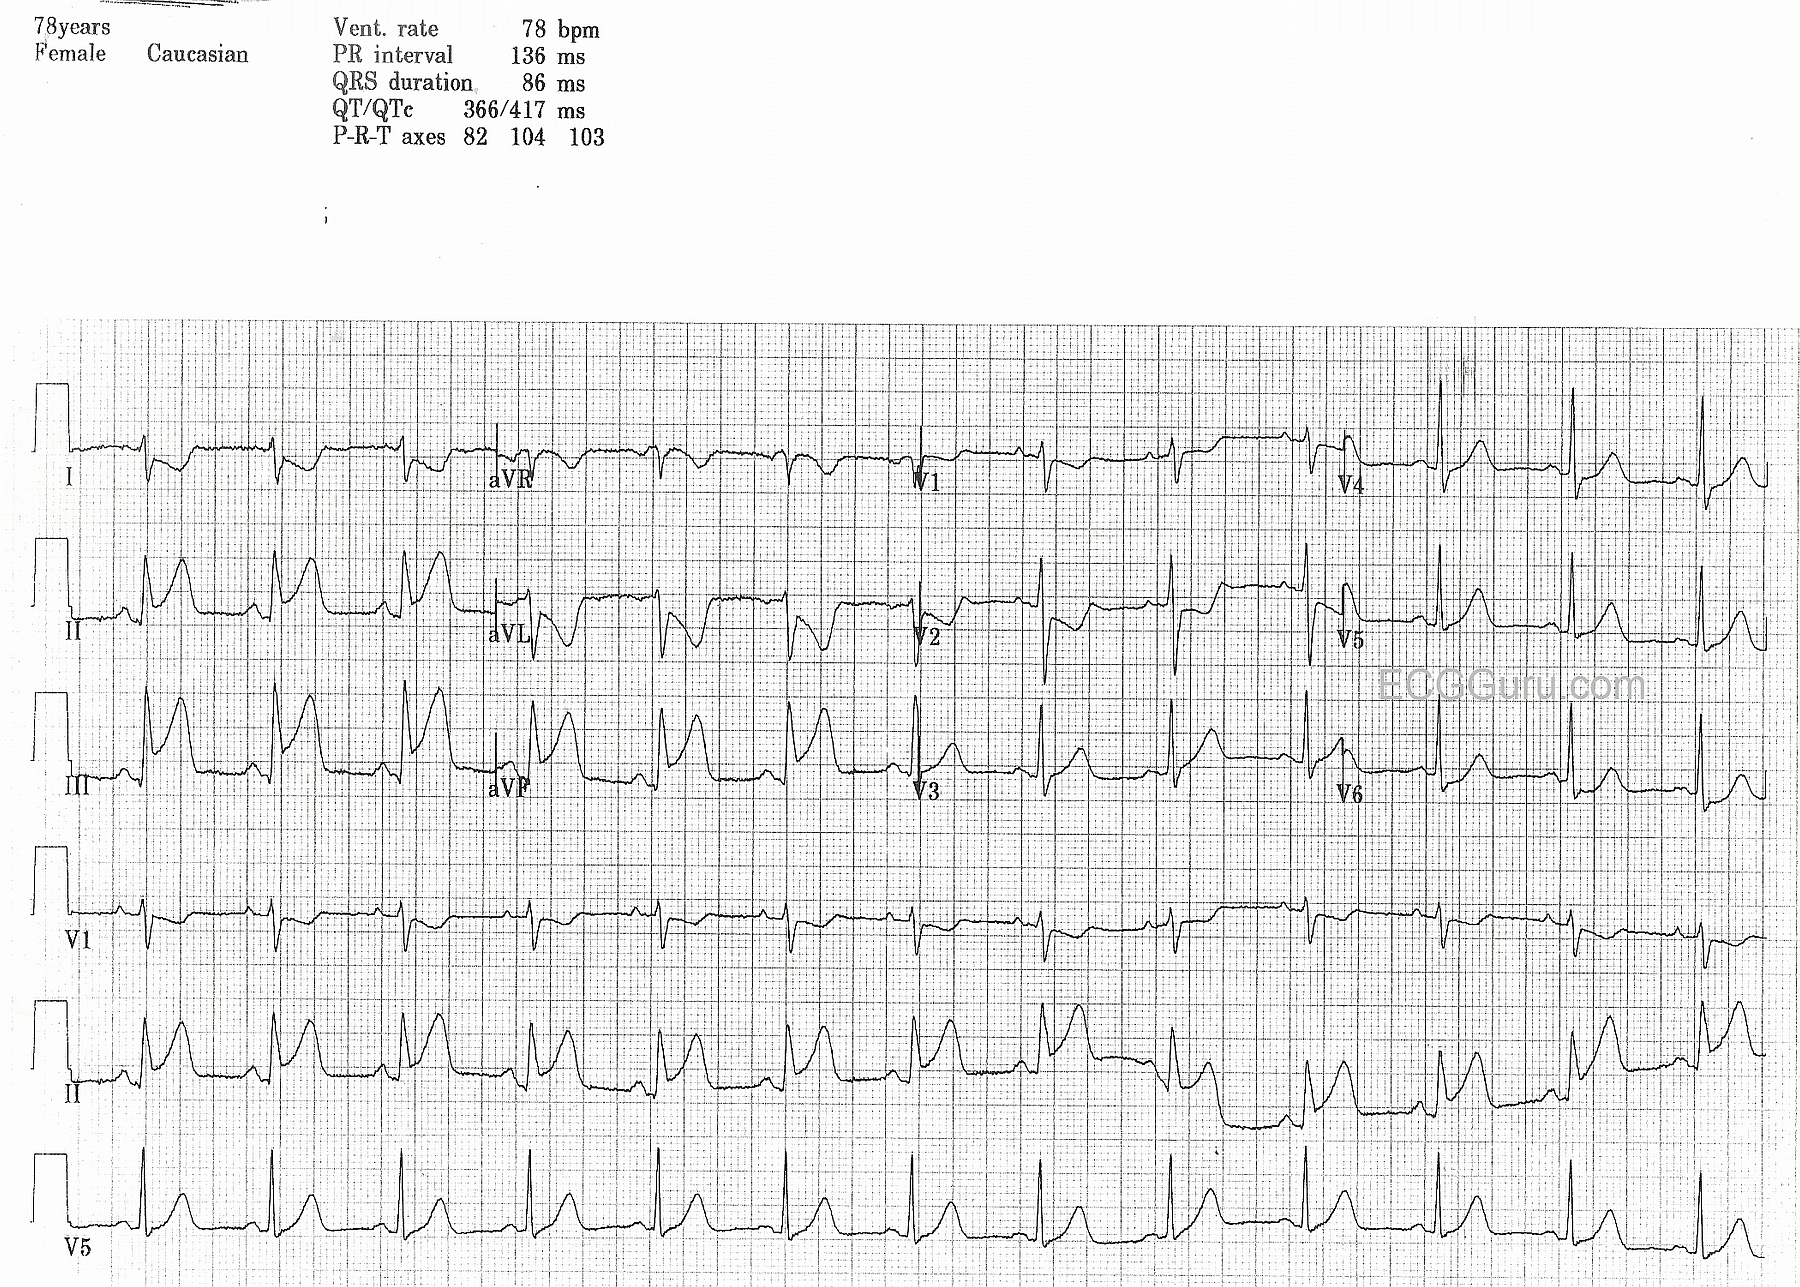
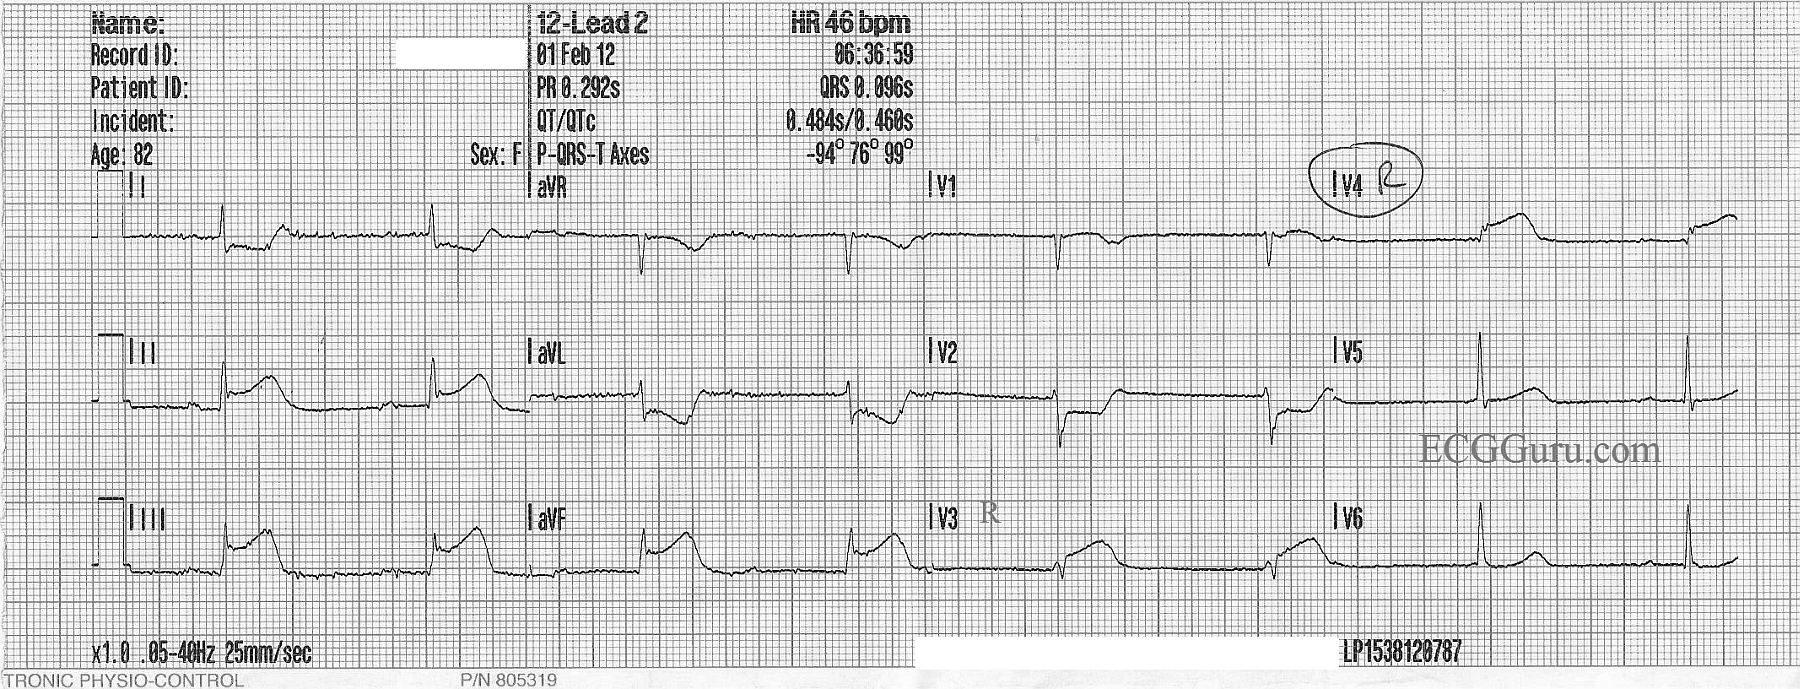
This week's ECG of the Week is from an elderly woman who suffered an acute occlusion of the right coronary artery. The ECG clearly shows ST elevation in leads II, III, and aVF, indicating inferior wall injury. In this case, this ECG was obtained in the field by paramedics, and was the second ECG done on this patient. For this tracing, the paramedics obtained V3 and V4 on the right side to better view the right ventricle. V3 and V4 right clearly show ST elevation as well, indicating RVMI. The slight coving and elevation observable in V1 is also an indication of RV involvement, and the ST depression in V2 indicates posterior wall injury. All of this results from a proximal lesion of the RCA in this patient. Such a lesion carries a high morbidity and mortality.
Taking the time to obtain a right ventricular lead is controversial in some settings. Some believe the patient's hemodynamic condition should be treated, regardless of the presence or absence of ST elevation in right chest leads. Others find it very helpful to know that the right ventricle is affected. In this case, paramedics in this community have a protocol to avoid the use of nitroglycerine in RVMI patients, even when the BP is adequate. So, for them, it is important to have the information gathered from V Right leads.
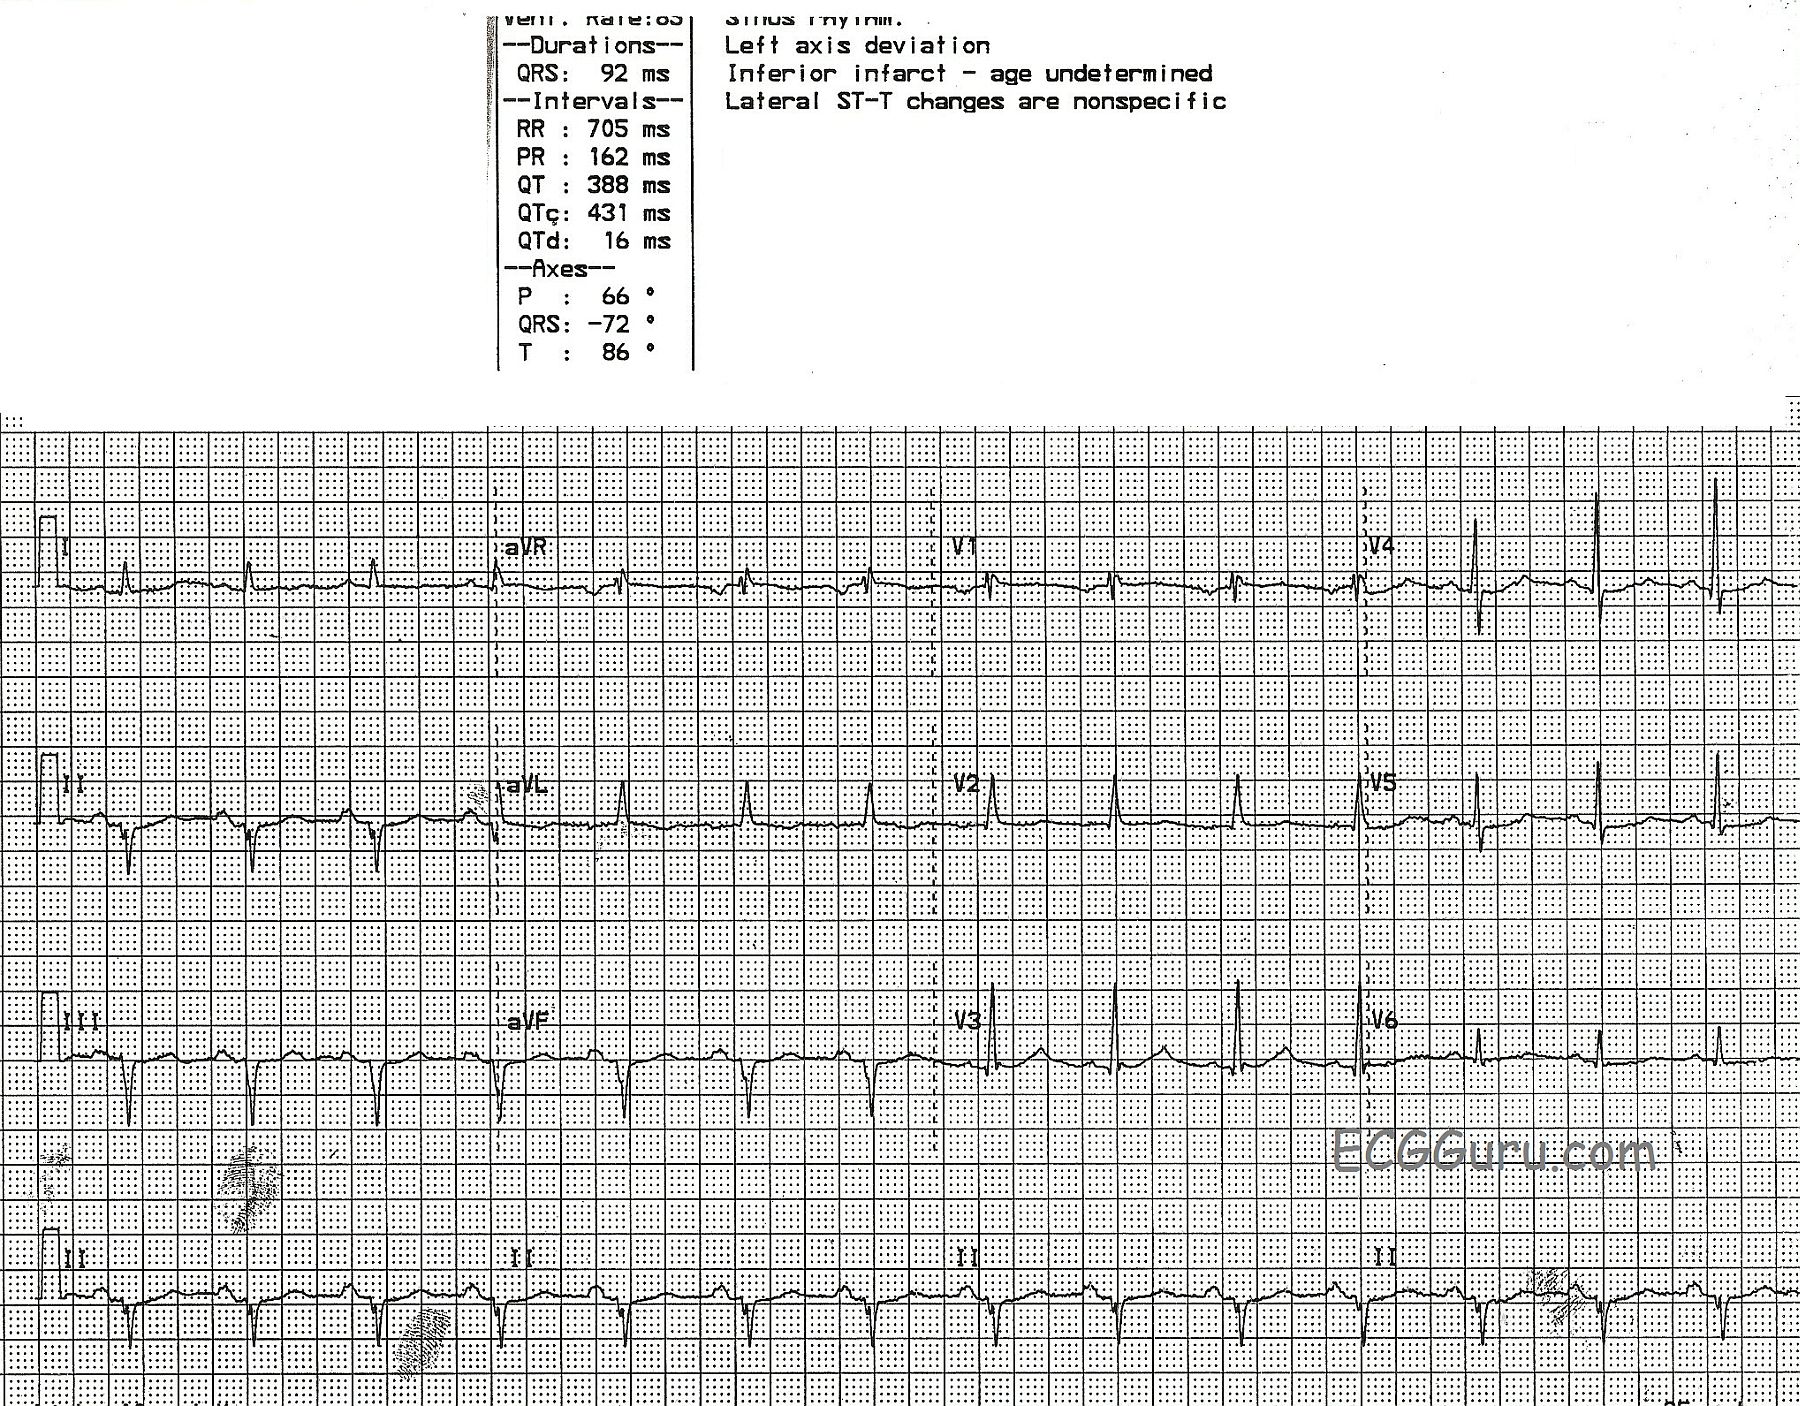
The rhythm here is interesting, as well, and not at all uncommon for IWMI patients. The baseline artifact makes it a bit difficult to march out all the P waves, but it appears they are sinus P waves that are slightly irregular at a rate of 52 to 54. The PR intervals appear to be progressively prolonging, but there is no "grouped beating" observable on this short strip. A lack of a concurrent Lead II rhythm strip also makes it difficult to determine the rhythm, as Lead II does have very visible P waves, and would be helpful. The regularity of the narrow complex bradycardia points to a junctional escape rhythm, which would make this a third-degree AVB at the AV node level, which is very common with IWMI. What do you think?
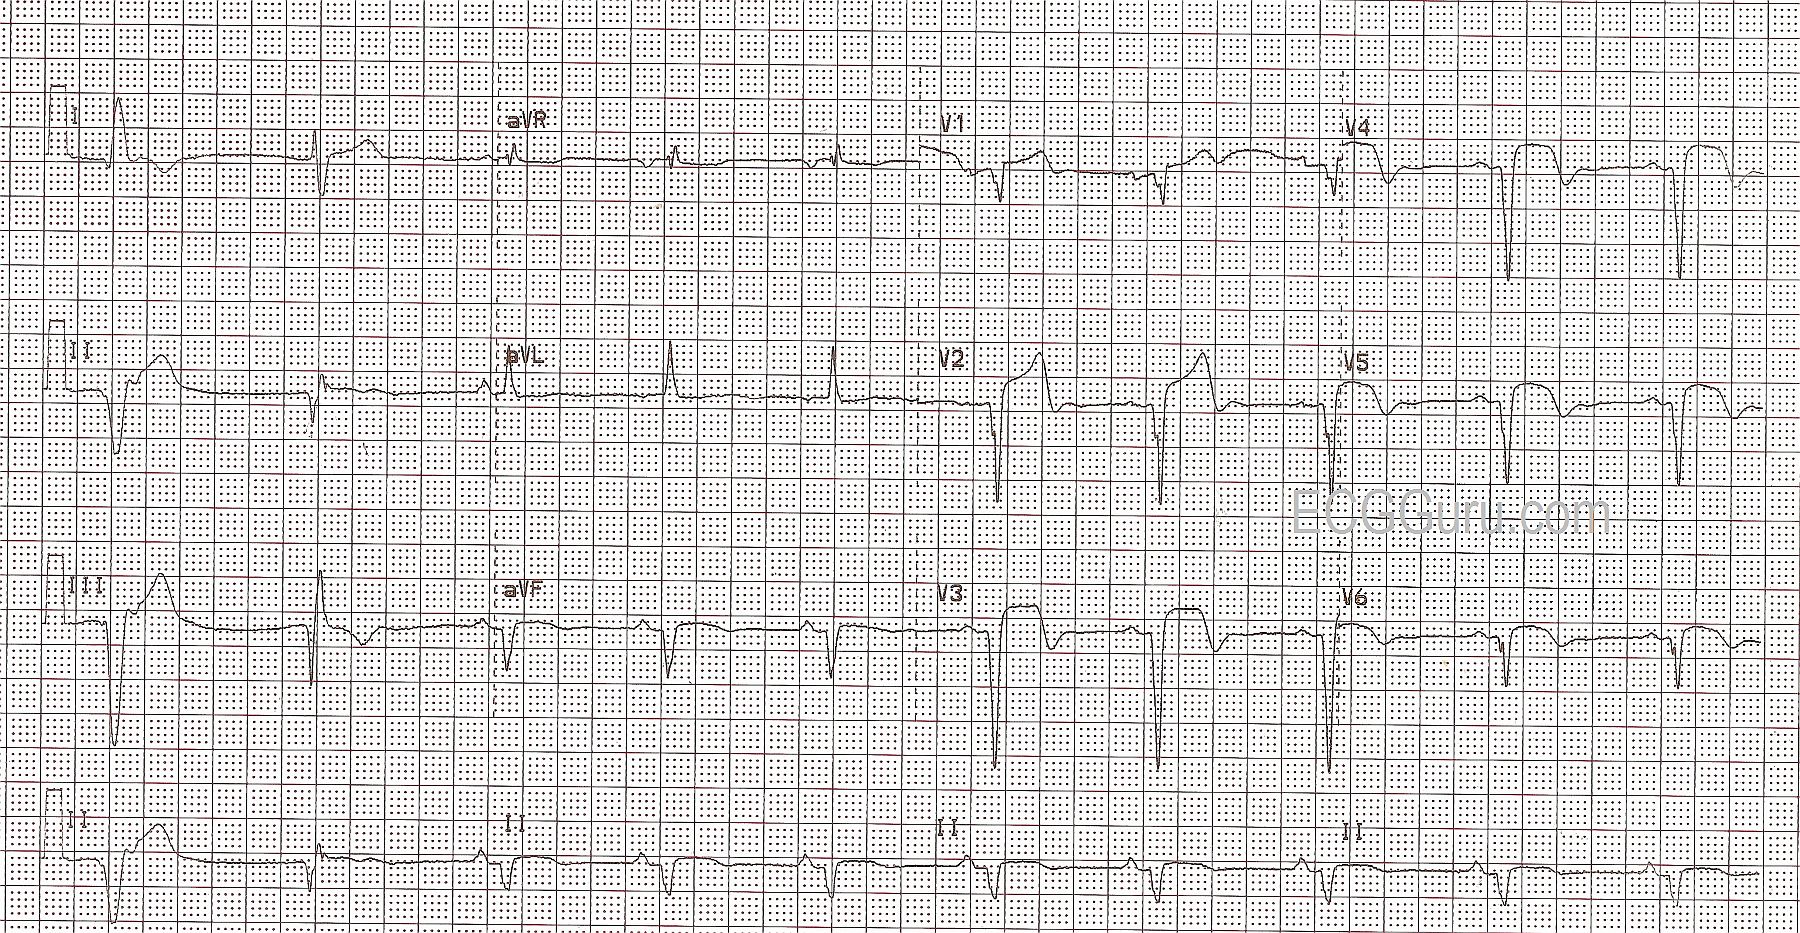
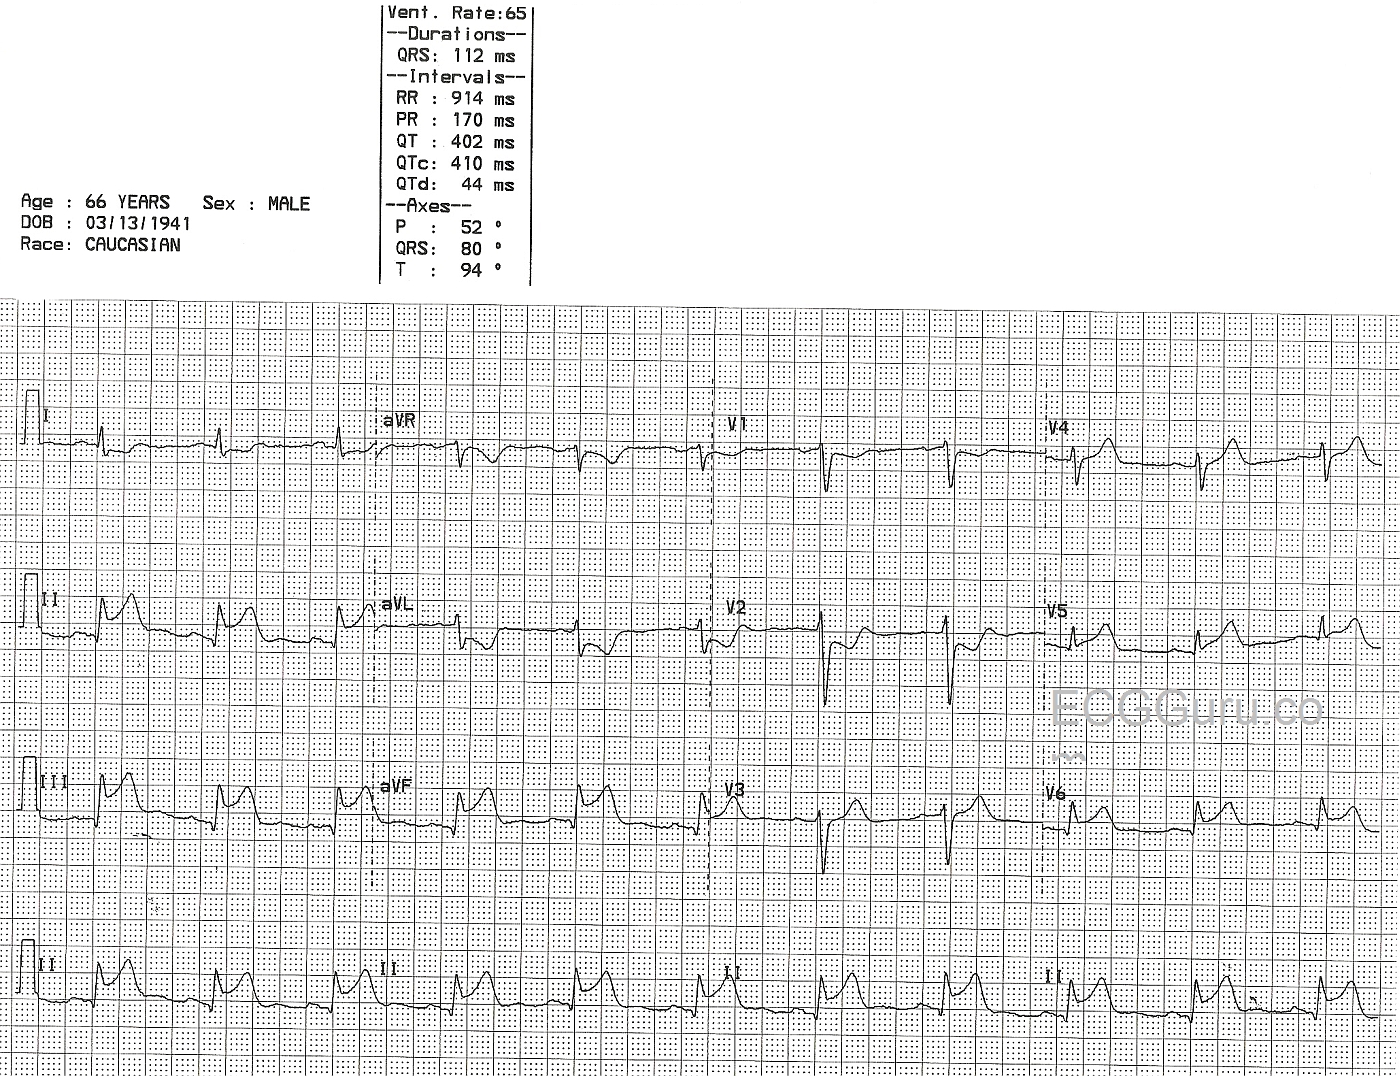
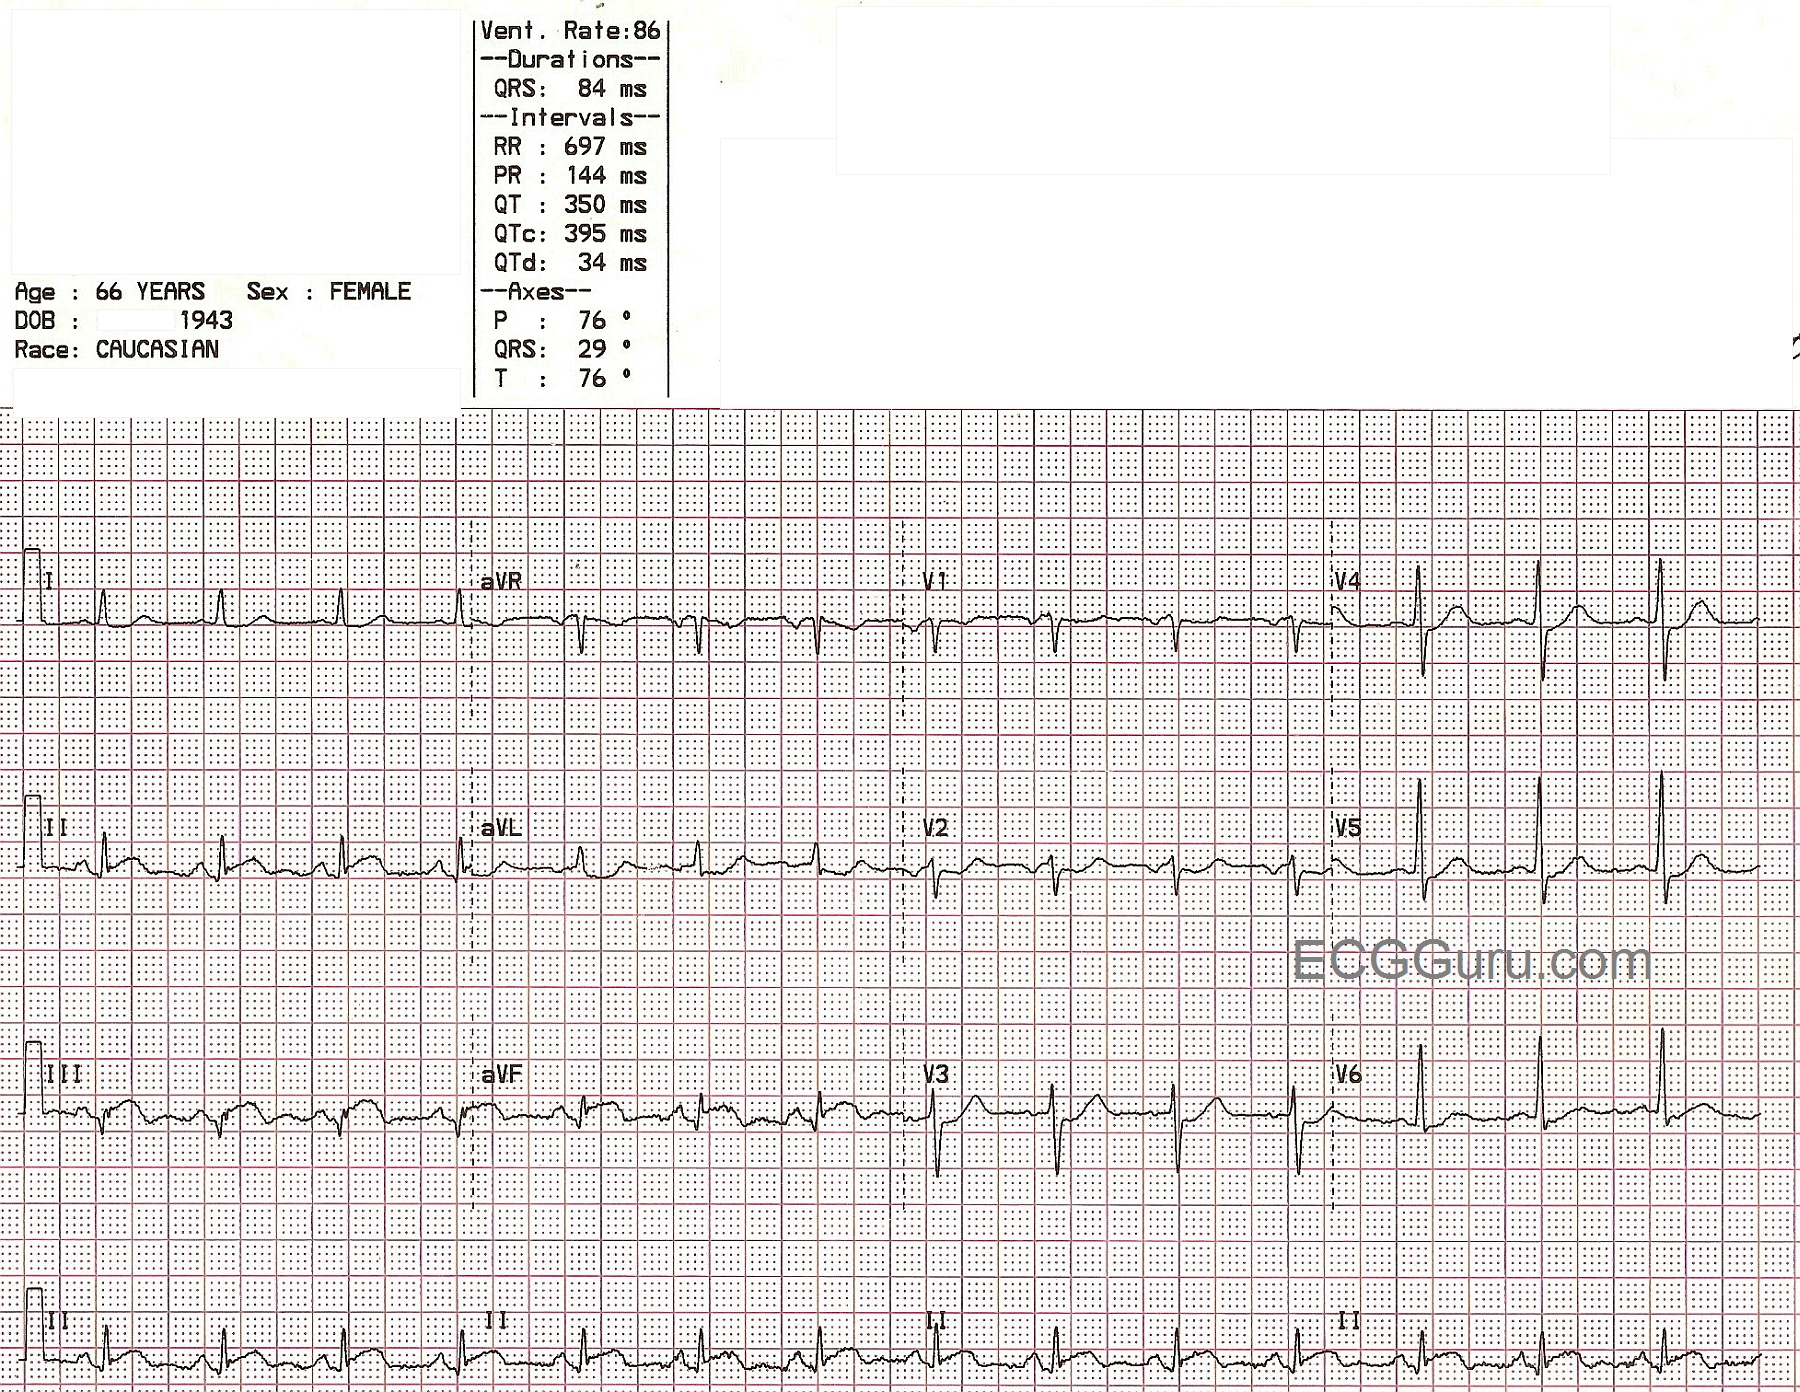
This month's strip from Jason Roediger's ECG Challenge blogpost is a nice complement to the strip presented here. His is much clearer, and has a Lead II rhythm strip. Do you think these ECGs show the same rhythm, or two different rhythms?
For an excellent discussion of "AV Dissociation" vs. "AV Block", go to Christopher Watford's Ask the Expert post. Thanks very much to ECG Guru Sebastian Garay for this interesting ECG.