Displaying 1 - 10 of 11
Dawn's picture

Onset of Pathological Q Waves

 The Patient:     44-year-old man with chest pain.  Symptoms started over 24 hours ago. The EMS crew recognized an acute M.I. on the ECG and transferred him immediately to a cardiac hospital. They started two I.V.s and gave aspirin enroute. 


ECG No. 1 @17:43:    The rhythm is sinus tachycardia at 118 bpm.  The PR interval is within normal limits at 130 ms, and the QRS is narrow at 84 ms.  The QTCc is 478 ms by the machine’s measurement, but we measured the QT at 303 ms and QTc as 376-419 ms via various methods, which are within normal limits. The QRS frontal plane axis is at 15 degrees, within normal limits.

The ST segments are elevated and mostly straight in Leads V1 through V5, I and aVL. There is mild ST depression in III and aVF.  Very concerning are the pathological Q waves in V1 through V5, indicating loss (death) of myocardial tissue in the anterior wall. 

ECG No. 2 @ 17:53:  The second ECG was performed about 10 minutes later, and V4, V5, and V6 were replaced by V7, V8, and V9.  Reciprocal ST depression is observed in those additional leads. The heart rate is now 128 bpm.  It is notable that pathological Q waves have now appeared in Leads I and aVL. There has been no change in lead placement.  The onset of necrosis in the high lateral wall has shifted the frontal plane axis toward the right extreme of normal, at 86 degrees, and now II, III, and aVF have prominent R waves. Another cause for right axis shift in anterior wall M.I. to consider would be posterior hemiblock. However, that is a diagnosis of exclusion, and the new Q waves explain the axis shift.  It is interesting that the onset of pathological Q waves was captured in these serial ECGs.

Dawn's picture

Previous Anterior Wall M.I.


If you are an instructor, or a fairly new student, you don’t always need to see “challenging” ECGs. But, you may not want to see “standard” ECGs from an arrhythmia generator, either.  Every ECG contains subtle and not, so subtle characteristics of the person it belongs to.  Take a minute to look at this ECG before reading the discussion, and ask yourself what you might surmise about the patient.

The Patient: We don’t know much about the actual patient this ECG came from.  What we do know is that he is an elderly man with a history of heart disease who was hospitalized sometime in the past with an acute M.I.  He is now on beta blocker medication and is on a diet, as he is approaching the “morbidly obese” classification.  He is now in the ER with shortness of breath and mild chest pain.  What does his ECG tell us?

Dawn's picture

Right Bundle Branch Block With Probable Previous M.I.

This ECG was obtained from an 87-year-old man with chest discomfort.  We have no other clinical information.

ECG Interpretation   The rhythm is regular and fast, with P waves, at 95 beats per minute. So, it is normal sinus rhythm, but the rate is probably not “normal” for this patient.  The P waves are small, and difficult to see.  We suggest Lead I to best view the P waves in this example. This is a good opportunity to teach the value of evaluating rhythm strips in more than one simultaneous lead, as subtle features may not show up well in all leads.  There is a first-degree AV block, with a PR interval of 232 ms.

We see the right bundle branch block (RBBB) pattern: rSR’ in the right precordial leads (with a tiny q wave in V1, which is not typical of  RBBB).  The QRS is wide at 148 ms (.148 seconds).  The R prime (R’) represents the right ventricle depolarizing slightly after the left ventricle.  This terminal delay widens the QRS without affecting the depolarization or contraction of the left ventricle.  This delay can be seen in every lead, but is especially easy to see in Leads I and V6, where there is a wide little s wave.  It is normal for the T waves to be in a direction opposite that of the terminal wave (inverted in Leads V1 and III, for example.)

There is left axis deviation.  The causes of LAD are many.  It is not unusual for people with RBBB to also have a left anterior hemiblock (LAH), also called left anterior fascicular block.  The left anterior fascicle has the same blood supply as the right bundle branch.   LAH causes a frontal plane axis shift – instead of Lead II having the tallest QRS of the limb leads, Leads I and aVL will be the tallest upright QRS complexes of the six limb leads.  Lead II will be very small, or flat, or negative. However, the probability of pathological Q waves in the inferior leads offers a more likely explanation for the leftward axis shift.  The M.I. that would have caused these Q waves is old, as there are no acute ST changes.  It would, of course, help to know this patient’s history.

Right bundle branch block can make evaluating for ST segment elevation a bit tricky.  Occasionally, the terminal delay – especially in Leads III and aVF – can be mistaken for ST elevation.  The J points in this ECG all appear to be at the baseline, with no overt STEMI.


Dawn's picture

Anterior Wall M.I. With Ventricular Bigeminy

The Patient     This ECG was obtained from a 51-year-old man who presented to EMS with acute chest pain. He had a history of hypertension, 40 pack-year smoker.

Hospital Course     He was diagnosed with anterior wall STEMI and taken to the cath lab.  He was rated Killips Class 1 (no evidence of congestive heart failure), TIMI risk score 4  (14% risk of all-cause 30-day mortality).  He underwent primary percutaneous coronary intervention (PCI) of the proximal left anterior descending coronary artery (LAD).

Ten days post PCI, the patient had ventricular arrhythmias and went into cardiac arrest, but was resuscitated. He continued to have occurrences of non-sustained ventricular tachycardia (VT), progressing to sustained VT.  Electrolytes were monitored and corrected when necessary. The patient expired before any further diagnosis was made.

ECG Interpretation    The rhythm is sinus at a rate of about 80 bpm (first two beats).  The PR interval is about .18 seconds.  The QRS duration is about .10 seconds.  After the second sinus beat, ventricular bigeminy occurs. Every other sinus beat is obscured by the PVCs.  By the end of the strip, the underlying sinus rhythm has slowed slightly.

The ECG signs that the ectopic beats are ventricular are:  lack of P waves associated with the premature beats, QRS width about .16 seconds, and compensatory pauses.  The axis of the sinus beats is around 60 degrees (normal), but the axis of the premature beats is difficult to determine due to the low voltage and biphasic QRS complexes in the frontal plane leads.  It is also difficult to determine ST and T wave changes in the PVCs for the same reason.

Dawn's picture

Recent M.I.

This ECG is from a 54-year-old woman who had an M.I. one week prior to this tracing.  She did not receive interventional treatment, as it was not available where she lived when this happened years ago.  Her ECG shows the signs of healing injury, as well as probable permanent damage. 

Where was this M.I.?      The affected leads are all of the precordial leads (V1 through V6), as well as I and aVL.   The precordial leads reflect the anterior and low lateral walls of the heart, and Leads I and aVL show us the high lateral wall.  This area is perfused by the left coronary artery, and she had a proximal lesion. 

What ST and T wave changes are present?    All of the leads listed above show a flattening of the ST segments.  While they are no longer elevated (the acute injury is over), they are flat and almost convex upward.  This shape is usually abnormal, and it has persisted even though the acute injury is subsiding.  The T waves in the anterolateral leads are all inverted.  This represents reperfusion of the injured tissue.  Whether the offending clot is removed by invasive procedure, thrombolytic drugs, or natural degradation, the tissue that is still alive will reperfuse. 

Dawn's picture

Inverted T waves in Lateral Wall

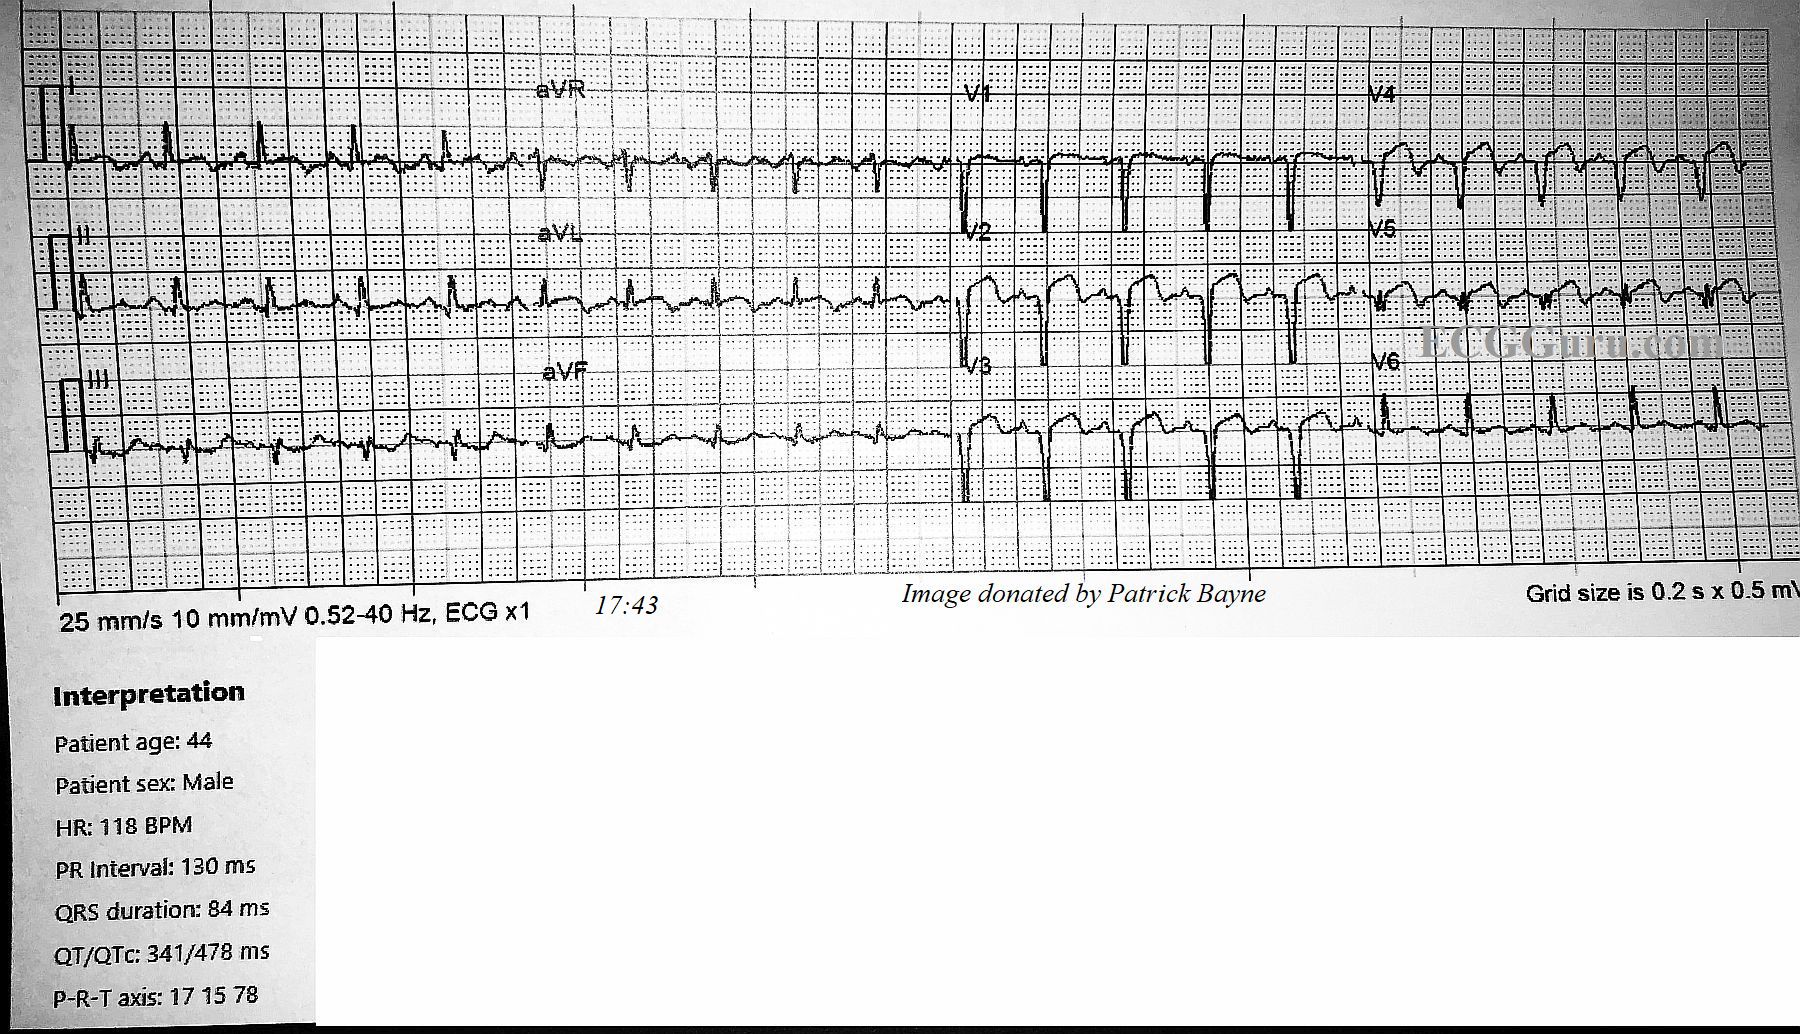
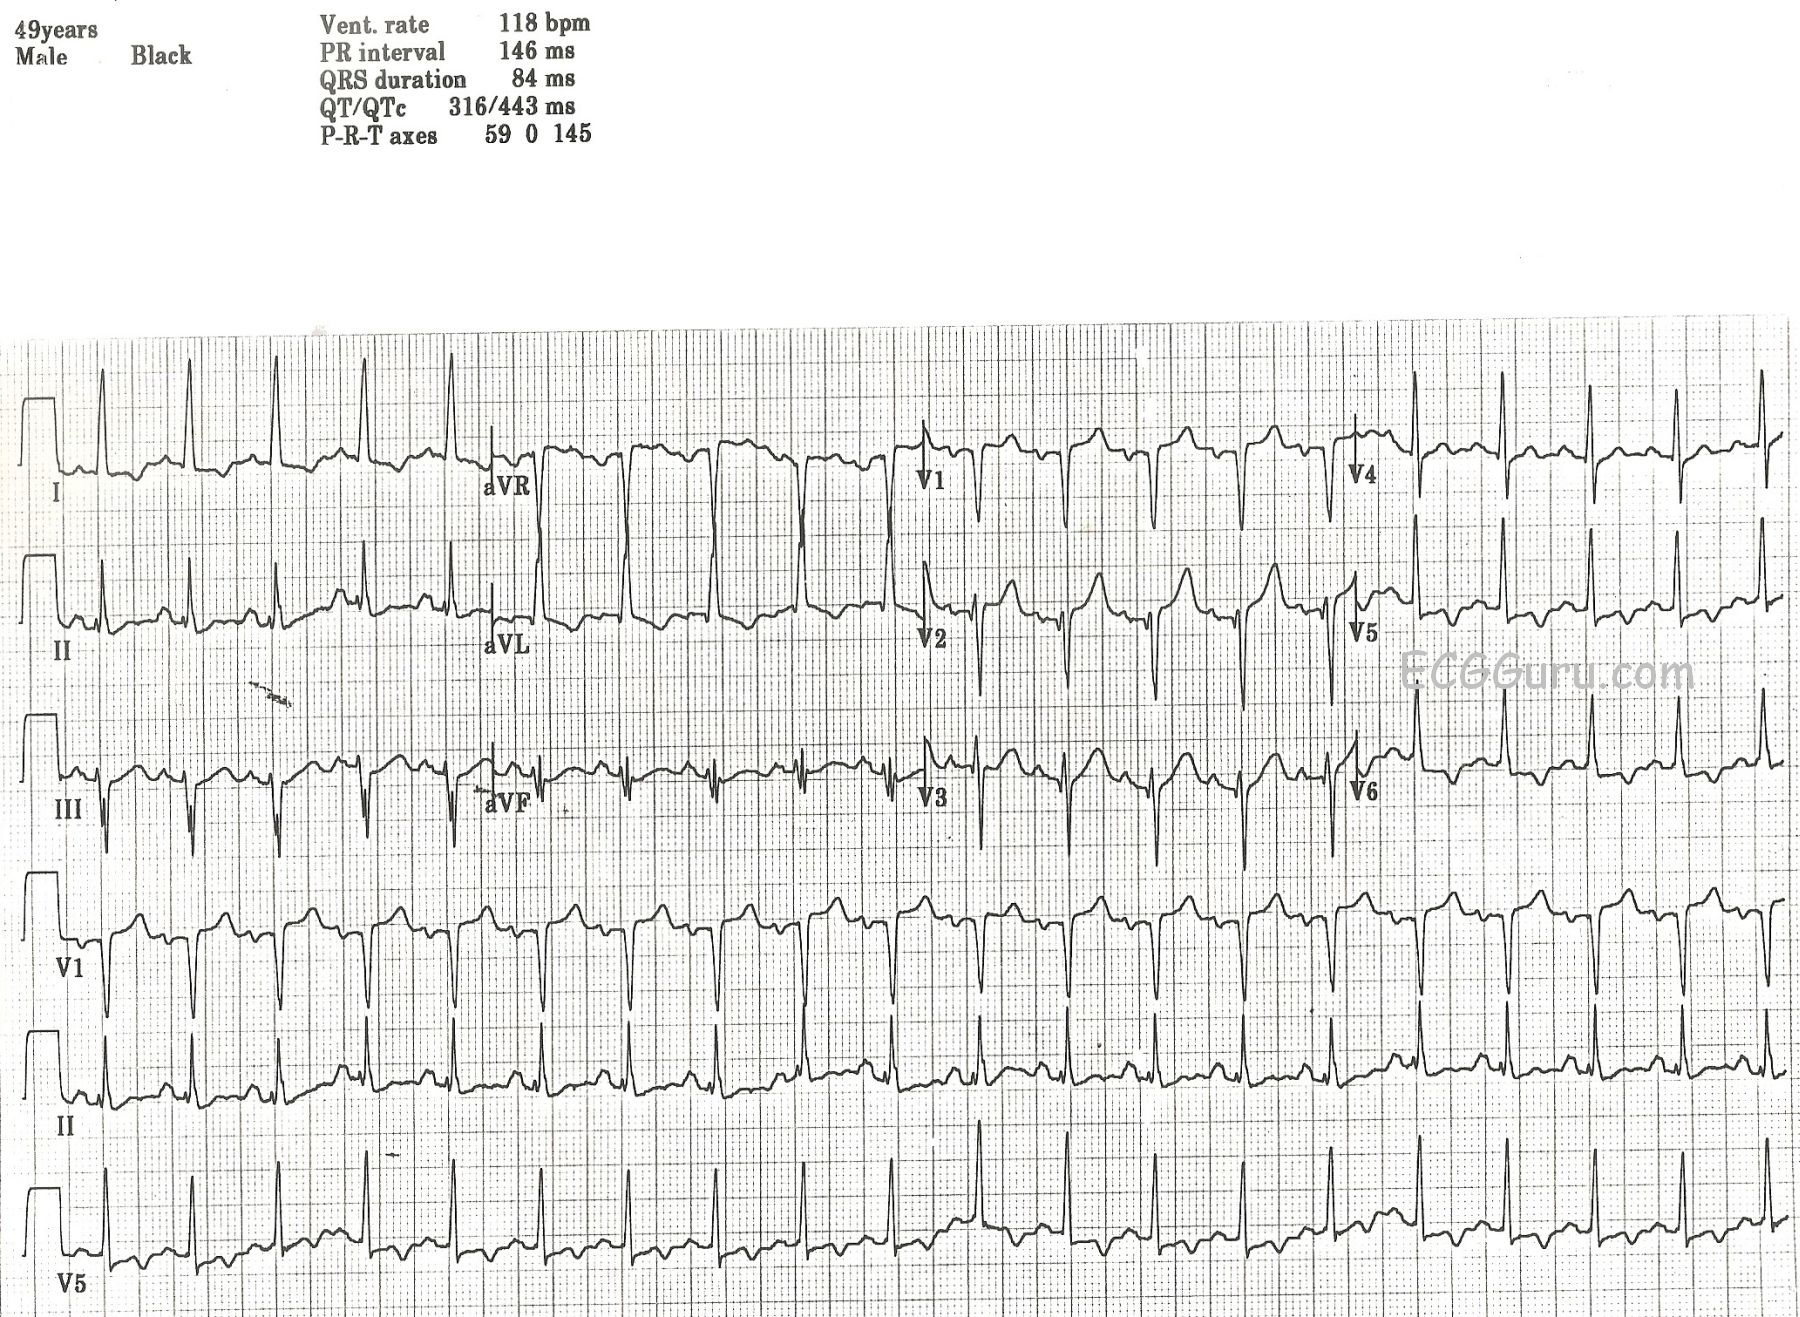
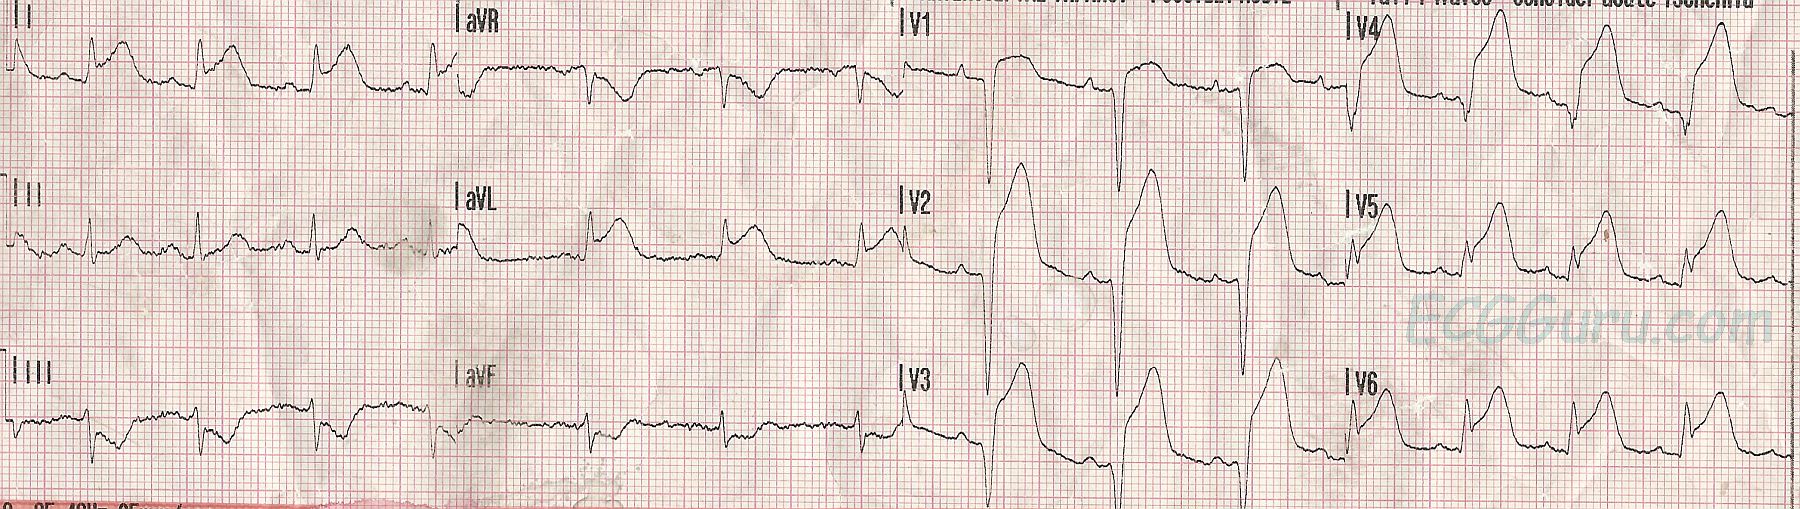
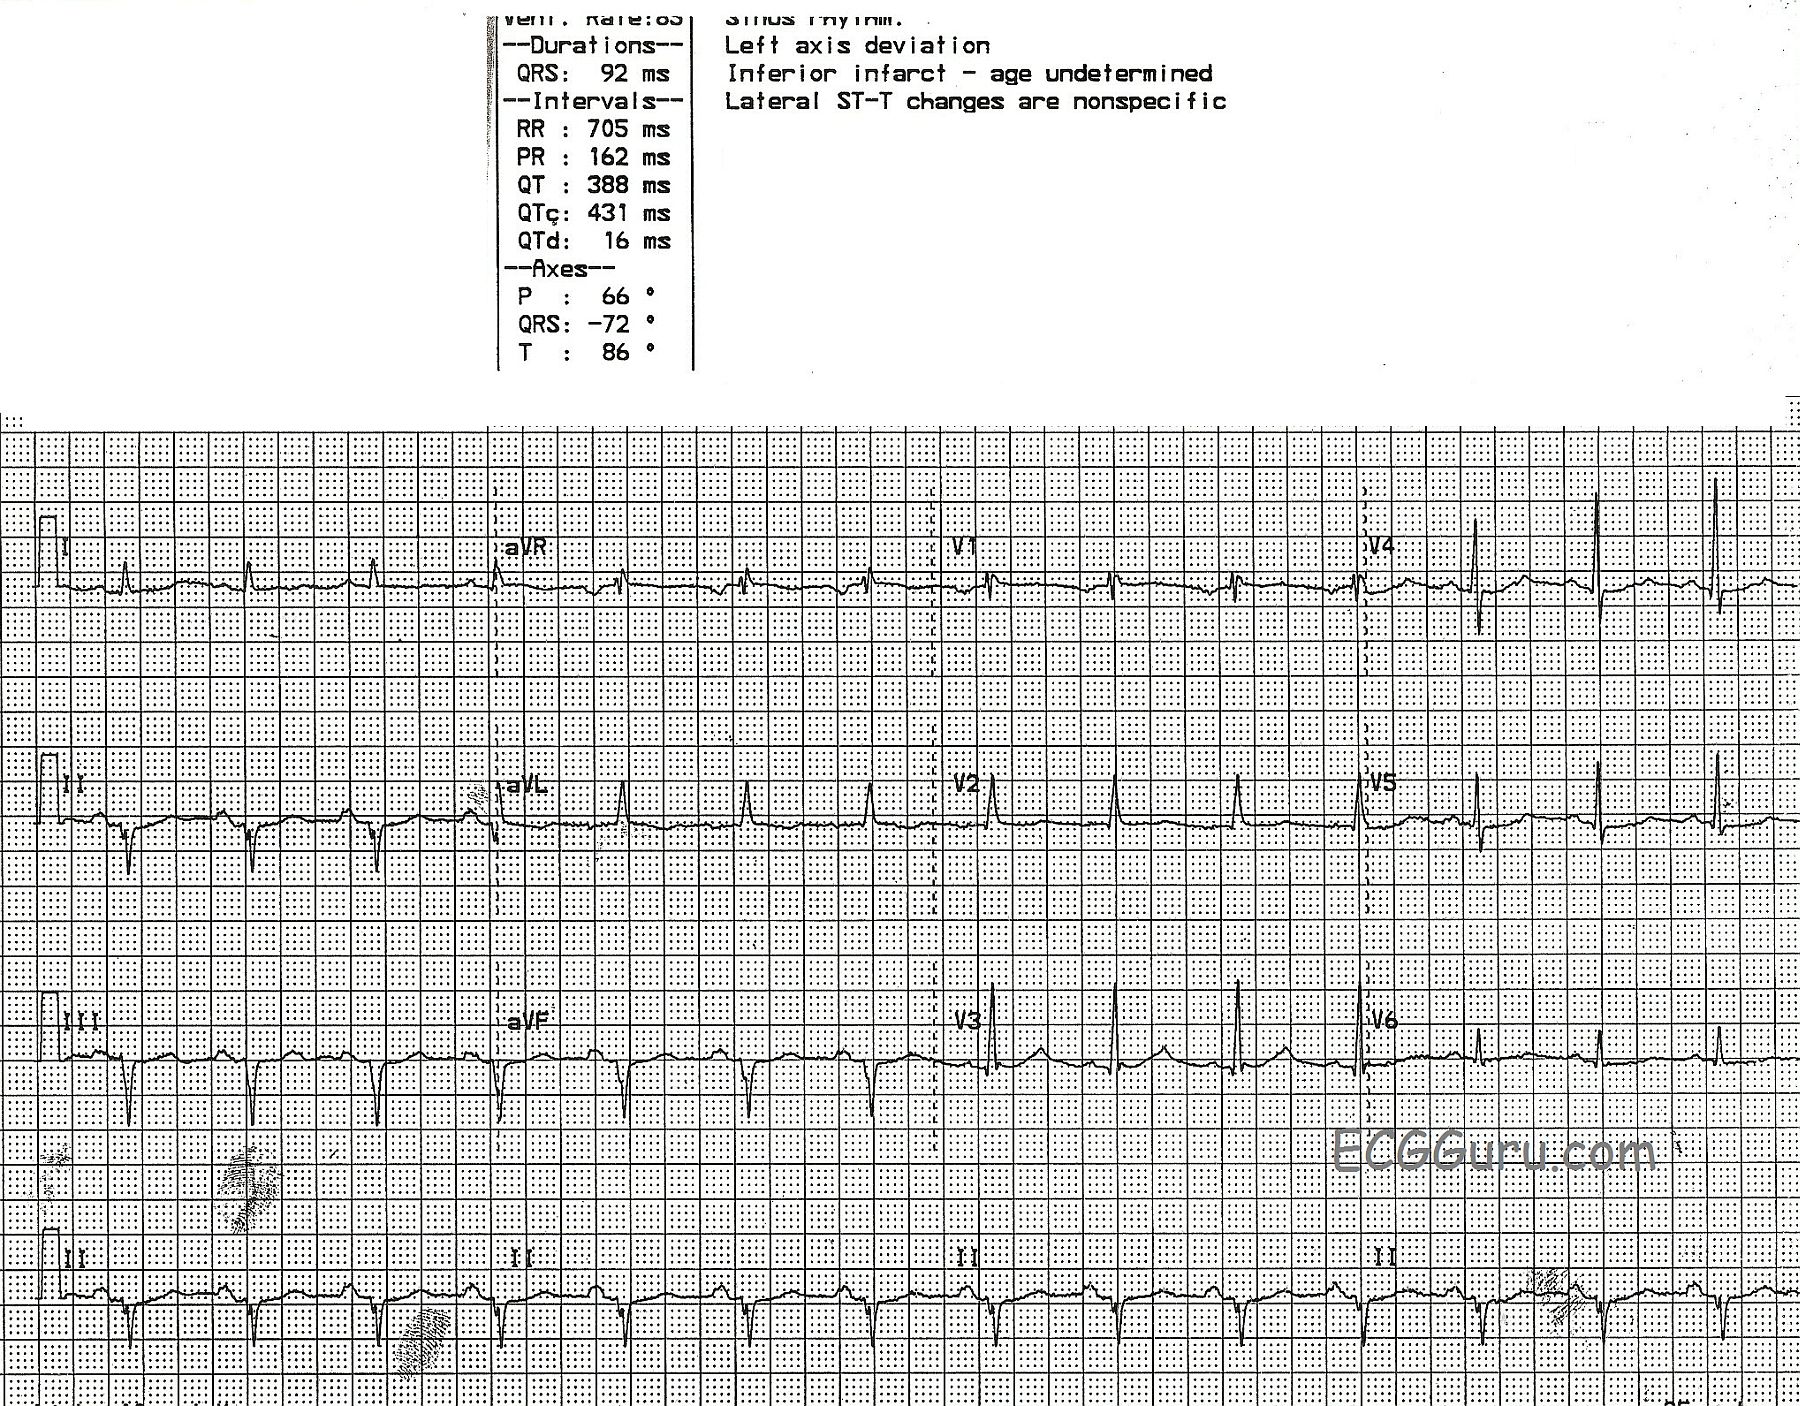
This ECG was obtained from a 49-year-old man who was a patient in an Emergency Dept.  We do not know his presenting complaint, only that he had a history of insulin-dependent diabetes mellitus (IDDM).  It was noted by the donor of the ECG that the patient had no chest pain, no shortness of breath, and no other cardiac symptoms.  We do not know his hydration or electrolyte status.  There are quite a few interesting abnormalities on this ECG, and the exact interpretation would, of course, depend upon the patient's clinical status.  It would definitely help to be there!

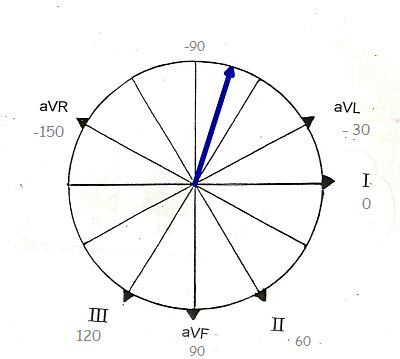
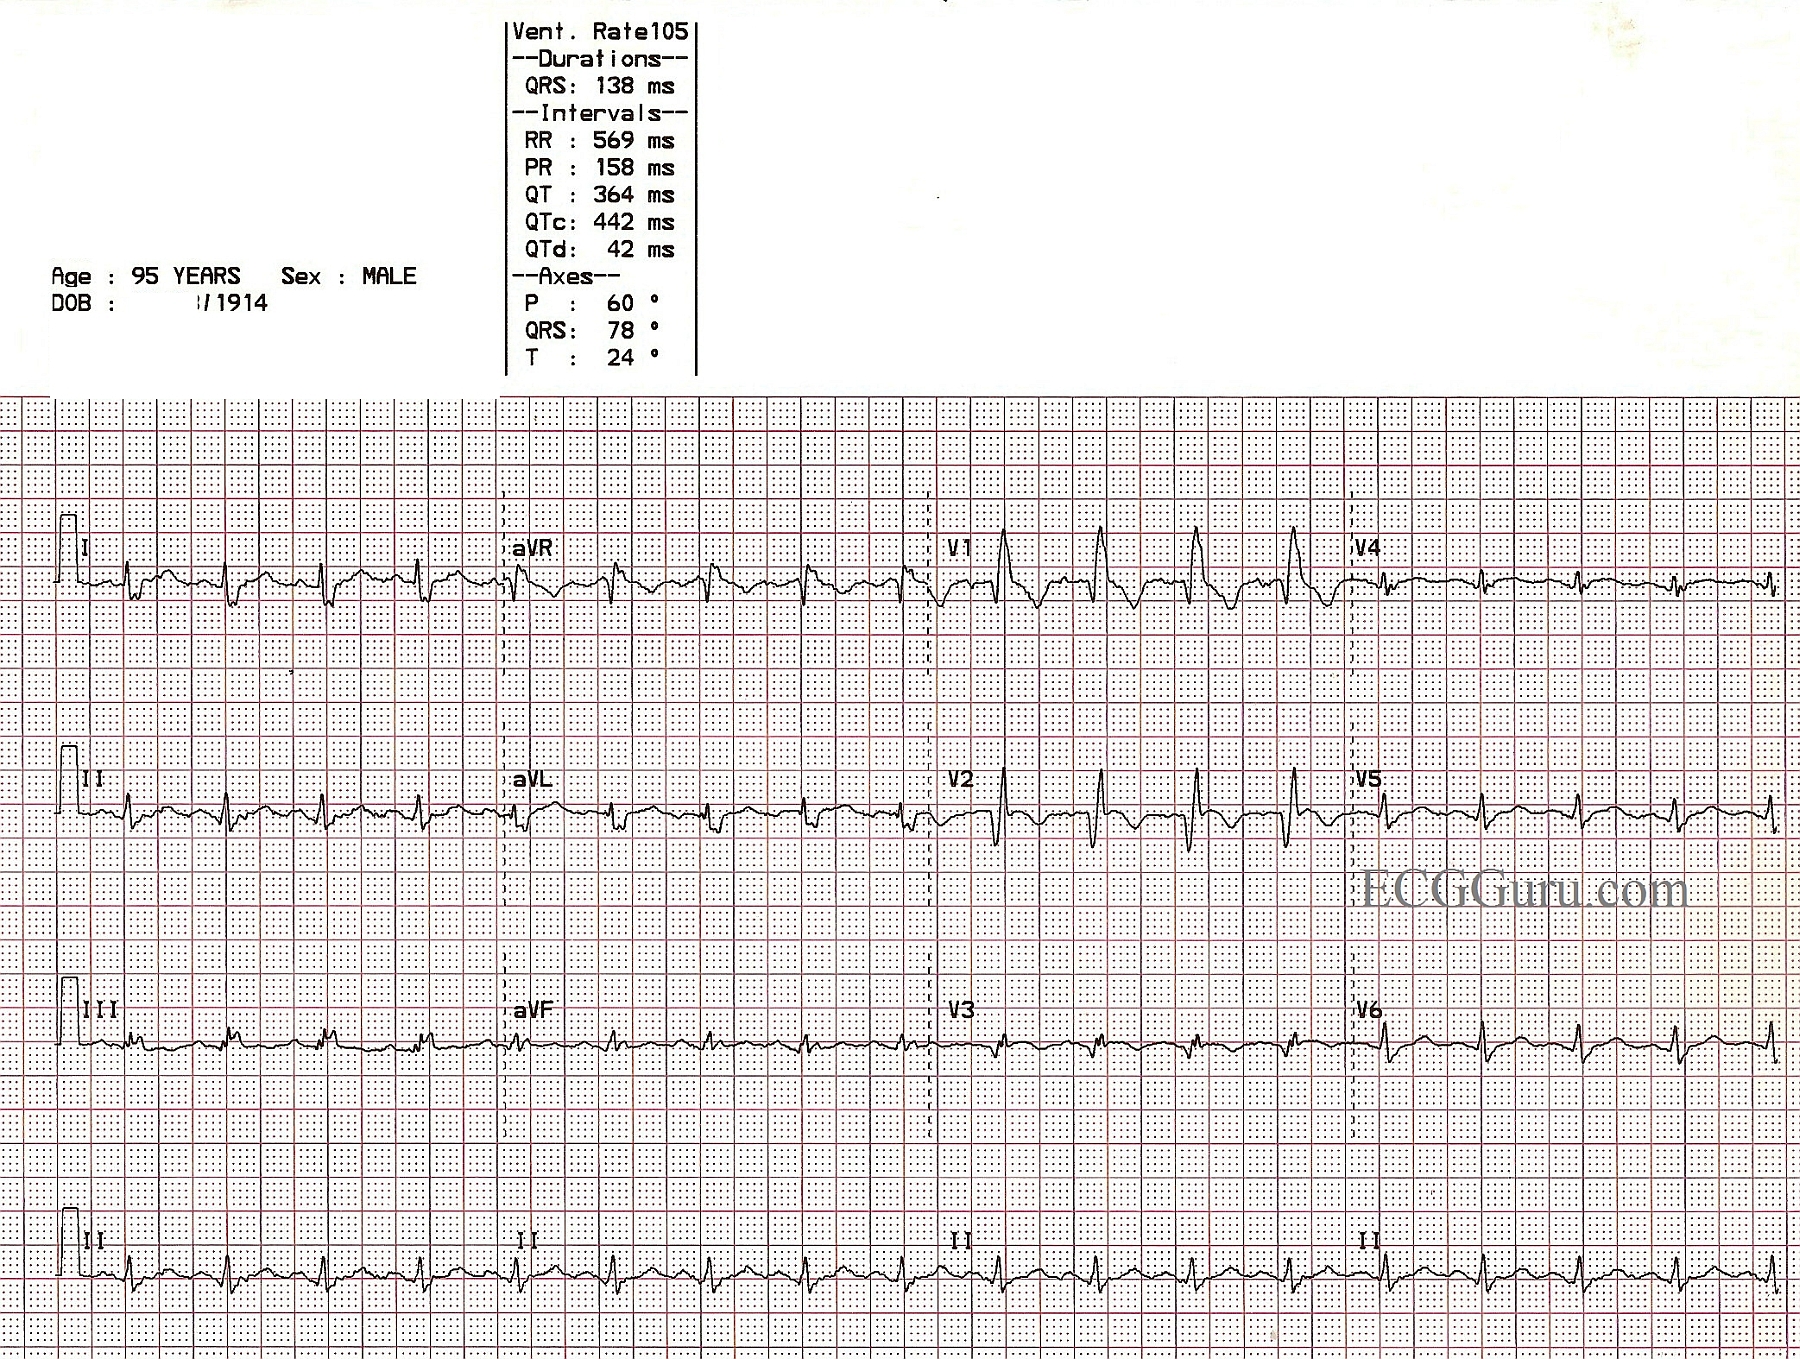
First, we note a sinus tachycardia at a rate of 118 bpm.  This could be due to very many causes, including but not limited to:  dehydration, pain, anxiety, high or low blood glucose, fever, or CHF.  The PR and QT intervals are within normal limits.  The QRS complexes are narrow.  The axis is normal at 0 degrees.  The QRS voltage in the lateral leads is on the high side of normal, but we do not know this patient's body type.  Voltage as read by the ECG can be influenced by a thin chest (making voltage look larger) or a large chest (making voltage lower).

There are T wave abnormalities in the lateral leads:  I, aVL, V5 and V6.  The T waves are inverted, which can have many meanings.  However, when inverted T waves are in the lateral leads, as opposed to the inferior or right chest leads, it is often a sign of ischemia.  The flat, horizontal ST segments can also signify coronary artery disease (CAD).  This patient denied cardiac symptoms, but his age and history of IDDM make it probably that CAD is a factor.  The leads with T wave inversion also have a small amount of ST segment depression.  The right precordial leads, V1 and V2, have a small amount of ST elevation,  This possibly represents a reciprocal change to the ST depression in V5 and V6.

Because we are not at the bedside of this patient, there are many details we do not know.  But these inverted T waves could be ischemic T waves, and this requires that the patient be further evaluated.

As always, we welcome comments, as this ECG probably has more to say!


REFERENCES:  Dr. Ken Grauer,  Life In The Fast Lane, World Journal of Cardiology 

Dawn's picture

Extensive Anterior Wall M.I. With Recent Inferior Wall M.I.

This 88-year-old woman was brought to the Emergency Department in cardiogenic shock.  Very little is known of her past medical history, but it was relayed to the EMS responders that she had been ill for about four days, when she became much worse.

This ECG shows a large, acute anterio-lateral wall M.I., as evidenced by the ST ELEVATIONS in V2 through V6, Leads I and aVL.  To make matters worse, there are PATHOLOGICAL Q WAVES in Leads V2 through V6.  Pathological Q waves indicate areas of necrosis.  Because the myocardium facing the positive electrode is not electrically active, we "see through" the dead tissue to the myocardium on the opposite side of the heart.  Pathological Q waves could be thought of as "reciprocal R waves".  This represents a great deal of dead myocardium, which will be akinetic - not moving.

To make matters worse, she has pathological Q waves in the INFERIOR WALL as well, in Leads II, III, and aVF.  Her ST segments in those leads are flattened and possibly slightly elevated, but not much.  There are no reciprocal ST depressions in I and aVL, because they are affected by the anterior - lateral wall M.I., and are elevated.

The accompanying photos show her left coronary artery angiogram indicating severe coronary artery disease and a "missing" left anterior descending artery.  This is due to a proximal lesion that occurred around the area of the first diagonal artery, cutting off blood flow to a very large part of her anterior-lateral wall.  The photo of the right coronary artery shows a very tight lesion which is allowing some blood to pass.  The Interventionalist felt that this represented a resolving 100% occlusion (remember, she had been sick for four days).  As the blood clot broke up, blood flowed again, lowering the ST segments.  Unfortunately, permanent damage had already been done, and she had Q waves in the inferior wall also.  This leaves very little of her heart beating, and it is easy to understand why she presented in shock.  She suffered cardiac arrests several times during the procedure, and was managed with a balloon pump and ventilator.

Unfortunately, this type of injury is not survivable, and she died in the CVICU a few hours after her procedure. She contributes to our education by demonstrating the cumulative effects of M.I., especially when permanent damage occurs.  For a look at her ventriculogram, to understand the devastating effects of these injuries, go to our You Tube channel.

Dawn's picture

Acute Anterior-Lateral Wall M.I.

This week's ECG is from a 47-year-old man who experienced a sudden onset of chest pain while mowing his lawn.  He went on to suffer a cardiac arrest and was resuscitated.  We do not have long-term followup on his outcome.

The experienced person will have no difficulty identifying a large acute antero-lateral wall M.I.  There are massive ST segment elevations in Leads V1 through V6, reflecting acute injury from the septal side of the anterior wall (patient's right) to the anterior-lateral wall (patient's left).  There are also ST elevations in Leads I and aVL, reflecting the high lateral wall.  This indicates, and was confirmed in the cath lab, that the lesion is proximal - at or above the bifurcation of the left anterior descending artery and the circumflex artery.  The ST depressions in the inferior wall leads (II, III, and aVF) likely represent reciprocal changes.  You will note that the ST depression in Lead III has a very similar shape to the ST elevation in Lead aVL.

More bad news for this patient is the presence of pathological Q waves in Leads V1 through V4, reflecting transmural death of the myocardial tissue.  This causes akinesis and poor left ventricular function.  In addition, it's not only muscle tissue that dies, but also electrical structures , such as bundle branches.   Papillary muscles can be infarcted, causing valve malfunction.  And remember, all patients who have ST elevation due to acute injury are vulnerable to ventricular tachycardia and ventricular fibrillation, due to re-entry mechanisms in injured tissue.   

This ECG will allow instructors to discuss with their students:

*  which leads reflect changes from which parts of the heart

*  what the ECG signs of acute M.I. are

*  the pathophysiology of pathological Q waves

*  the effect of damage to various parts of the heart on the patient's condition and symptoms

This "classic" M.I. pattern should be taught to all health care professionals who work in settings where ECG is used.

Dawn's picture

Previous Inferior Wall M.I. and Left Axis Deviaton

If you are teaching frontal plane axis to your students, you will need to teach them HOW to determine the axis - usually beginning with the QRS axis and then adding the P and T waves.  But, you also need to teach them WHY we measure axis, to provide relevance to something that may seem challenging to beginners.  There are many ECG interpretations that rely heavily or are dependent upon the determination of the axis.  

This ECG is a great example of left axis deviation.  The cause is readily discernible, if your students know the ECG signs of myocardial infarction. This patient had an inferior wall M.I. in the distant past, and now has pathological Q waves in Leads II, III, and aVF.  Pathological Q waves in related leads in a patient with history of M.I. are a sign of necrosis, or permanent damage, in that part of the heart.  The inferior wall has lost an extensive amount of tissue, which is now electrically inactive as well as mechanically inactive.  (You may also find it helpful to show students videos of ventriculograms showing normal LV function and hypokinesis of the LV due to M.I.)  Because of the loss of electrical activity in the inferior wall, the "mean" electrical direction (or axis) is AWAY from the inferior wall.  That is, the electricity travels AWAY from II, III, and aVF and TOWARD I and aVL.

Many of the blogs and webpages listed in our "Favorites" address the subject of axis determination.  Here is one from Cardio Rhythms Online if you would like a review.


Dawn's picture

Recent Anterior-Septal Wall M.I. With Right Bundle Branch Block

This is an ECG from a 95 year old man who was recovering from an anterior-septal wall M.I.  Other clinical data for this patient has been lost, except that he suffered a new right bundle branch block during this M.I.  The ECG shows pathological Q waves in V1, V2, and V3, consistent with permanent damage (necrosis) in the anterior septal wall.  The ST segments in those leads are coved upward.  Even though the J points are not elevated, this ST segment shape suggests recent injury.  The classic RBBB pattern is present:  wide QRS, rSR' pattern in V1, and wide little s waves in I and V6.  It is not known why the overall voltage is low in this patient.

Pages

All our content is FREE & COPYRIGHT FREE for non-commercial use

Please be courteous and leave any watermark or author attribution on content you reproduce.