Displaying 1 - 9 of 9
Dawn's picture

Complete Heart Block With Impending Ventricular Standstill


The Patient         This ECG was obtained from a 76-year-old woman who had just lost responsiveness while under care of an EMS crew. This tracing was obtained before a trans-cutaneous pacemaker was applied.

The ECG              The most noticeable feature of this ECG is the extremely slow rate. In fact, there are only two QRS complexes visible. The P waves are regular at a rate of about 145 bpm, so the underlying rhythm is sinus tachycardia.  NONE of the P waves are conducted, as evidenced by the different “PR intervals” in the two QRS complexes seen.  This is complete heart block at it’s most extreme – the QRS complexes represent a very insufficient escape rhythm.  A pacemaker is the only immediate treatment for this rhythm. Unfortunately, we don’t know the outcome for this patient.

It is very difficult to make judgements about the QRS complexes with only two of them, visible in three leads each.  The first set show the criteria for left ventricular hypertrophy.  The QRS in aVL is 20 mm tall, and anything over 11 mm meets voltage criteria for LVH.  In addition, the ST segments have the “strain” pattern, another sign of LVH.  The second QRS complexes are not typical of a normal ECG or one with LVH.  We cannot vouch for the precordial lead placement.

There is some disagreement in the literature regarding the naming of the blocks. Some consider “high-grade” to be only second-degree AVB with two or more consecutive non-conducted P waves. Others include third-degree AVB in the “high-grade” category.  It can come down to just semantics – the RATE and how the patient responds to the rate is the primary consideration.  Classification as to the origin of the block is helpful when determining the best long-term treatment decisions.

This is a good ECG for teaching the concept of AV dissociation, and how dangerous third-degree AV blocks and high-grade second-degree AV blocks can be.  


Dawn's picture

Catastrophic Event With Bradycardia

The Patient:    Paramedics were summoned to the home of a 74-year-old woman who had a complaint of shortness of breath.  She was found sitting, alert and oriented, with labored respirations at 30/min. She stated that the shortness of breath came on suddenly. She denied any cardiac or pulmonary medical history, and said she took no medications. The patient was ambulatory.  Her skin was cool and moist.  Her SpO2 on room air was 85%, improving to 90% on oxygen via 15 lpm non-rebreather mask.  Her lungs sounded clear.


When the patient was moved to the transport vehicle, she suddenly became nonverbal, with a leftward gaze. Her pupils were noted to be unequal and non-reactive (we do not know which was larger).  Her BP was 67/43.


During transport, her heart rate declined into the 20’s and became apneic and pulseless.  Recorded BP was 46/25. CPR was done until and after arrival at the hospital, where efforts to resuscitate were halted after some time.


Dawn's picture

An Irregular Bradycardia

Thank you to Alikuni Kllany from Toronto for donating these ECGs.  They are from a 59-year-old man who has a history of hypertension and depression.  Last year, he was on atenolol when he experienced a brief syncopal episode and bradycardia. He was taken off atenolol and started on amlodipine 5 mg.  He also takes ramipril 10 mg, atorvastatin 40 mg, and tamsulosin .4 mg.  He continues to have bradycardia and dizziness. 

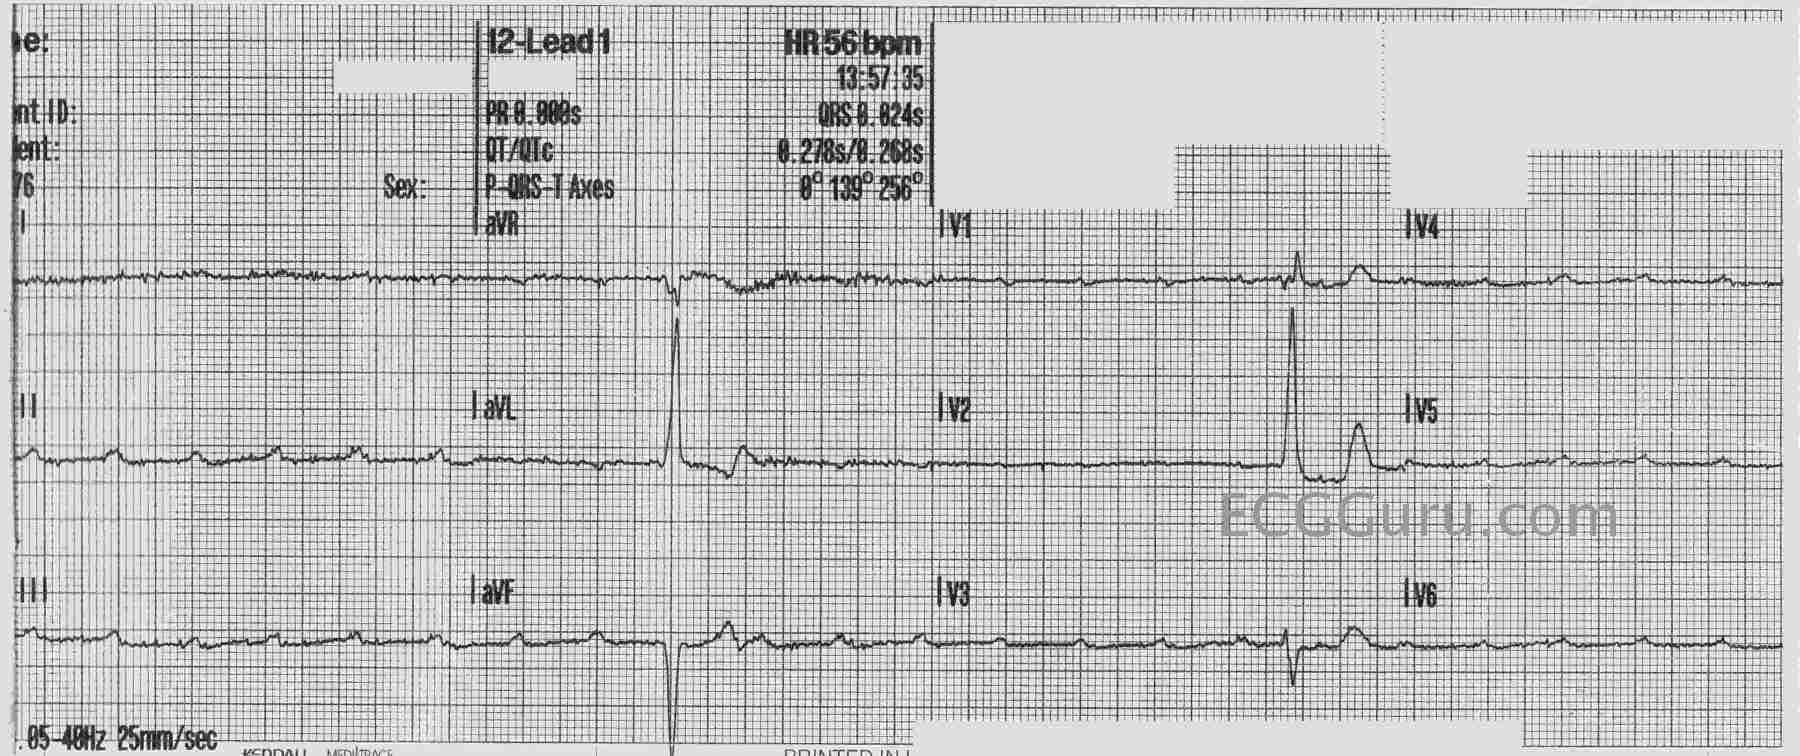
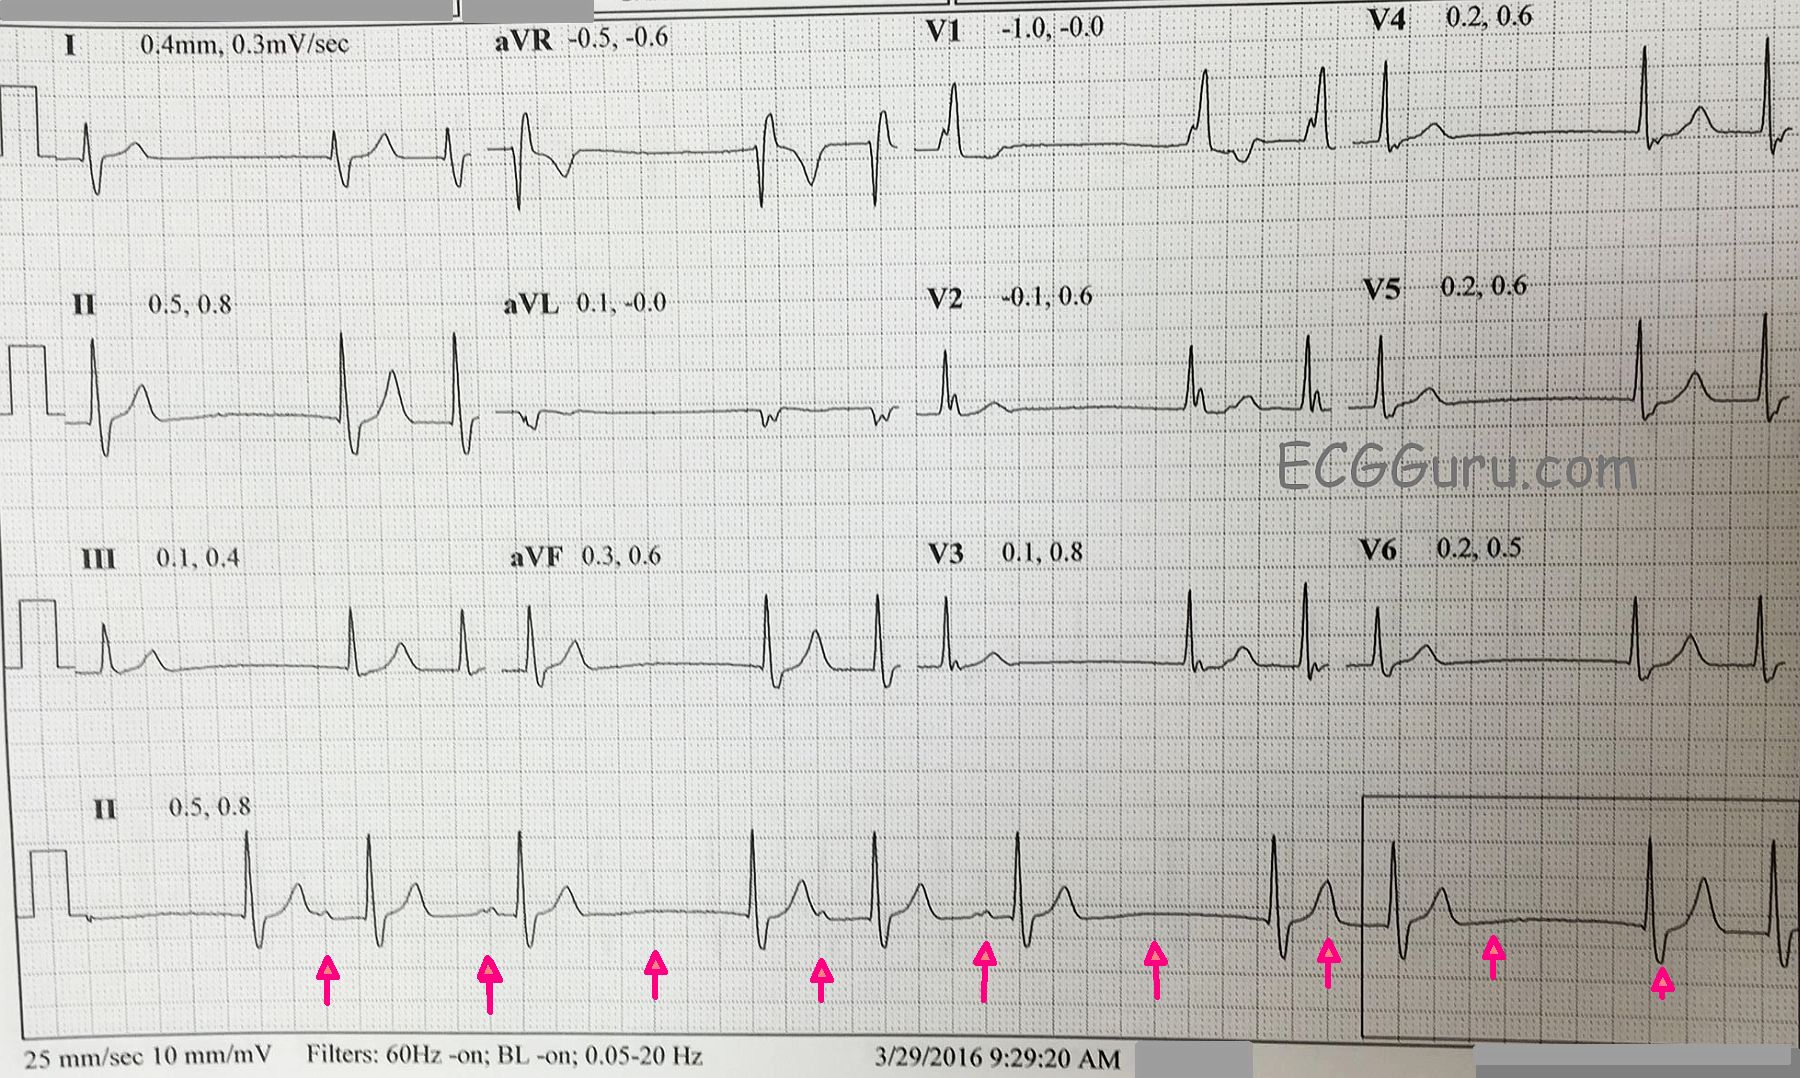
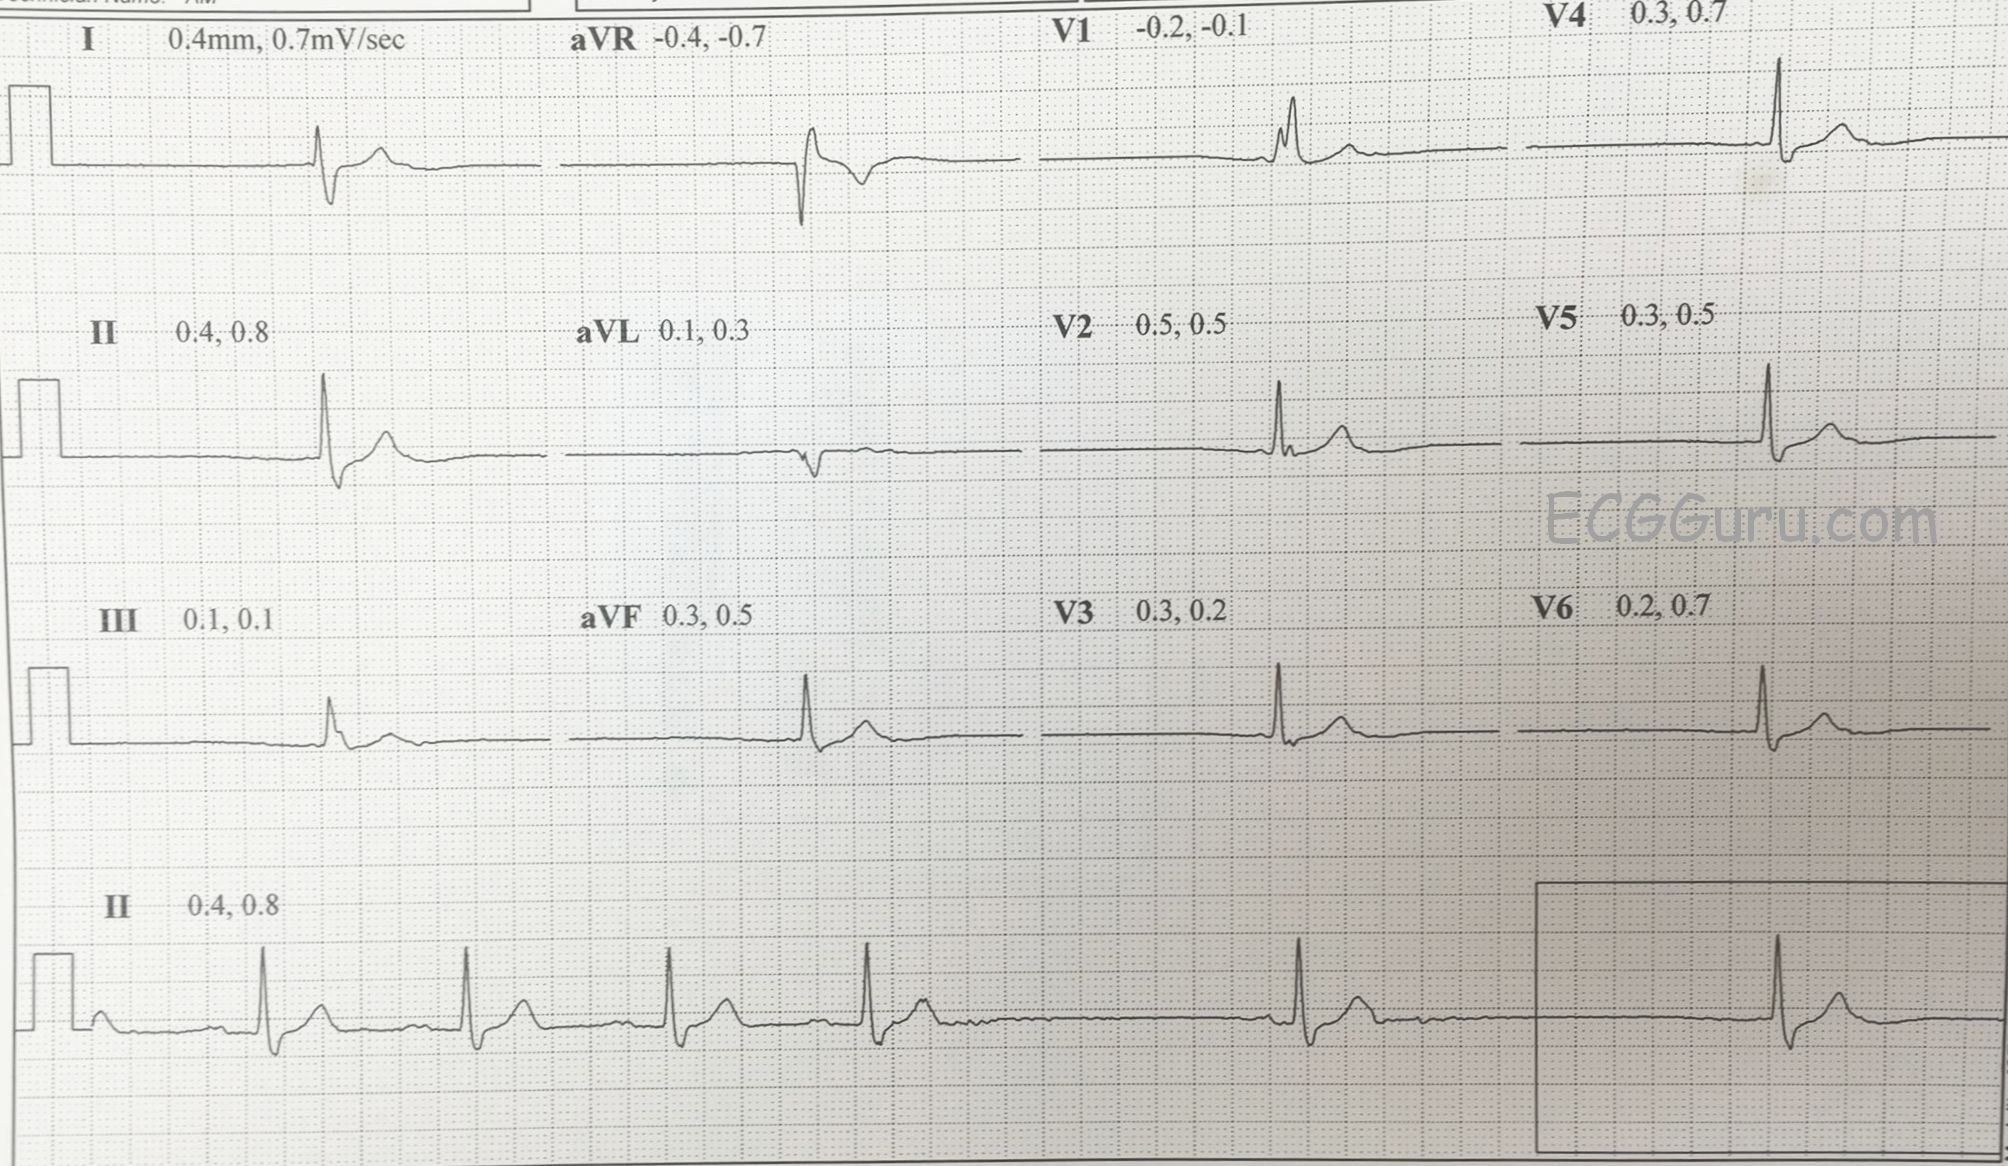
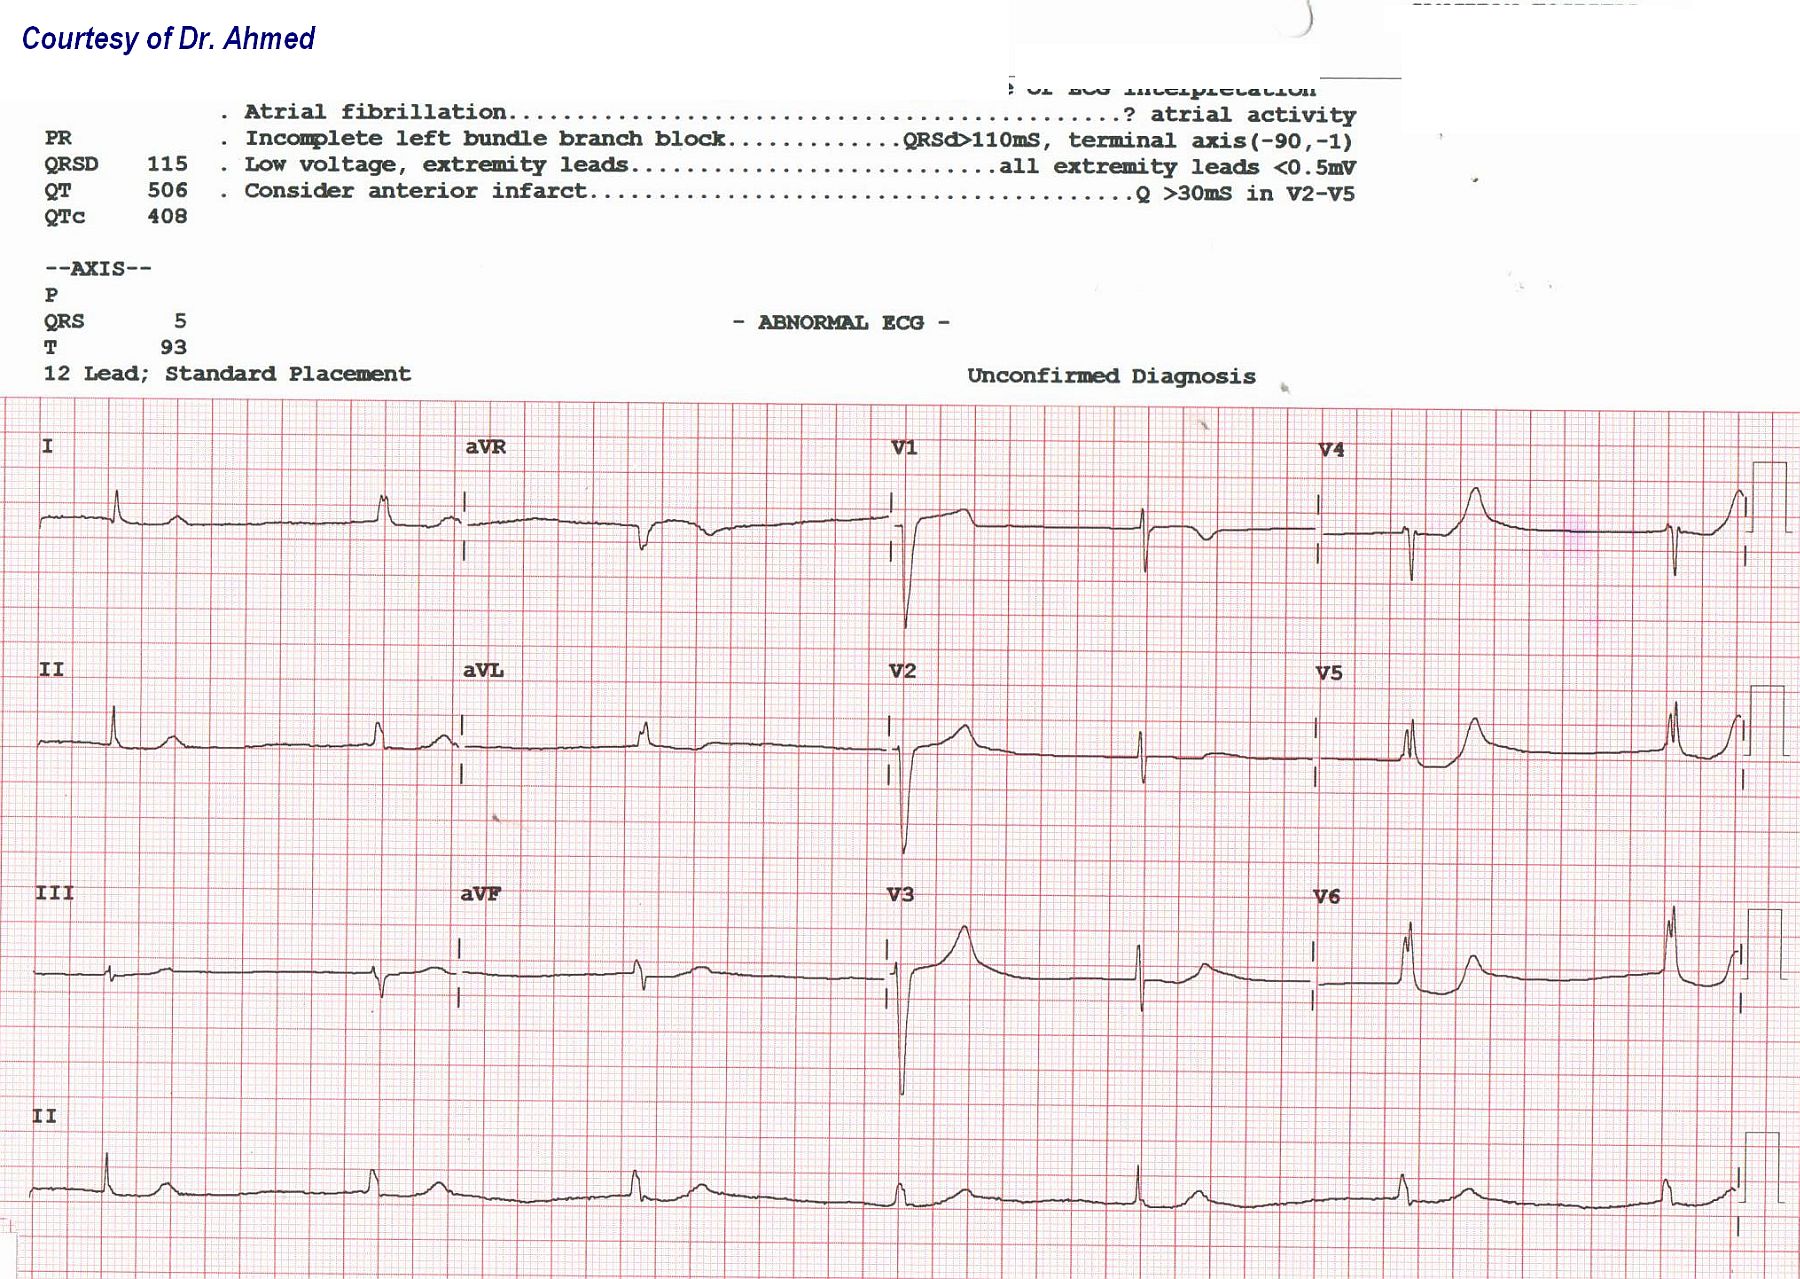
The first ECG shows grouped beating, with repetitive groups of two and three complexes.  The P waves are very small, and hard to evaluate.  The best place to see them is in the Lead II rhythm strip at the bottom.  The rhythm strip is not run concurrently with the 12-Lead, making it even more difficult to evaluate P wave morphology. 

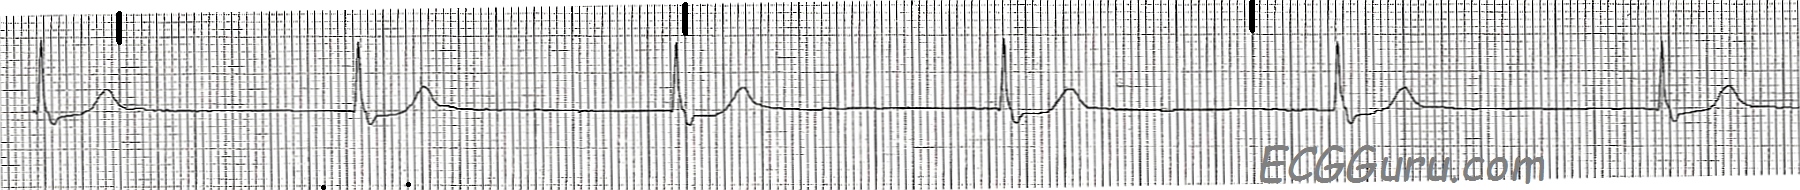
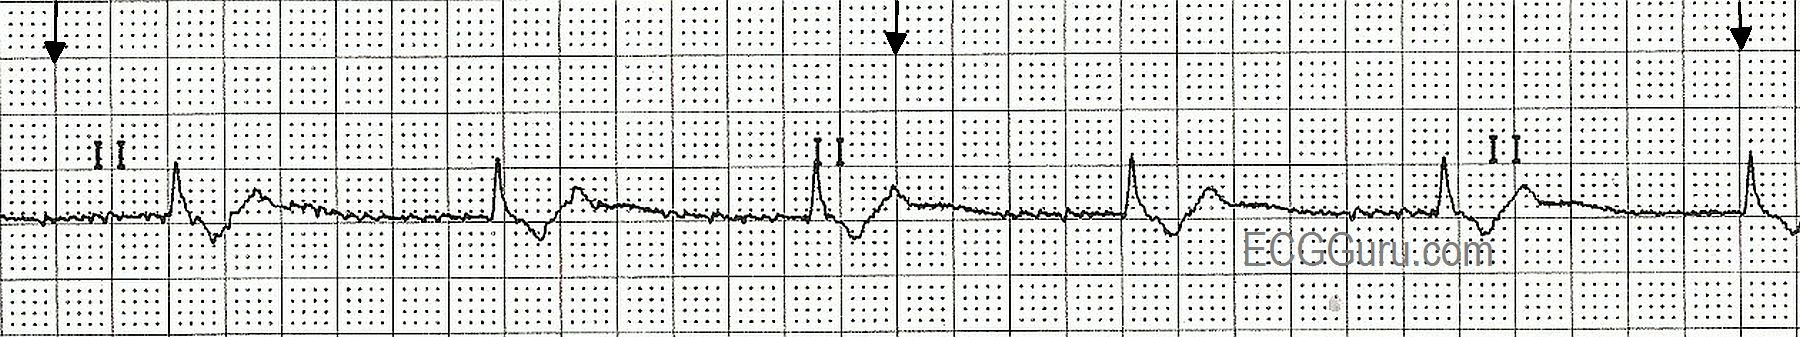
The beats that begin the groups also END a pause.  These are junctional escape beats.  After the junctional escape beats, the PR intervals vary.  This can be explained by RP / PR reciprocity, first described by Mobitz.  He demonstrated that the RP interval can affect the next PR interval. Longer RP intervals (slower rate) cause PR shortening.  Shorter RP intervals equal longer PR intervals.  The P waves are so small, it is difficult to determine whether there is a P wave in the last T wave of each group, which would indicate non-conducted PACs.  So, we are left with a sinus pause or sinus exit block (suggested by the timing of the first six beats.  We have used red arrows to suggest where the sinus node probably fired.  P waves indicate conduction, of course.  Lack of P waves, the impulse failed to exit the sinus node. 

There are many mechanisms by which grouped beating can occur.  Second-degree AVB, Type I (Wenckebach) comes to mind first.  That rhythm in it’s pure form would have a regular sinus rhythm underlying it.   Escape-capture bigeminy often occurs with slow rates and junctional escapes, but does not by itself cause “trigeminy”.  Sick sinus syndrome can cause all types of chaos in the rhythm. 

Dawn's picture

ECG Basics: Junctional Rhythm

This is an example of a junctional rhythm that is slower than what is considered "intrinsic rate" for the junction.  The rate is around 30 bpm.  We know this is a "supraventricular" rhythm because of the narrow QRS.  Junctional beats travel to the ventricles via the bundle branches, which provides very fast conduction, resulting in a narrow QRS complex.  The P waves can be seen at the end of each QRS.  They are upside-down in this Lead II rhythm strip, indicating retrograde conduction from the junctional pacemaker to the atria.

Clinically, the important thing when we encounter such a slow rate is to evaluate the patient's response to the rate.  If the patient is hypoperfused (pale, decreased level of consciousness, low BP), we need to act to increase the rate, regardless of the cause of the bradycardia.

Dawn's picture

Acute Inferior Wall M.I.

Another great ECG donated by Paramedic Eric Testerman.  This ECG is from a 66 year old man who was complaining of feeling dizzy, weak, and of having "minor" chest pain. He was extremely pale/ashen, had moderate cyanosis, and was very clammy and diaphoretic.  His initial heart rate was about 20 bpm.  His initial BP was 131/113 then, just before arrival at the hospital was 127/85. His HR increased to about 50 bpm (not shown). He was given 400 ml I.V. fluid, 324 gr of aspirin, and oxygen.  Transcutaneous defibrillator/pacemaker pads were applied. 

At the hospital, he was successfully treated with angioplasty for a 100% occlusion of the right coronary artery. The time from beginning of treatment to reperfusion of the artery was 47 minutes, which is very good! 

This is a "classic" inferior wall M.I., with ST elevation in leads II, III, and aVF. There are reciprocal ST depressions in I and aVL.  There are also ST depressions in V1 through V5.  This is generally considered to represent reciprocal ST changes in the posterior and lateral walls.There is a quite severe bradycardia, and the patient's skin showed signs of poor perfusion. Amazingly, the patient's BP stayed adequate during transport.  Bradycardia is common in inferior wall M.I. due to ischemic effects on the SA node and vagus nerve (sinus bradycardia) and the AV node (heart block).  In this case, the rhythm is sinus bradycardia.  The heart rate is in the 20's, and the PR interval is around .20 - .22 seconds. 

Dawn's picture

ECG Basics: Junctional Rhythm

This rhythm strip illustrates a junctional escape rhythm.  The sinus rhythm has slowed or stopped, and the junctional tissue has taken over as the pacemaker of the heart.  The "junction" is loosely defined as the area between the AV node and the Bundle of His.  The intrinsic rate of the pacemaking tissue in this area is 40 - 60 beats per minute.  This slow rate is usually overridden by the sinus node, and the junction is not allowed to express itself as a pacemaker.  Should the sinus node fail or fall below the junctional rate, the junction "escapes" and takes control of the heart.  The QRS complex in junctional rhythm will normally be narrow, because the impulse follows the bundle branches down through the ventricles in a normal fashion, resulting in quick and normal ventricular depolarization.  If the QRS complex is wide in a junctional rhythm, there is another, separate cause, such as bundle branch block.

 If the junctional impulse is able to penetrate the AV node and depolarlize the atria, the P wave will be deflected downward in Leads II, III, and aVF, as the impulse is travelling in a retrograde direction (backward).  The P wave could end up slightly before the QRS, during the QRS, or after the QRS. In this strip, the P waves are seen after the QRS complexes.

Dawn's picture

ECG Challenge From Dr. Ahmed - Patient With Hyperkalemia

This ECG was kindly donated to the ECG Guru website by Dr. Ahmed for open discussion among our members.  The patient was a 70+ year-old man who presented with a complaint of dizziness.  His serum potassium level was found to be 6.5 (normal is 3.5 - 5.0).  Upon correction of his K levels, his rhythm was atrial fibrillation at 130 / min.

WHAT DO YOU THINK ABOUT THIS INITIAL ECG?  What is causing the slow rate? Is there atrial activity?  Do you see QRS morphology changes?  What about the anterior ST and T wave changes? 

We look forward to hearing from our members!  And thanks to Dr. Ahmed for donating this interesting ECG.


Dawn's picture

Right Bundle Branch Block With Atypical QRS in V1 and LAFB or Ventricular Rhythm???

This is quite an interesting ECG, and the ECG Guru would love to hear what you think about it.  What we do know is that it is a wide-complex bradycardia in a patient for whom we have no clinical data, except that she is a 51 year old female.  The rhythm is probably junctional, as no P waves are seen and the rhythm is regular.  The rate of 63 per minute would be consistent with that. Interestingly, no disassociated sinus P waves are seen.  All slow wide-complex rhythms should be evaluated for idioventricular origin, or AIVR.  The QRS in V1 shows an atypical right bundle branch block pattern.  We usually look for rSR', or "bunny ears",  but  this ECG shows an upright R wave with a smaller, slurred r wave before it.  What makes this look like RBBB is the prominent wide little S wave in V6 and in Lead I.  We question the R wave progression, too.  Do you think it is possible that the electrodes for V2 and V3 are switched?  The axis is leftward, causing Lead II to be nearly biphasic - it represents a synthesis of what is seen in Leads I and III.  This is enough left axis shift to diagnose a left anterior fascicular block (with RBBB = bifascicular block). 

This is a great ECG, and we can't wait to hear from all you ECG Gurus out there. Maybe we will need to adjust our diagnosis after we hear from you.

Dawn's picture

Wide Complex Bradycardia in Digitalis Toxic Patient

This ECG is from a female patient who presented with weakness. Her labs revealed digitalis toxicity and hyperkalemia. Actual lab values not available. With digitalis toxicity, hypokalemia and hyperkalemia are possible. In severe hyperkalemia, the "tall peaked T waves" can become much shorter, as the QRS and T waves widen. The p waves disappear, and soon the ECG resembles a "sine" wave. This is a very serious emergency!


All our content is FREE & COPYRIGHT FREE for non-commercial use

Please be courteous and leave any watermark or author attribution on content you reproduce.