Displaying 1 - 5 of 5
Dawn's picture

Acute Anterior-lateral STEMI

The Patient:  A 60-year-old man at work. He experienced a sudden onset of substernal chest pain, nausea & vomiting, and dizziness.  He states the pain is a 5 on 1-10 scale.  No cardiac history or current medications. 

The ECGs:  The first ECG, taken at 12:30:05, shows a sinus rhythm with ventricular bigeminy. In some leads, you can see the sinus P waves hidden in the beginnings of the PVCs, so we know the underlying sinus rhythm is about 82 bpm.

There is obvious ST elevation in V1 through V5, which is the anterior wall, an area perfused by the left anterior descending artery.  Remember – the ST elevation sign may also show in the PVCs, but because ventricular beats have secondary ST changes of their own, we should assess only the sinus beats for ST changes. 

There is also obvious ST elevation in Leads I and aVL.  This is the high lateral wall, which is perfused by the circumflex and first diagonal arteries, both proximal branches of the left coronary artery.  So, the involvement of the high lateral wall indicates a proximal lesion in the LCA – not good.  Leads III and aVF have distinct ST depression – this is a reciprocal change reflecting the ST elevation in Leads I and aVL.

Dawn's picture

Acute Anterior M.I. and Ventricular Fibrillation

The Patient:   This series of ECGs is from a 65-year-old woman who was complaining of a sudden onset of chest pain, nausea, and weakness. She stated that the pain increased on inspiration.  She reported a history of non-insulin-dependent diabetes mellitus (NIDDM). 

ECG No. 1, 14:46:  This ECG includes V4Right, V8 and V9 in place of V4, V5, and V6.  The rhythm is sinus at 91 beats per minute.  The PR interval is within normal limits, as is the QRS duration.  The QTc is WNL as well.  The frontal plane axis is also WNL.  The three standard chest leads show an early transition of R waves in V2.   There are noticeable ST and T wave abnormalities:

slight ST elevation in I and aVL with ST depression in II, III, and aVF.  In chest pain, possible M.I., STD should be presumed to be reciprocal in nature.  V1 has slight STE with a coved upward (frowning) appearance.  V2 has more noticeable STE, with a tall, wide-based T wave. This is called a “hyperacute T wave”.  We will have to evaluate V4 – V6 on ECG No. 2. 

V4 Right has no ST elevation, and V8 and V9 have ST depression (reciprocal to the anterior leads).  So far, we have all the signs of acute anterior wall M.I. 

Dawn's picture

Large Anterior Wall M.I. and Effect of Lead Reversal

EDIT: Please refer to the comments below this text. The second ECG in this series shows unexpected QRS and ST-T morphology changes, which I tried to explain by way of the patient's long anterior descending coronary artery. However, Dave Richley, who is a very well-known cardiac physiologist and ECG Guru took the time to analyze these morphologies and realize they can be explained by an inadvertent ECG LEAD MISPLACEMENT. This patient does have a proximal lesion of the LAD, proven and repaired in the cath lab. But the inferior wall does not have the injury it appears to have in this second ECG. Thanks to Dave for reminding us to slow down and look closely when things don't look "right".

The Patient:   These two ECGs, taken 26 minutes apart, were obtained from a 50-year-old man who complained of sudden onset of chest pain.  He denied history of coronary artery disease. He was Covid-positive, and the rest of his medical history was unremarkable.

ECG No. 1:  This ECG was obtained by paramedics enroute to the hospital.  For your beginner-level students, it will be easy to demonstrate the large ST elevations in V3 through V6. The machine’s measurements at the bottom confirm that this ECG meets any field criteria for ST elevation M.I. “STEMI”.

But there is so much more to see! Taking a methodical approach, and starting with rate and rhythm, we see sinus bradycardia at 57 bpm. Intervals and frontal plane axis are within normal limits. R wave progression in the chest leads is stalled in V1- V3 due to loss of initial r waves (narrow QS). The transition to positive deflections in V4 – V6 is abrupt.  These q waves in the V1 and V2 appear narrow, but V3 appears to have a Q wave that is almost wide enough to be considered pathological.  Narrow Q waves may be a transient sign of injury, while wide ones (>40 ms) are an ECG sign of necrosis.

Dawn's picture

Previous Anterior Wall M.I.


If you are an instructor, or a fairly new student, you don’t always need to see “challenging” ECGs. But, you may not want to see “standard” ECGs from an arrhythmia generator, either.  Every ECG contains subtle and not, so subtle characteristics of the person it belongs to.  Take a minute to look at this ECG before reading the discussion, and ask yourself what you might surmise about the patient.

The Patient: We don’t know much about the actual patient this ECG came from.  What we do know is that he is an elderly man with a history of heart disease who was hospitalized sometime in the past with an acute M.I.  He is now on beta blocker medication and is on a diet, as he is approaching the “morbidly obese” classification.  He is now in the ER with shortness of breath and mild chest pain.  What does his ECG tell us?

Dawn's picture

Anterior Wall M.I. With Bifascicular Block

This ECG is taken from an 82-year-old man who called 911 because of chest pain.  He has an unspecified “cardiac” history, but we do not know the specifics. 

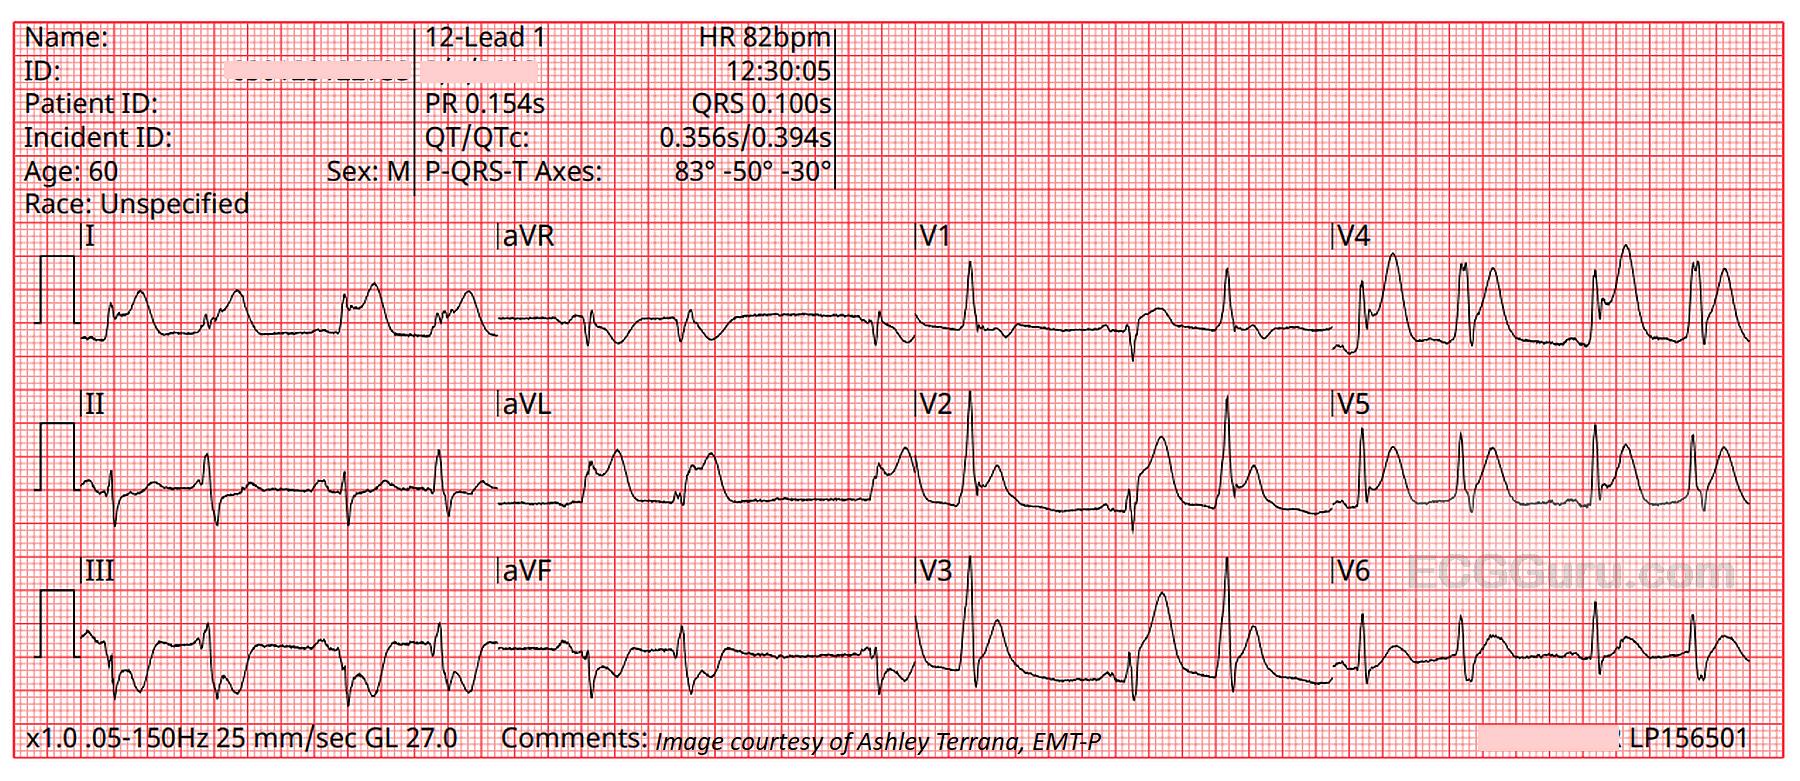
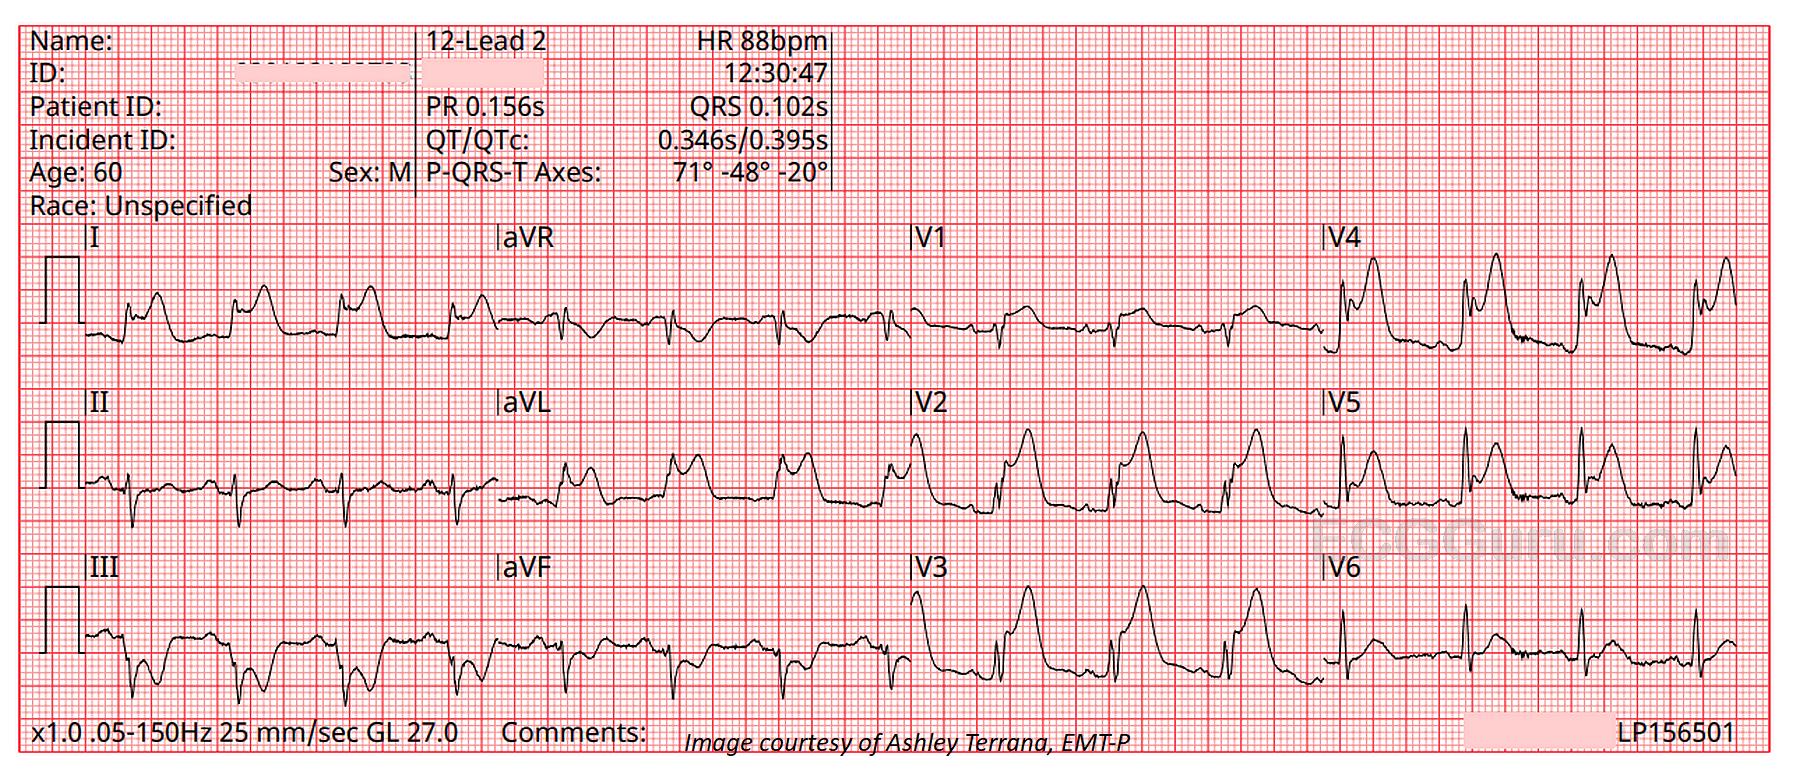
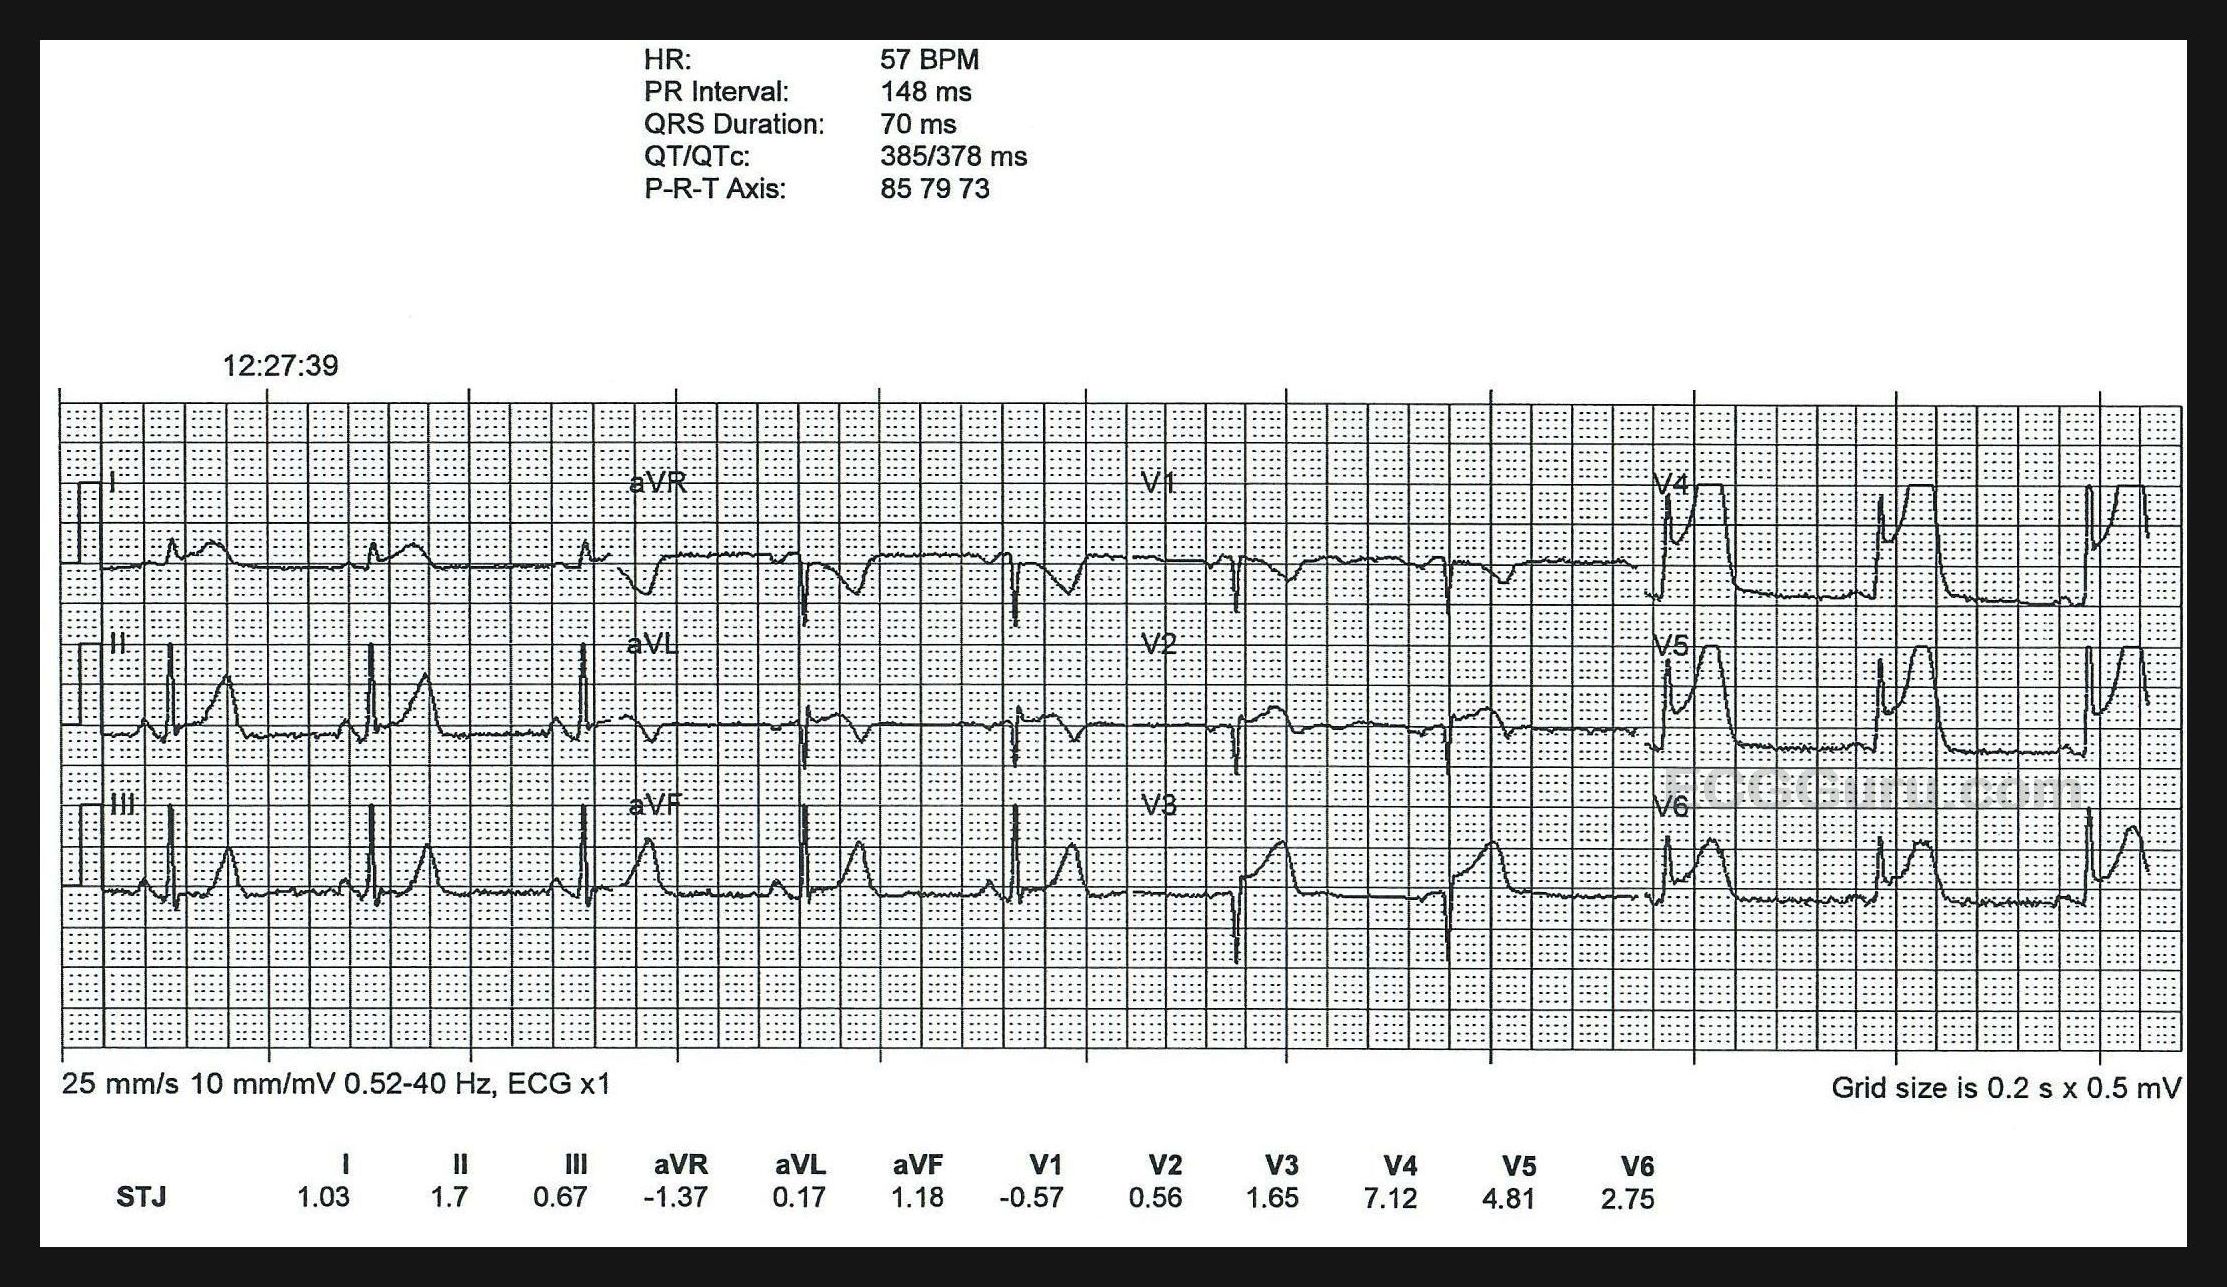
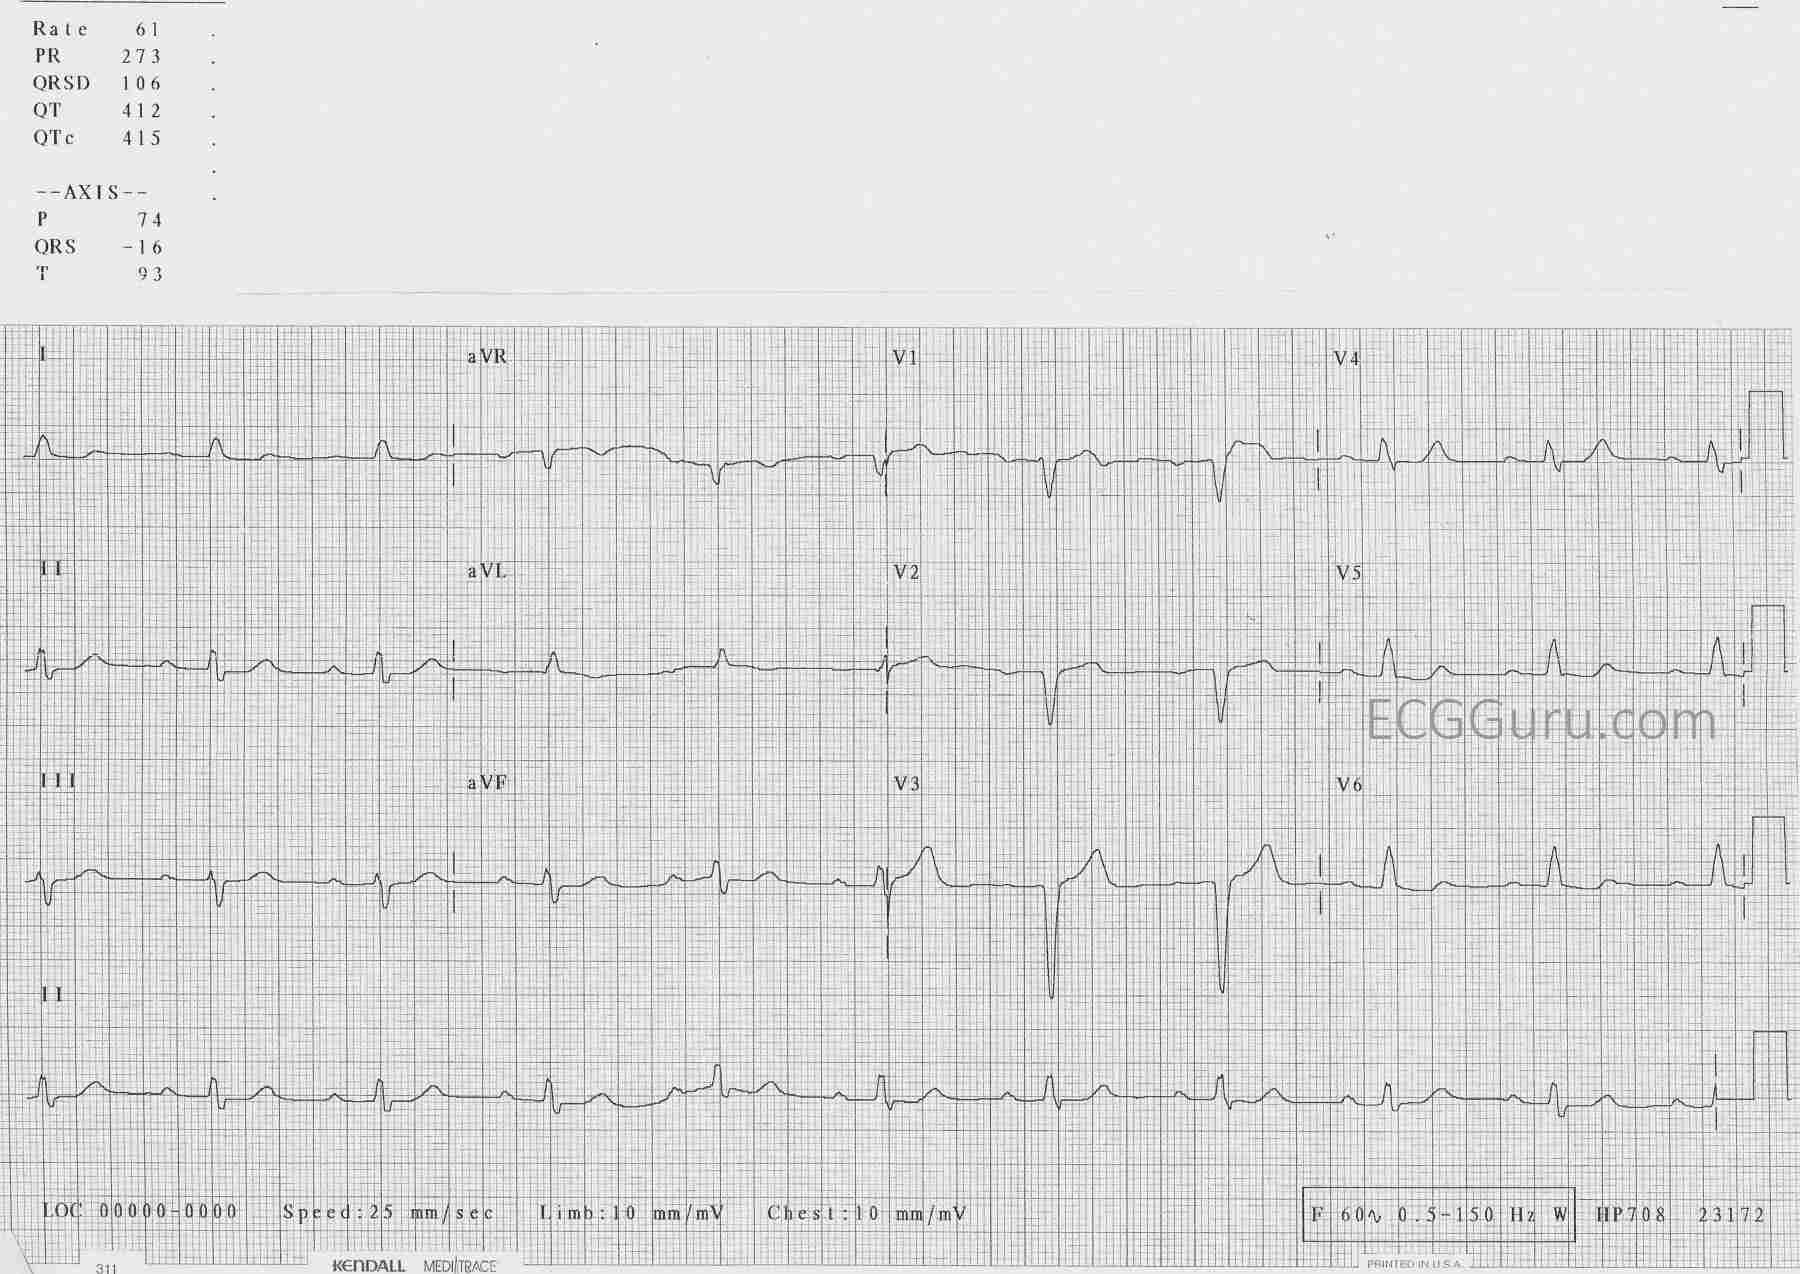
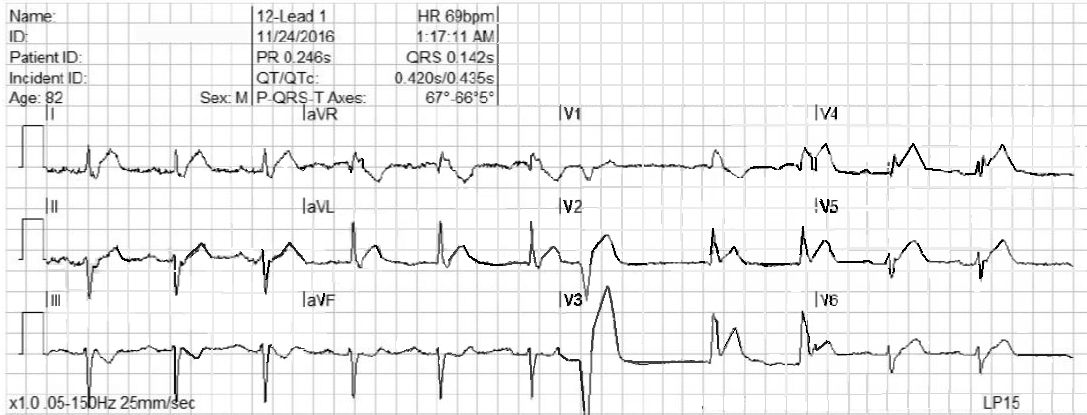
WHAT IS THE RHYTHM?  The heart rate is 69 bpm, and there are P waves before every QRS complex. The underlying rhythm is regular, with one premature beat that is wide without a P wave.  The PR interval is slightly prolonged at .25 seconds.  The rhythm is normal sinus rhythm with first-degree AV block and one PVC. 

WHY THE WIDE QRS?   The QRS complex is wide at .14 seconds. The QRS in V 1 has a wide R wave after a small Q wave.  This in consistent with right bundle branch block pattern, with loss of the normal initial small r wave (pathological Q waves).  The diagnosis of RBBB is further corroborated by the wide little S waves in Leads I and V6.  The QRS frontal plane axis is -66 degrees per the machine, and clearly “abnormal left” because the QRS in Lead II is negative, while the QRS in Leads I and aVL are positive.  This is left anterior fascicular block, also called left anterior hemiblock.  The combination of RBBB and LAFB is a common one, as the two branches have the same blood supply.  It is also called bi-fascicular block. 

WHAT ABOUT THE ST SEGMENTS?  The ST segments in leads V2 through V6 are elevated, and their shape is very straight, as opposed to the normal shape of coved upward (smile). Even though the amount of ST elevation at the J points appears subtle, the shape of the segments, the fact that they appear in related leads, and the fact that the patient is an elderly male with chest pain all point to the diagnosis of ANTERIOR WALL ST elevation M.I. (STEMI).  Additional ST changes include a straight shape in Leads I and aVL and ST depression in V1 and aVR.  

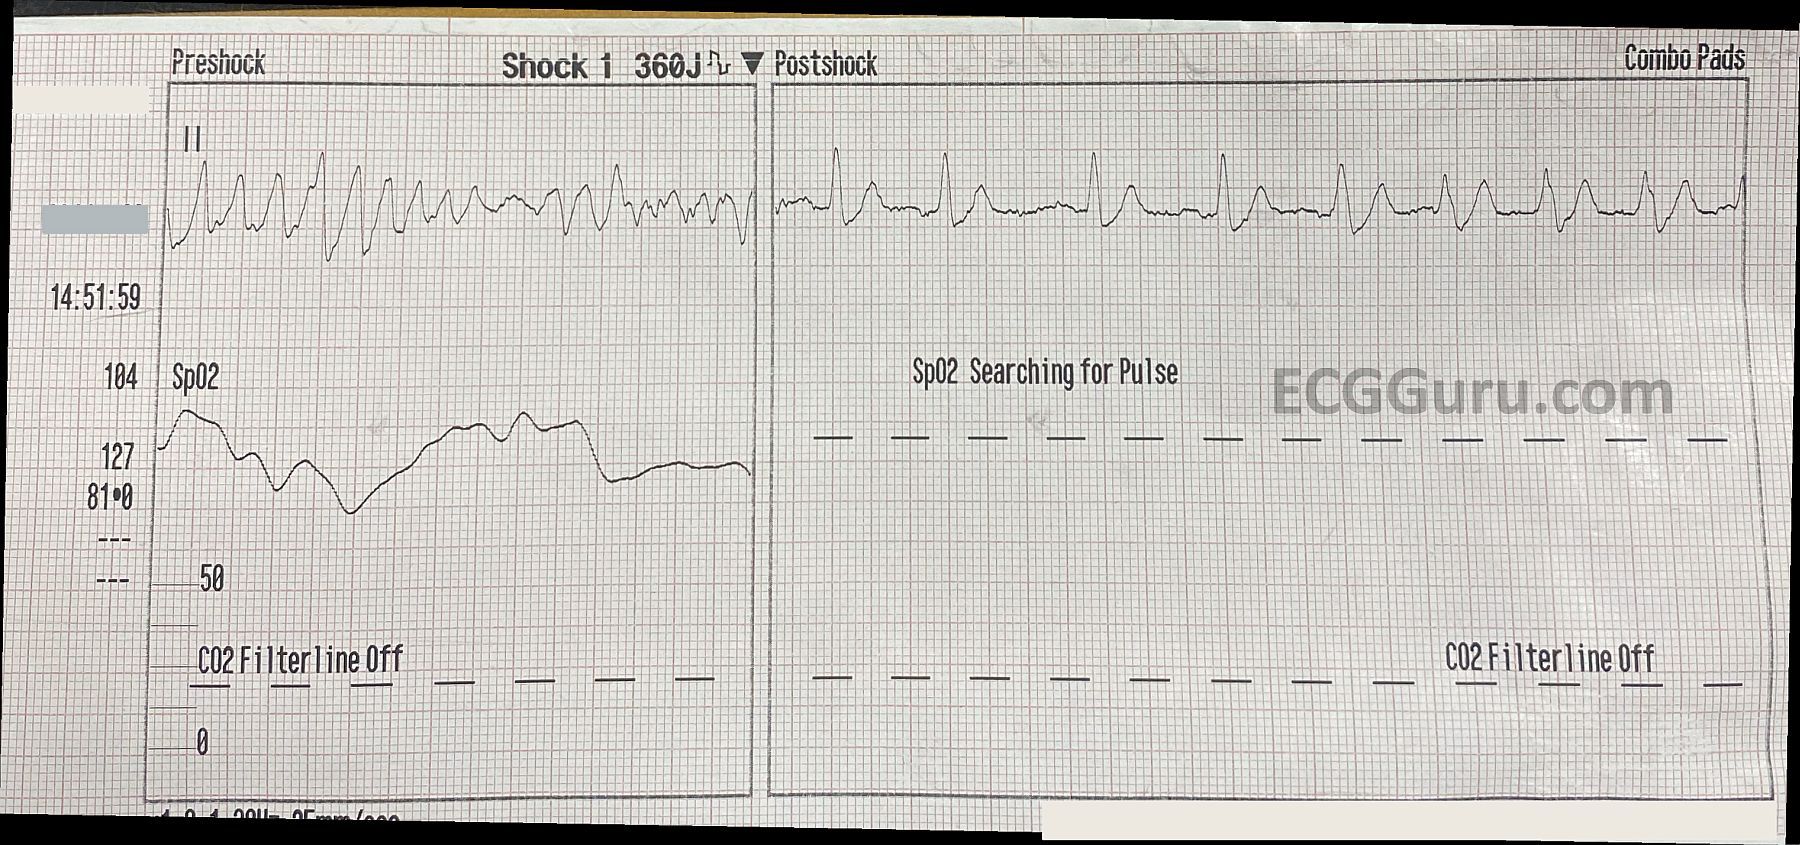
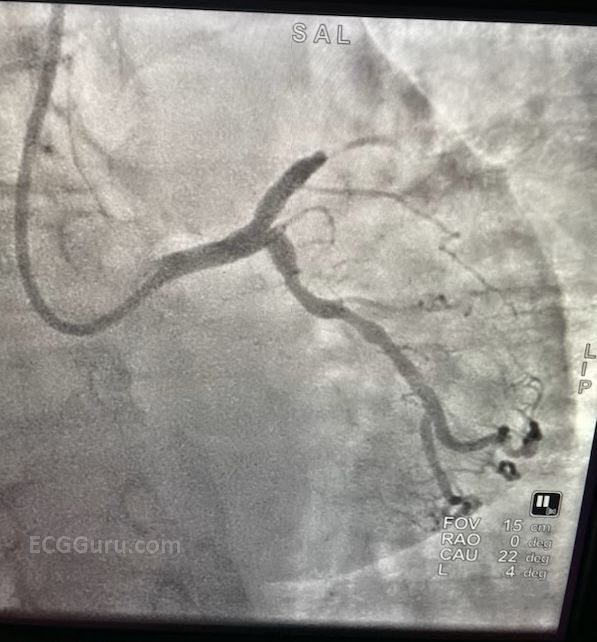
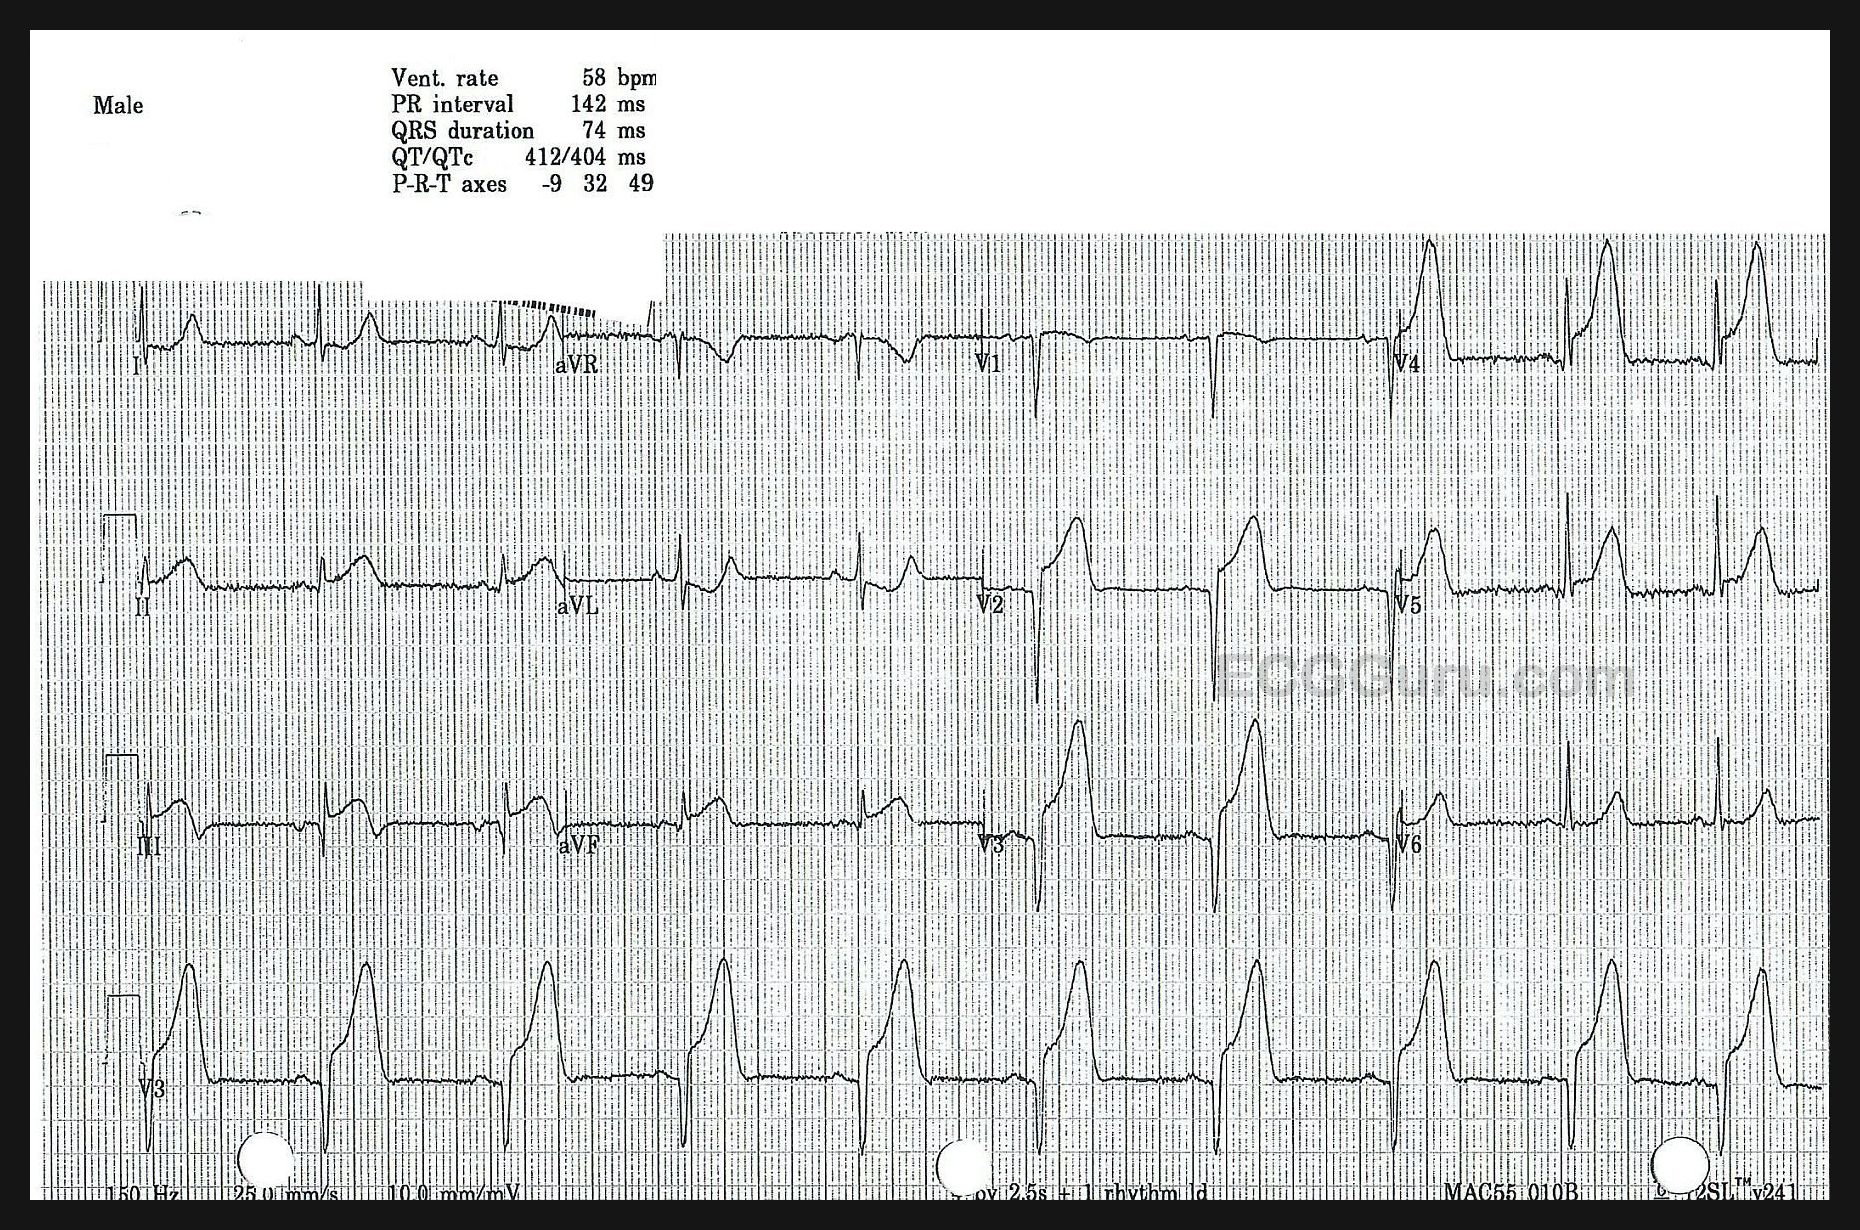
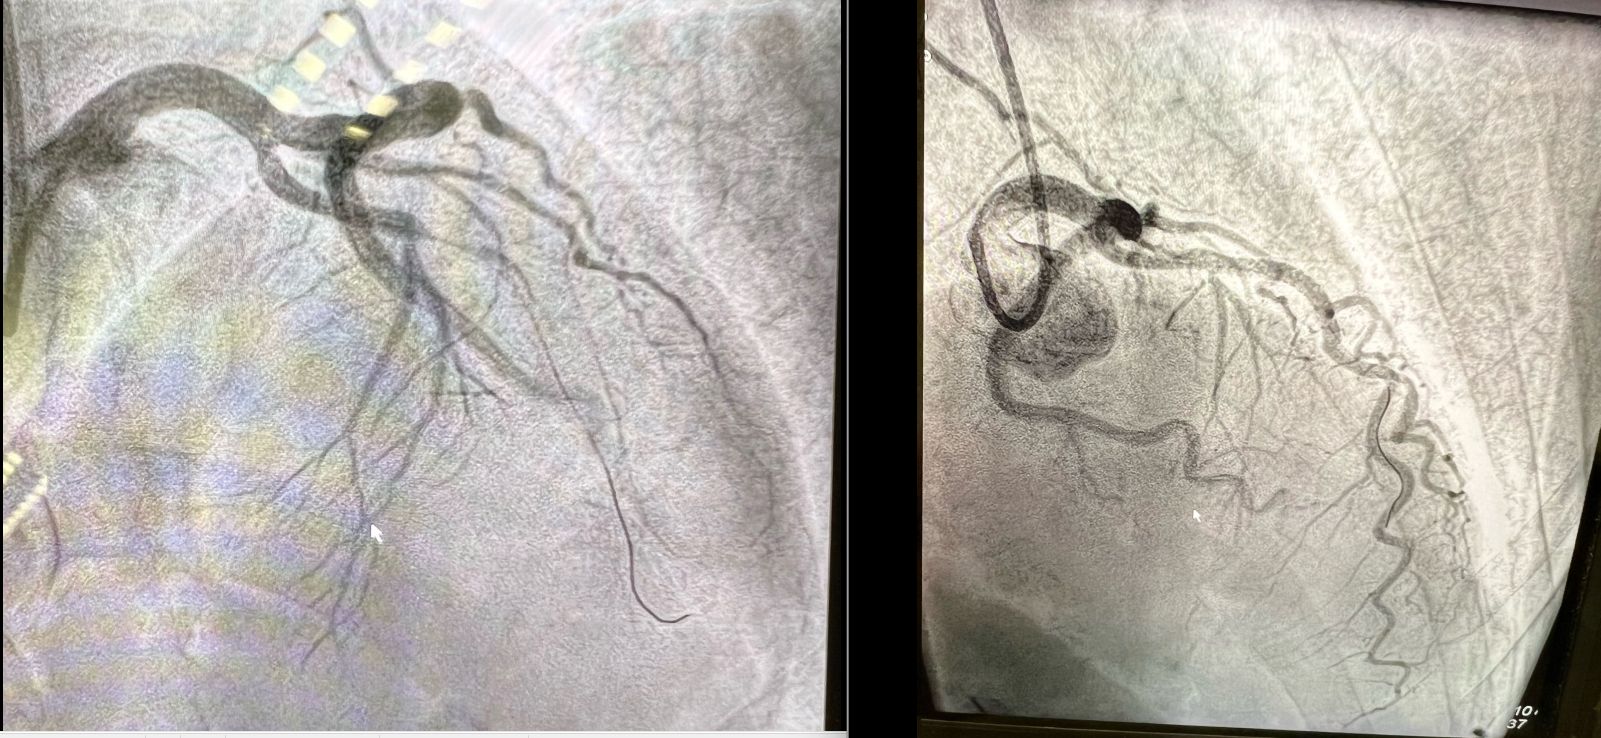
PATIENT OUTCOME  The patient was transported to a cardiac center, where he received angioplasty in the cath lab.  The left coronary artery was found to be occluded, and was repaired and stented.  He recovered without complications and was sent home in a few days.

All our content is FREE & COPYRIGHT FREE for non-commercial use

Please be courteous and leave any watermark or author attribution on content you reproduce.