Displaying 1 - 7 of 7
Dawn's picture

Normal ECG in Seven-year-old Girl

The Patient:   This ECG was obtained from a seven-year-old girl who was complaining of mild, non-specific chest pain.  A medical workup found no structural or electrical abnormalities, and her pain resolved without treatment.  This is a good ECG to illustrate some of the ECG findings that are normal at this age, which might not be normal in adults or in infants.

The ECG: A general description of this ECG would include:

·         Normal sinus rhythm at 87 bpm

·         Normal frontal plane QRS axis at 60 degrees

·         PR interval:  .132 second (132 ms)

Dawn's picture

Normal 12-Lead ECG With Rhythm Strips

Occasionally, we like to feature a normal ECG.  It is important to start with the characteristics of the  normal ECG when learning to recognize “abnormal”.  Of course, there are many variations in ECGs considered to be normal.  Once a student recognizes the features of the normal ECG, it becomes possible to recognize “abnormal” and then learn the clinical ramifications of the abnormalities. 

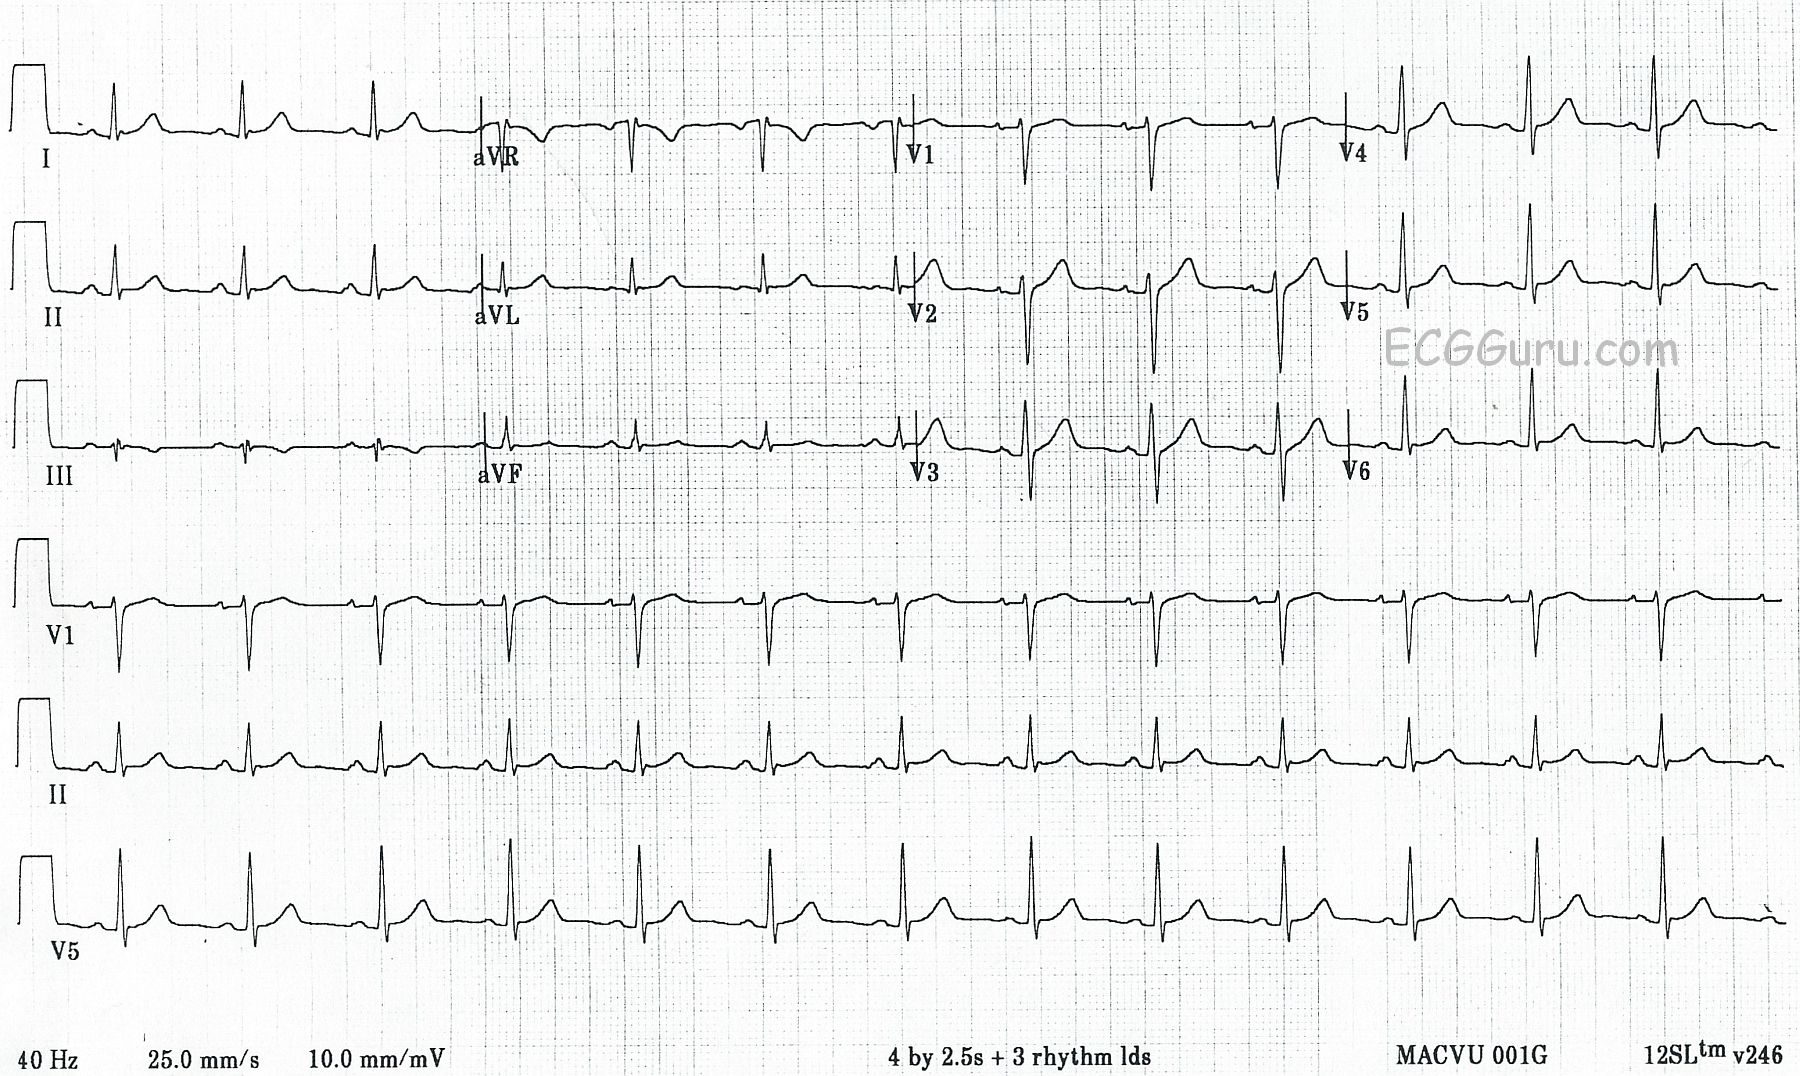
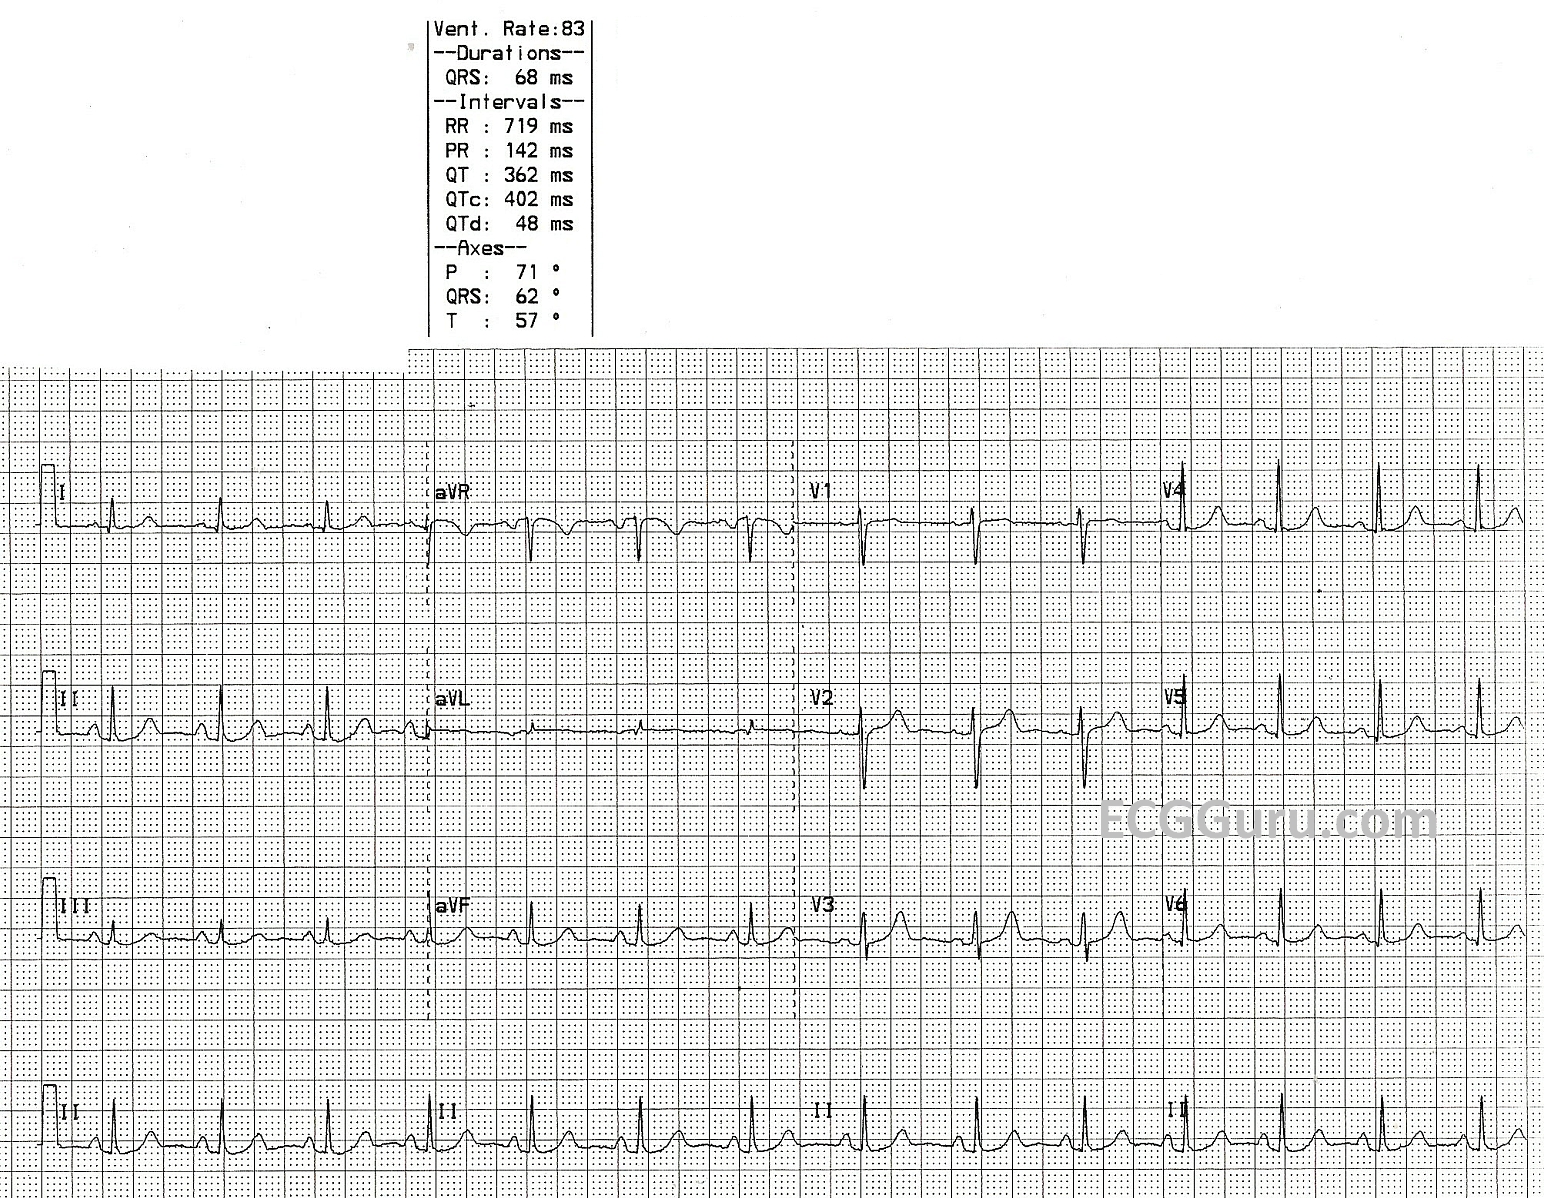
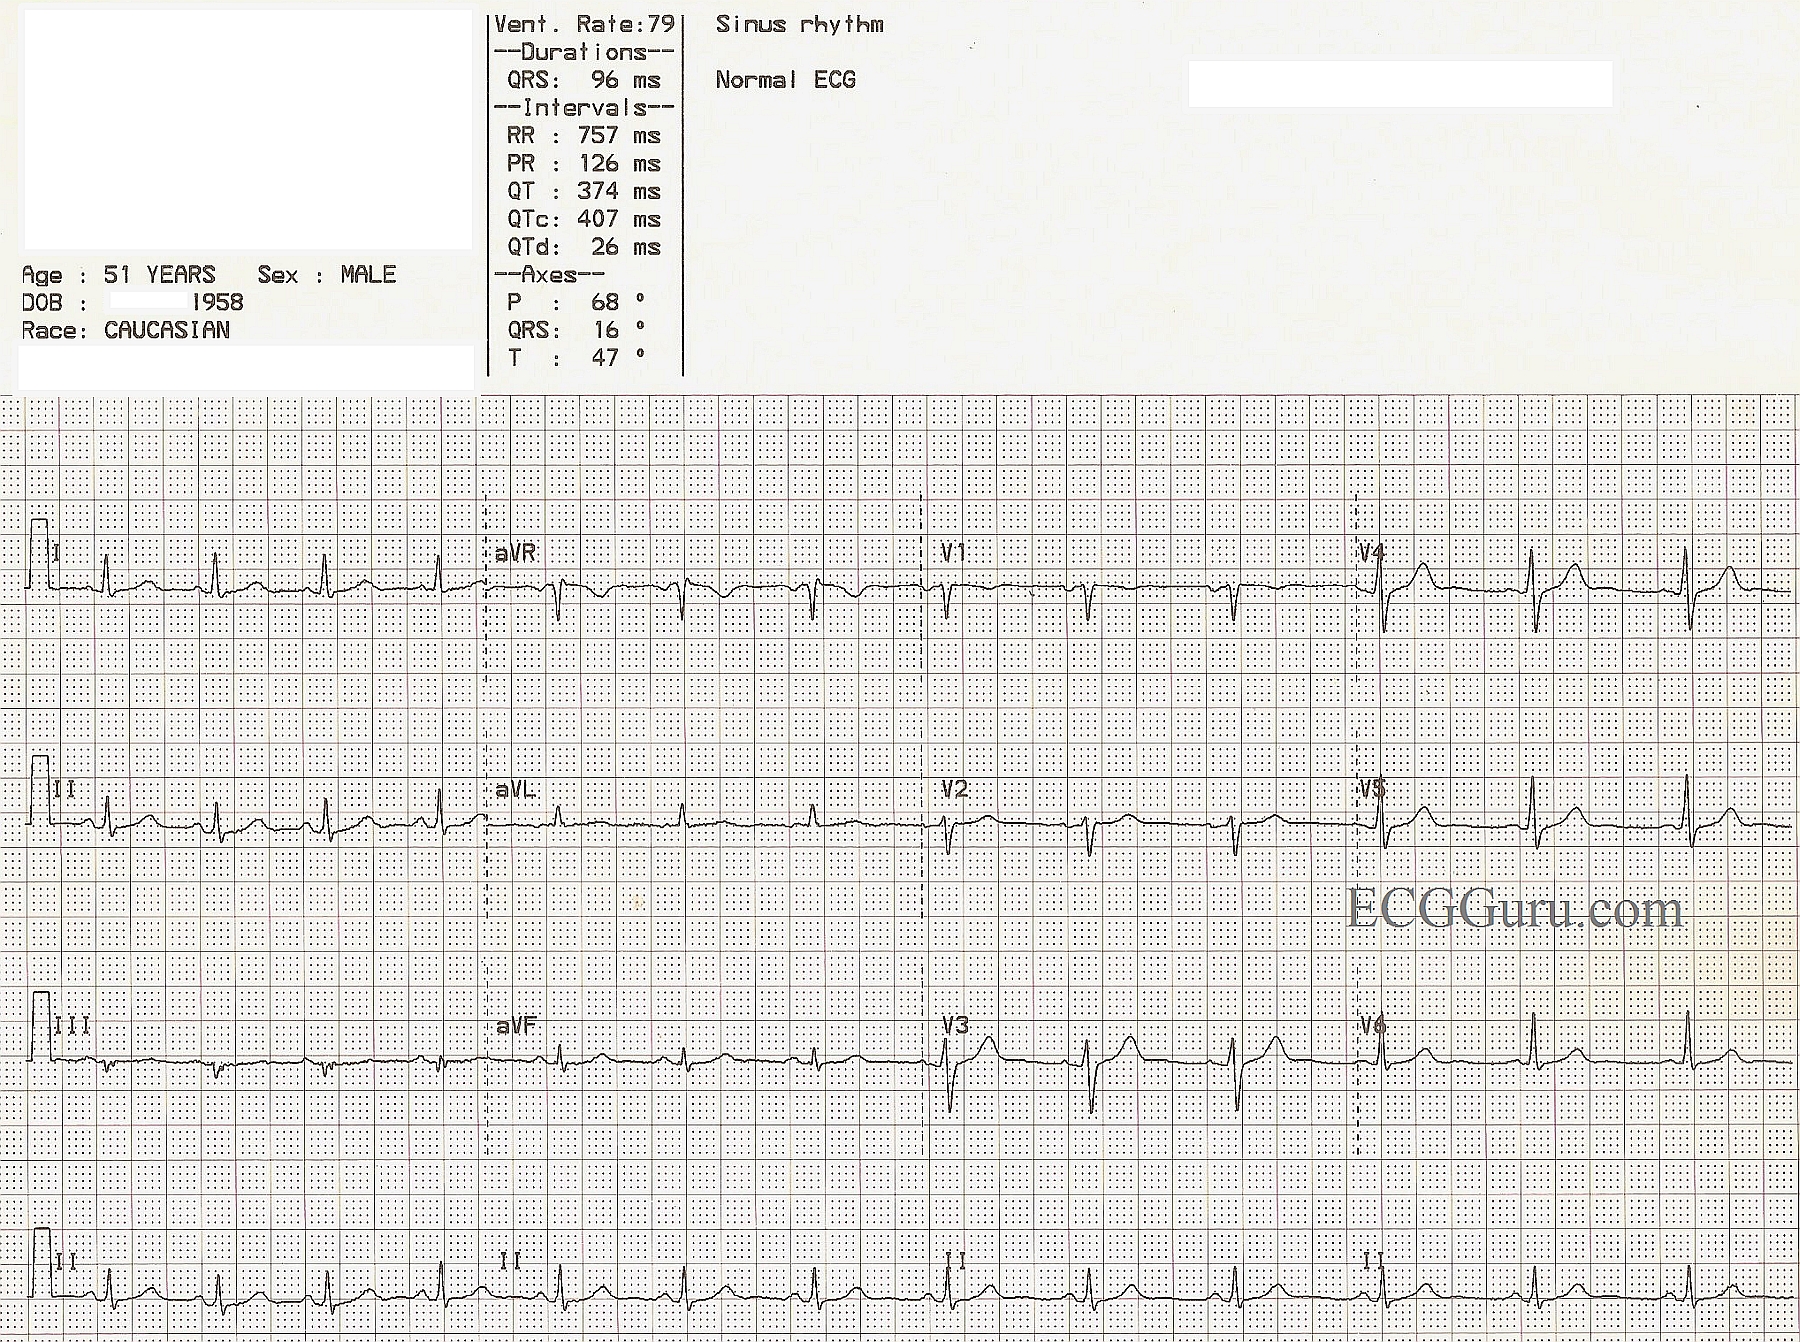
This strip includes a 12-lead ECG in standard format, as well as three rhythm strips in Leads V1, II, and V5All six channels are run simultaneously, so it is easy to compare one heartbeat in multiple leads. 

NORMAL FEATURES

What are the features of this ECG that make it “normal”?  It is a combination of features the ECG has, and features it does NOT have.  Normal findings include:


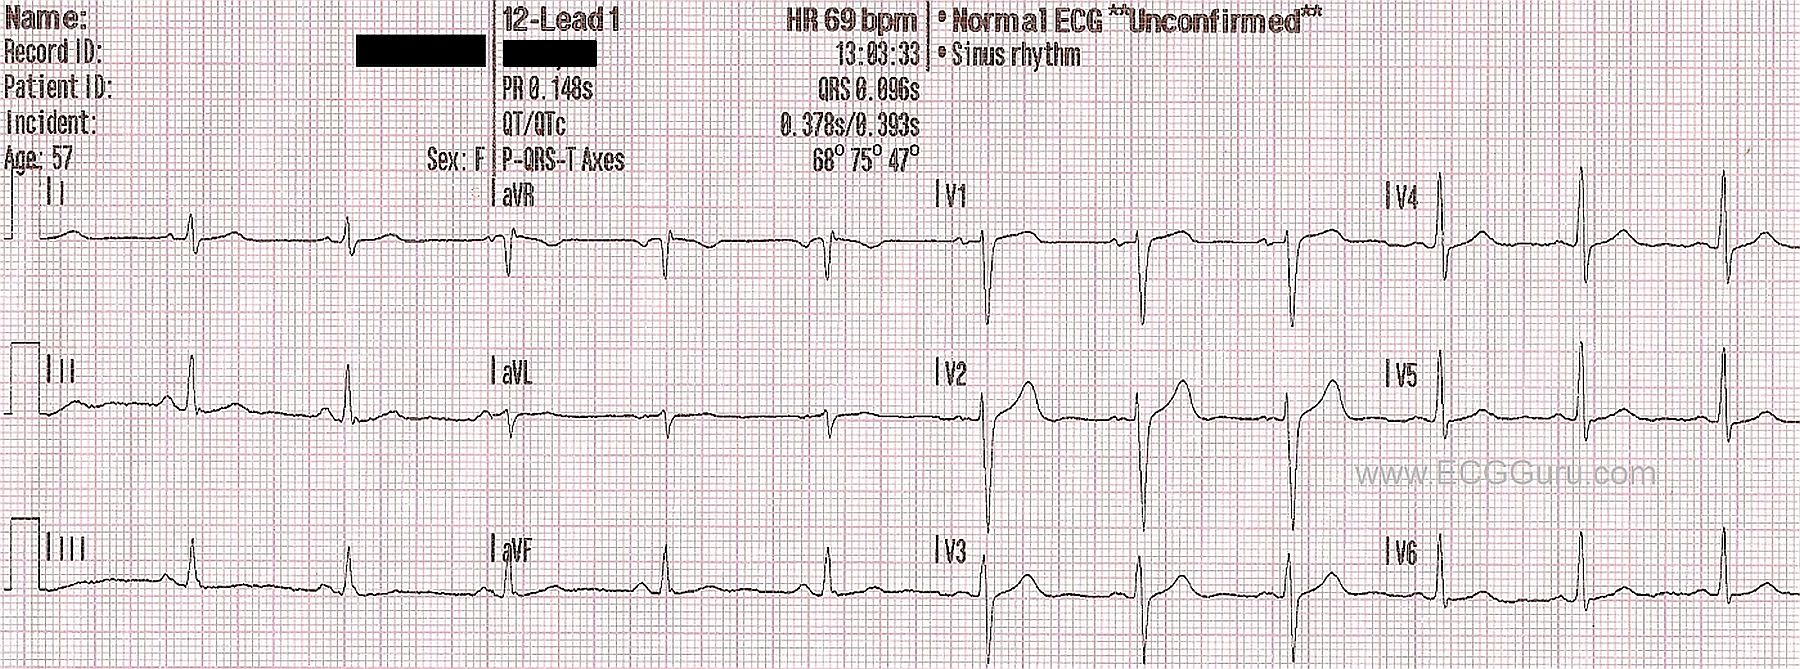
*  Normal sinus rhythm.  The rhythm is regular, the rate is 80 bpm, and there is a P wave before every QRS complex.  The P waves all look alike in each lead, and they are upright in the inferior leads (II, III, and aVF).

*  The intervals are within normal limits.  The PR interval is about .16 sec. (160 ms), the QRS complexes are narrow, and the QT interval is about 320 ms.

*  The ST segments are not elevated or depressed.  The T waves are upright, except in Leads III and aVR. Negative T waves are normal in these leads.  The shape of the ST segments is concave upward, “smiling”.

*  The frontal plane axis is within normal limits.  It is slightly to the left of the center of normal, making Lead I taller than Lead II.  But, when Lead II is positive, the axis is normal.

Dawn's picture

Normal 12-Lead ECG

This ECG is nearly completely normal.  We say "nearly" because there are VERY subtle changes which may or may not be chronic.  Unfortunately, we know nothing about this patient's history or circumstances except age, gender, and race, and the fact that she was an Emergency Department patient.  If she presented with chest pain, the ECG might be viewed completely differently than if she presented with a fever.

So, first, let's look at what is within NORMAL range.  Most of these characteristics will be readily seen by your BASIC LEVEL students.  The rate and intervals are within normal ranges.  The rhythm is normal sinus rhythm.  There is good R wave progression in the precordial leads.  That is, V1 is primarily negatively-deflected and V6 is positive, with Leads V2 through V5 gradually becoming more and more positive.  The frontal plane axis is within normal range - Leads I and II are positive.  This would be a suitable ECG to use when introducing beginning students to the 12-lead ECG.

As for what is NOT NORMAL, there are several subtle characteristics.  First, the P waves are slightly tall and have a pointed appearance.  The P wave in V1 is biphasic.  This can represent P PULMONALE, a sign of right atrial strain.  This is often seen with pulmonary disease.  One might also expect to see a shift of the frontal plane axis to the right if there is right ventricular hypertrophy as a result of increased strain on the right heart, but here we see a subtle shift to the left.  The axis is still within normal limits, but at 17 degrees, it is closer to the left than the right.

The ST segments here are not perfect.  One could argue that there is VERY slight elevation in Leads I and aVL, and the shape of the ST in V1 is coved upward.   Lead III's ST segment is flat, and the T wave is inverted.  Without clinical corelation, it is impossible to determine the importance of these changes.  It is a good discussion to have with your more advanced students.

As said, it would be MUCH easier to ascribe meaning to these changes if we knew something of the patient's chief complaint, symptoms, and history.

Dawn's picture

Normal ECG

It is always good to have a number of "normal" ECGs in your collection.  This particular ECG has only three channels, lacking the fourth channel that is usually used for a rhythm strip.   Some of your students might not work in settings where they have access to four-channel ECG machines. Often, paramedics in the field and medical personnel who use "crash carts" have ECG machines with narrow paper that run three channels at once.  They will print their rhythm strips on one sheet and the 12-lead on another.  This poses a slight handicap when evaluating complex rhythms, but is adequate for most emergency ECG screenings.

This ECG has a number of features that your students should recognize as normal.  The rate and intervals are within normal ranges.  The ST segments are neither elevated or depressed.  The axis of the frontal plane leads is normal, as is the R wave progression in the chest leads.  The T waves are upright, and the P waves are uniform and upright in the inferior leads.  The rhythm is sinus.  There is no appreciable artifact.

A good understanding of what is "normal" is vital for recognizing "abnormal".

Dawn's picture

ECG Basics: Normal 12-Lead ECG

Up until now, we have posted basic rhythm strips in this area of the ECG Guru for those of you who are teachers of beginning students.  Today, we offer a "normal" 12-Lead ECG for those desiring to introduce students to the 12-Lead format.  It is always best to become familiar with normal before venturing into the realm of "abnormal".  Encourage your students to find what they know to be normal, then add to their knowledge.  Examples of findings which are within normal limits are:  rate, rhythm, P wave morphology, QRS morphology, intervals, axis, R wave progression, ST segments, and T wave direction. 

While advanced practitioners can almost always find something that is not "normal", we must remember that that can be said about almost any human body.  This ECG was taken from a healthy volunteer with no medical complaints.

Dawn's picture

Normal ECG

A nice, normal ECG for your collection.  It always helps to have a normal ECG for your students to compare to the abnormal examples you show them.  It pays to teach the characteristics of "normal" to your students so that they might readily recognize "abnormal".  One could argue that the voltage in this ECG is rather low, but that can be explained by body habitus.  Whether you are teaching basic rhythm interpretation, axis determination, R wave progression, or intervals, this ECG can be of help to you.  Remember, if you are teaching students who have not yet learned 12-lead interpretation, the bottom line of a four-channel ECG is usually a rhythm strip - most often Lead II.  It is easy to download this image, then crop it using any photo management program to include only the rhythm strip.  At the ECG Guru, we use Irfanview for the Instructors' Collection ECGs.

Dawn's picture

Normal 12-Lead ECG

Sometimes, when teaching a class, it can actually be a challenge to find a good example of "normal" for your students.  We all tend to collect the ECGs that are "interesting" or unusual.  It is very important for students to fully recognize "normal" before they can appreciate "abnormal".  Here is a nice example of a normal 12-Lead for you. It was obtained by a portable machine, like those used by EMS or on crash carts, so it does not include a fourth channel rhythm strip.  Challenge your students to find the "normal" characteristics of this ECG: normal sinus rhythm; Lead II has the tallest QRS of the limb leads, indicating a normal axis; Lead V1 is primarily negative and the chest leads progress in an orderly fashion to a positive QRS in V6; no ST segment elevation or depression; no T wave inversions; no pathological Q waves; no abnormally tall or wide QRS complexes; and all intervals are normal.  Challenge your students to pick out the normal features of this ECG.


All our content is FREE & COPYRIGHT FREE for non-commercial use

Please be courteous and leave any watermark or author attribution on content you reproduce.