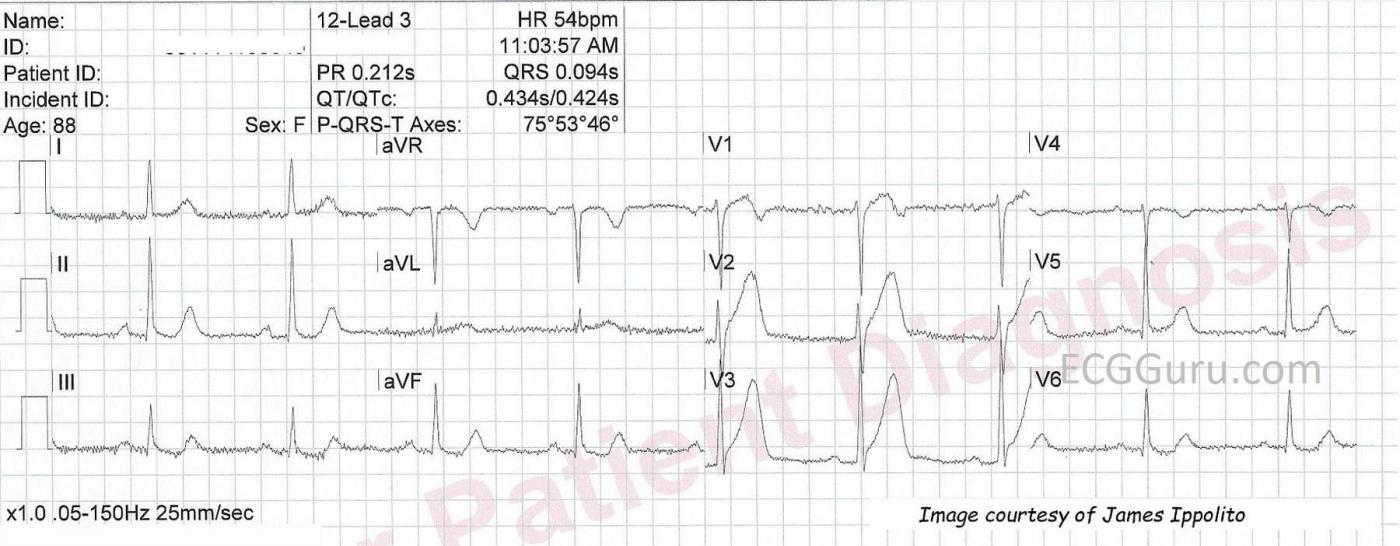
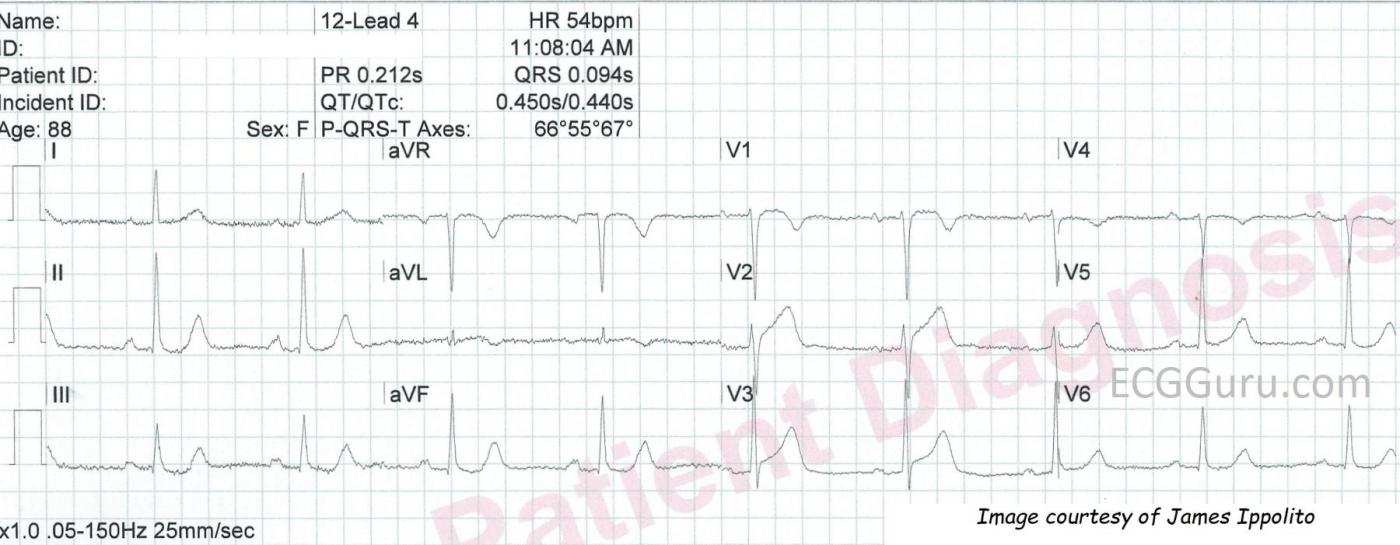
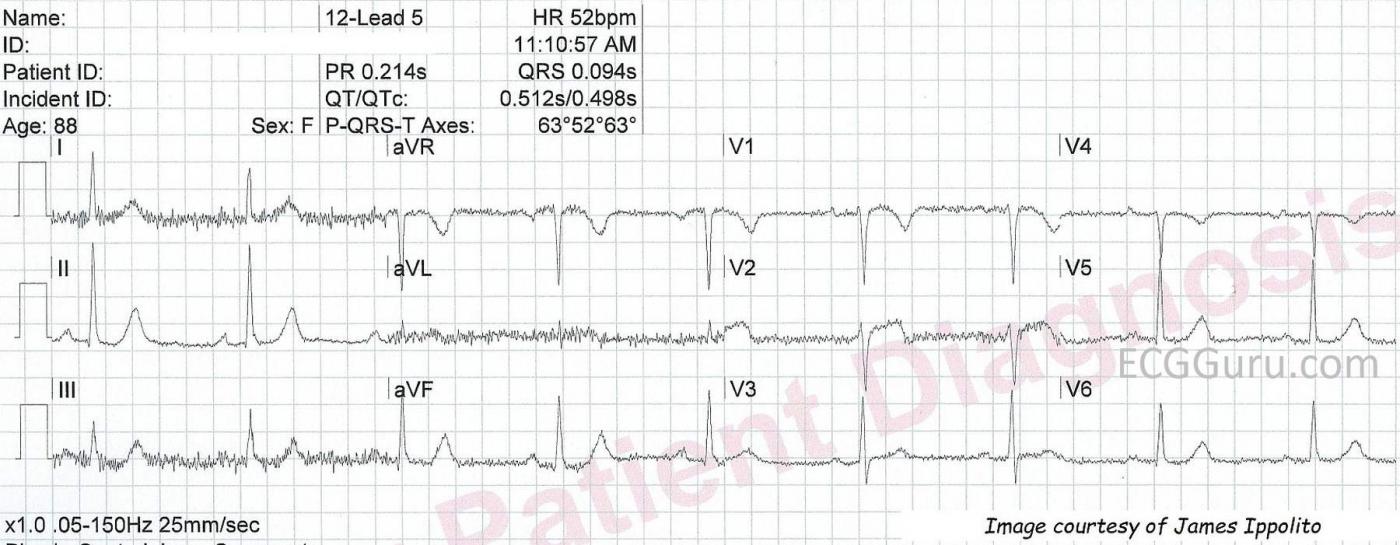
This series shows the evolution of ECG changes in anterior wall M.I. secondary to occlusion of the proximal left anterior descending artery. The patient is an 88-year-old woman with chest pain. She was designated a "cardiac alert" from the field by paramedics. Her proximal LAD was opened and stented in the cath lab. We do not have follow-up information on her.
The first ECG in the series, titled "12-Lead 3", shows ST elevation at the J point in V1 through V3. In addition, the T waves are "hyperacute" - tall, broad, and asymmetrical. This can be an early, transient sign of myocardial injury. Slight reciprocal depressions are seen in the inferior leads. Lead V4 has a T wave inversion that is out of place with the progression of the T waves in V3 and V5. Lead placement may be to blame. Hyperacute T waves in a patient with chest pain should be taken very seriously.
The second ECG, titled "12-Lead 4", shows continued elevation at the J point in Leads V1 through V3, with a lessening of T wave amplitude. In addition, Lead aVL is showing some T wave changes. The T wave is biphasic, and may be about to become inverted. This is not an improvement! V1 through V3 show us the anterior-septal wall, and an M.I. here indicates occlusion in the LAD. Leads I and aVL show the high lateral area of the anterior wall, and damage here is an indicator that the occlusion is proximal.
The third ECG, titled "12-Lead 5", shows a "maturing" of the ST segment elevation. Even though there is some significant artifact, we can see that the ST segment in V1 is coved upward, and the ST segment in V2 is flat. Both shapes are abnormal, and a sign of CAD. The T waves have become less pronounced, but V2 looks as if the T wave may become inverted in the near future. V3 looks improved in this image.
The patient's clinical symptoms did not improve during these ECG changes. Hyperacute T waves are not a definitive sign of STEMI, but they provide a highly visible warning that may catch attention. They definitely are an indication to run serial ECGs, as these paramedics did.
All our content is FREE & COPYRIGHT FREE for non-commercial use
Please be courteous and leave any watermark or author attribution on content you reproduce.


Comments
"My Proximal LAD is About to Occlude"
Ken Grauer, MD www.kg-ekgpress.com [email protected]
Anomolous V4
A very minor point,but I suspect that the reason that V4 doesn't fit with the progression from V3 to V5 is that it is actually a V4R.