Displaying 11 - 20 of 21
Dawn's picture

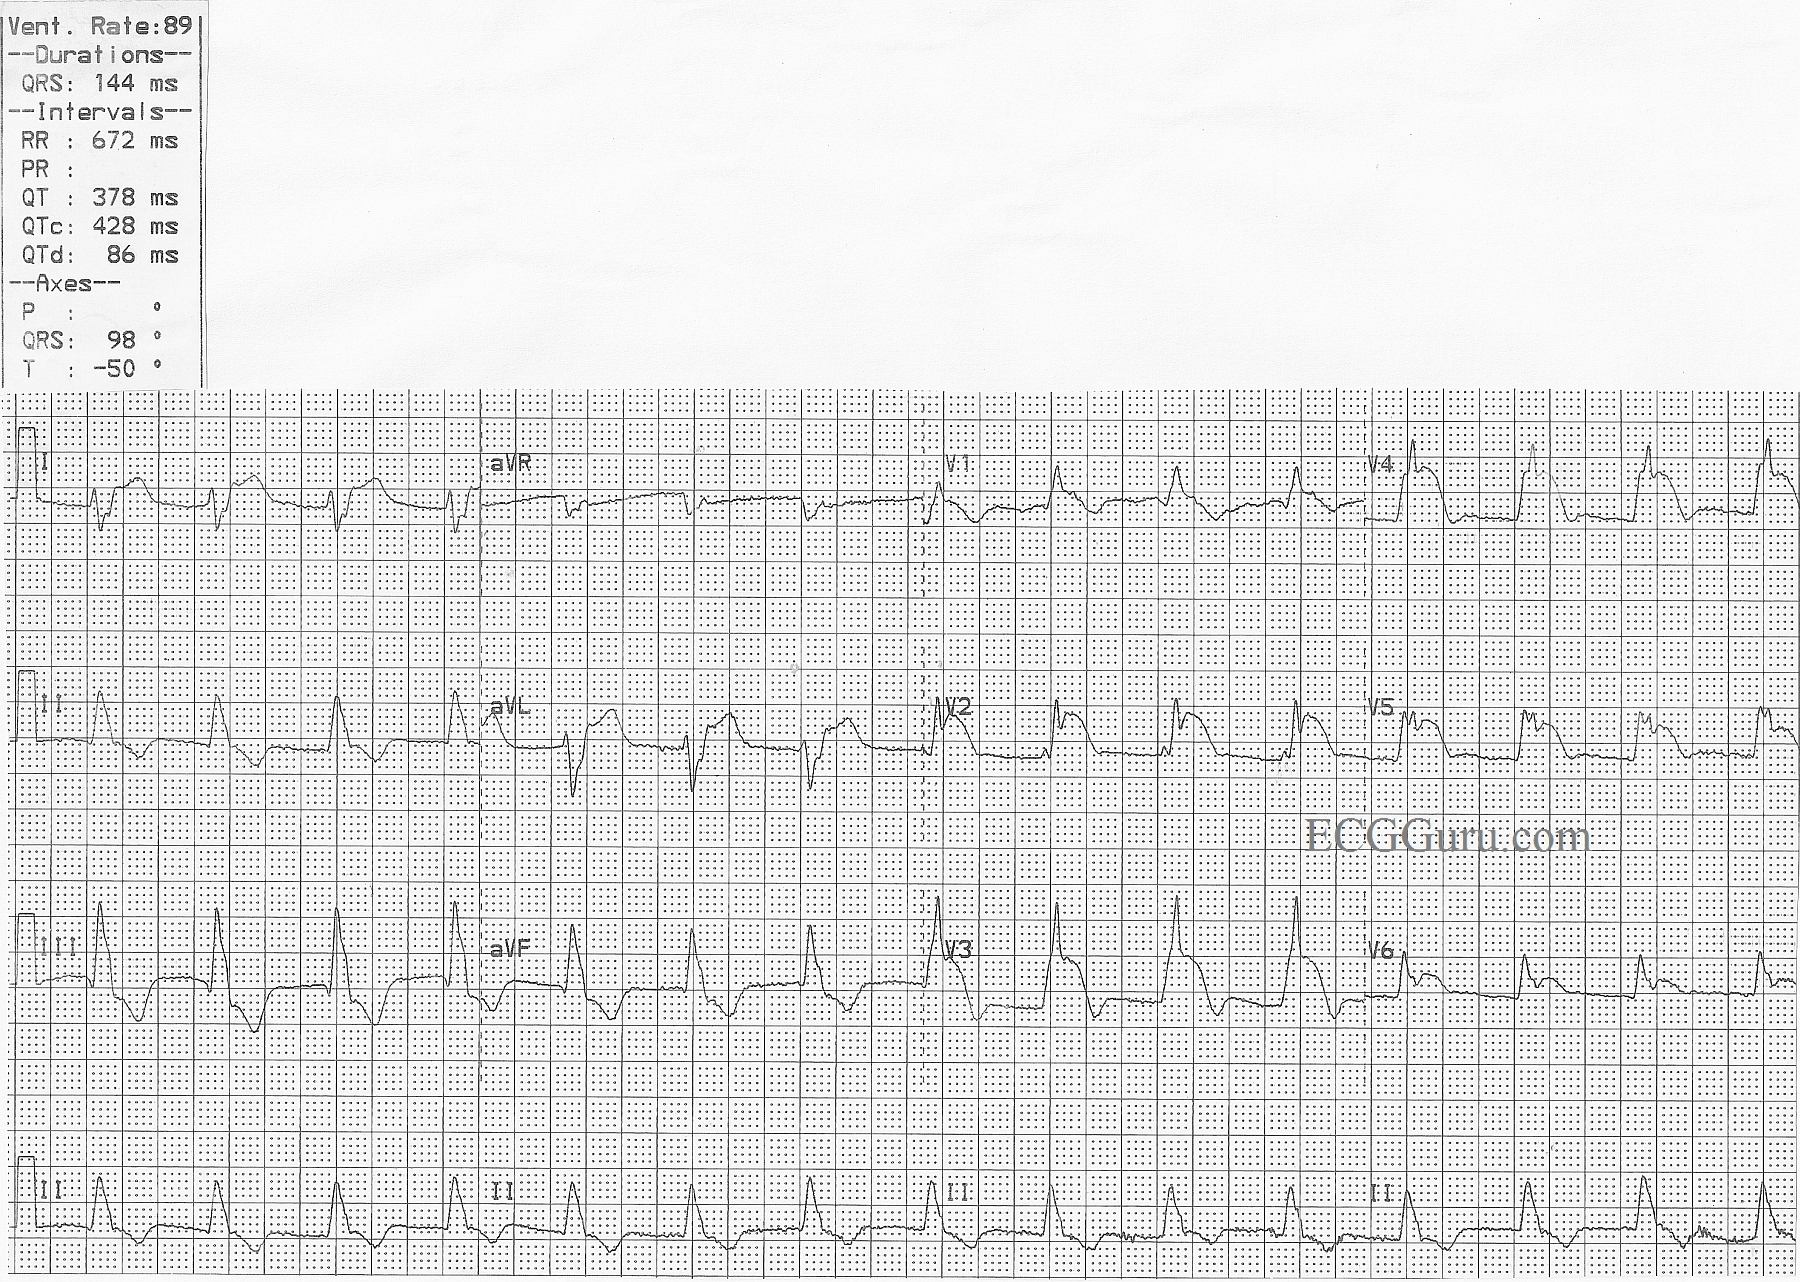
Simultaneous Occlusions in LAD and Diagonal

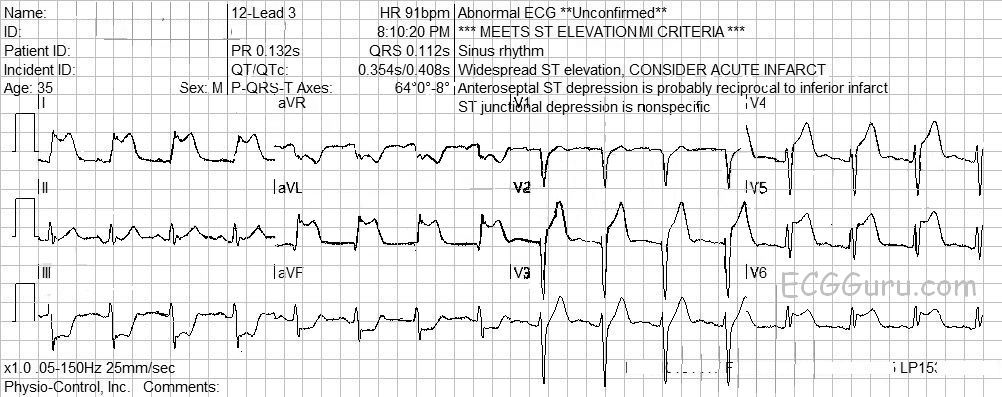
This ECG was obtained from a 35-year-old man who was complaining of crushing substernal chest pain which radiated down his left arm for the last ten minutes. He was diaphoretic, and described his pain as a “10” on the 1-10 scale. He got only modest relief from IV fentanyl.

He was transported to a full-service cardiac hospital, where he underwent angioplasty of simultaneous 100% occlusions of his proximal left anterior descending artery and diagonal artery. He was noted to have apical akinesia with a 35% ejection fraction.

He continued to improve following angioplasty, and was discharged home with an external defibrillator vest.

The ECG shows ST elevation in V2, V4, V5, and V6, which makes us suspect that the V2 and V3 wires were switched accidentally.  This reflects damage in the anterior wall of the LV. There is also very marked ST elevation in I and aVL, reflecting damage in the high lateral wall. There is reciprocal ST depression in the inferior leads aVF and III.  Fortunately, there are no pathological Q waves, which would indicate permanent damage from necrosis of the myocardium.

You can see films from his procedure in Heart Art, labeled “Simultaneous Occlusive Lesions in LAD and Diagonal”.

Dawn's picture

Anterior Wall M.I. With Bifascicular Block

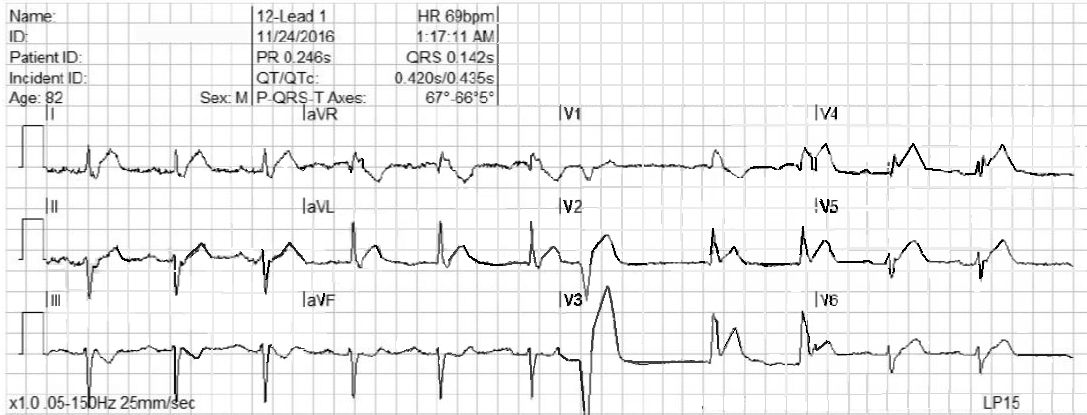
This ECG is taken from an 82-year-old man who called 911 because of chest pain.  He has an unspecified “cardiac” history, but we do not know the specifics. 

WHAT IS THE RHYTHM?  The heart rate is 69 bpm, and there are P waves before every QRS complex. The underlying rhythm is regular, with one premature beat that is wide without a P wave.  The PR interval is slightly prolonged at .25 seconds.  The rhythm is normal sinus rhythm with first-degree AV block and one PVC. 

WHY THE WIDE QRS?   The QRS complex is wide at .14 seconds. The QRS in V 1 has a wide R wave after a small Q wave.  This in consistent with right bundle branch block pattern, with loss of the normal initial small r wave (pathological Q waves).  The diagnosis of RBBB is further corroborated by the wide little S waves in Leads I and V6.  The QRS frontal plane axis is -66 degrees per the machine, and clearly “abnormal left” because the QRS in Lead II is negative, while the QRS in Leads I and aVL are positive.  This is left anterior fascicular block, also called left anterior hemiblock.  The combination of RBBB and LAFB is a common one, as the two branches have the same blood supply.  It is also called bi-fascicular block. 

WHAT ABOUT THE ST SEGMENTS?  The ST segments in leads V2 through V6 are elevated, and their shape is very straight, as opposed to the normal shape of coved upward (smile). Even though the amount of ST elevation at the J points appears subtle, the shape of the segments, the fact that they appear in related leads, and the fact that the patient is an elderly male with chest pain all point to the diagnosis of ANTERIOR WALL ST elevation M.I. (STEMI).  Additional ST changes include a straight shape in Leads I and aVL and ST depression in V1 and aVR.  

PATIENT OUTCOME  The patient was transported to a cardiac center, where he received angioplasty in the cath lab.  The left coronary artery was found to be occluded, and was repaired and stented.  He recovered without complications and was sent home in a few days.

Dawn's picture

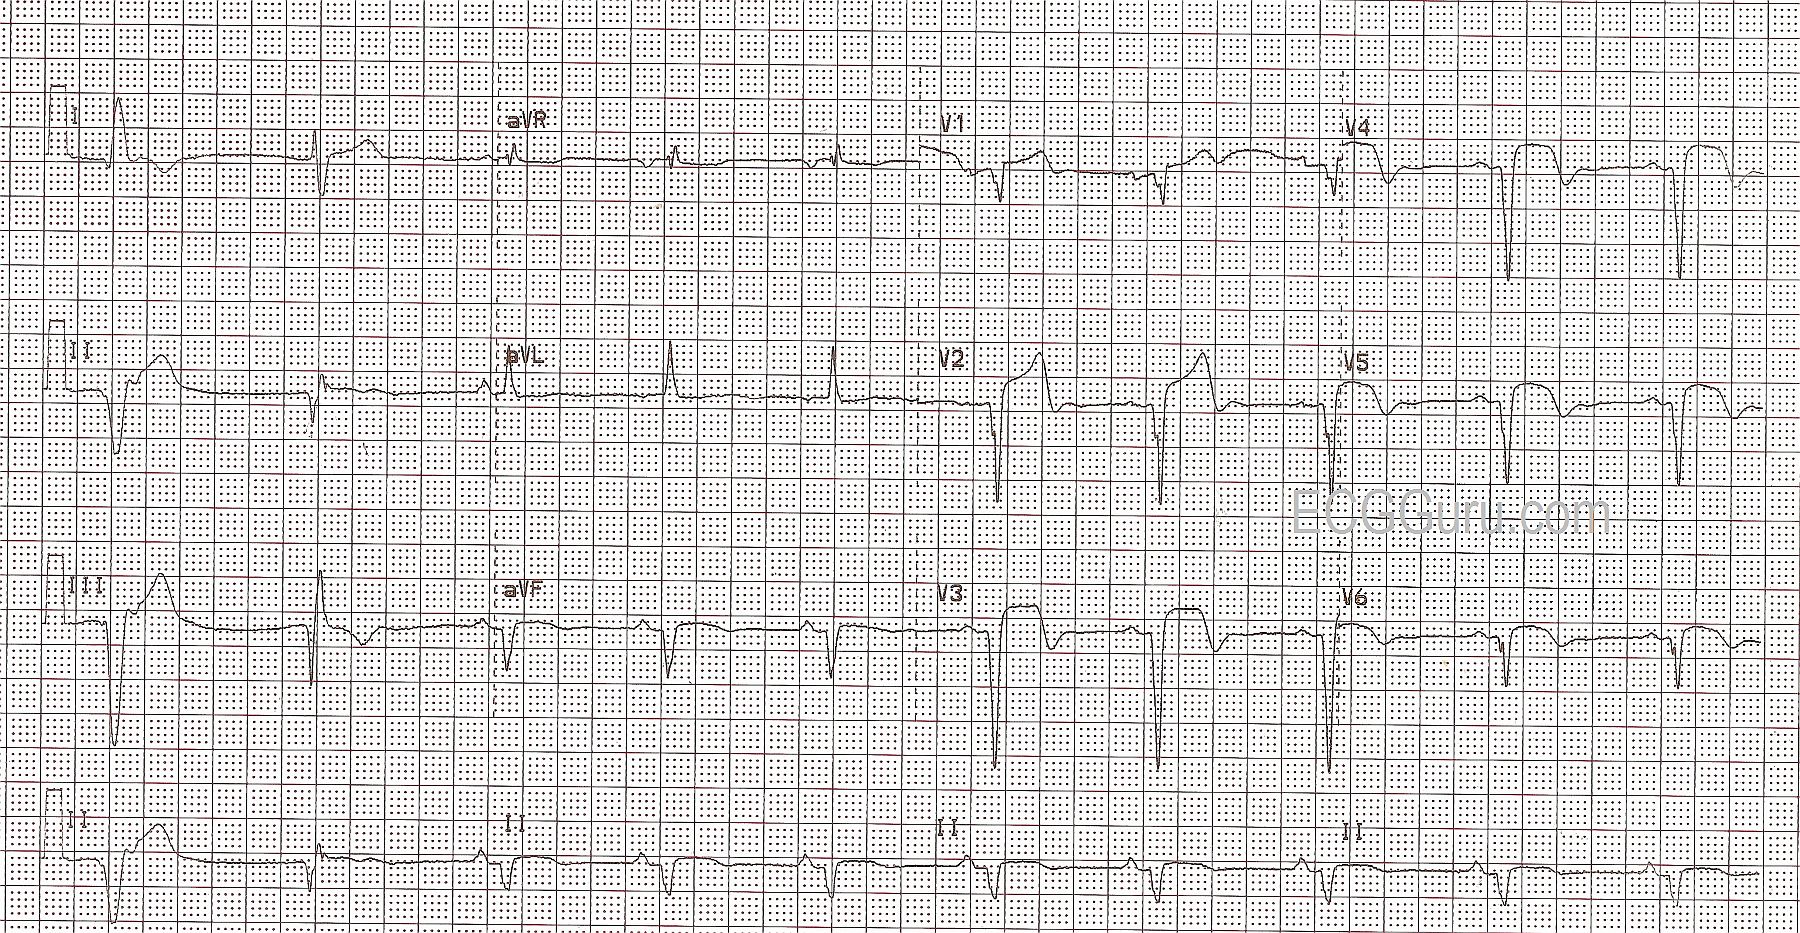
Acute M.I. In Patient With Pacemaker

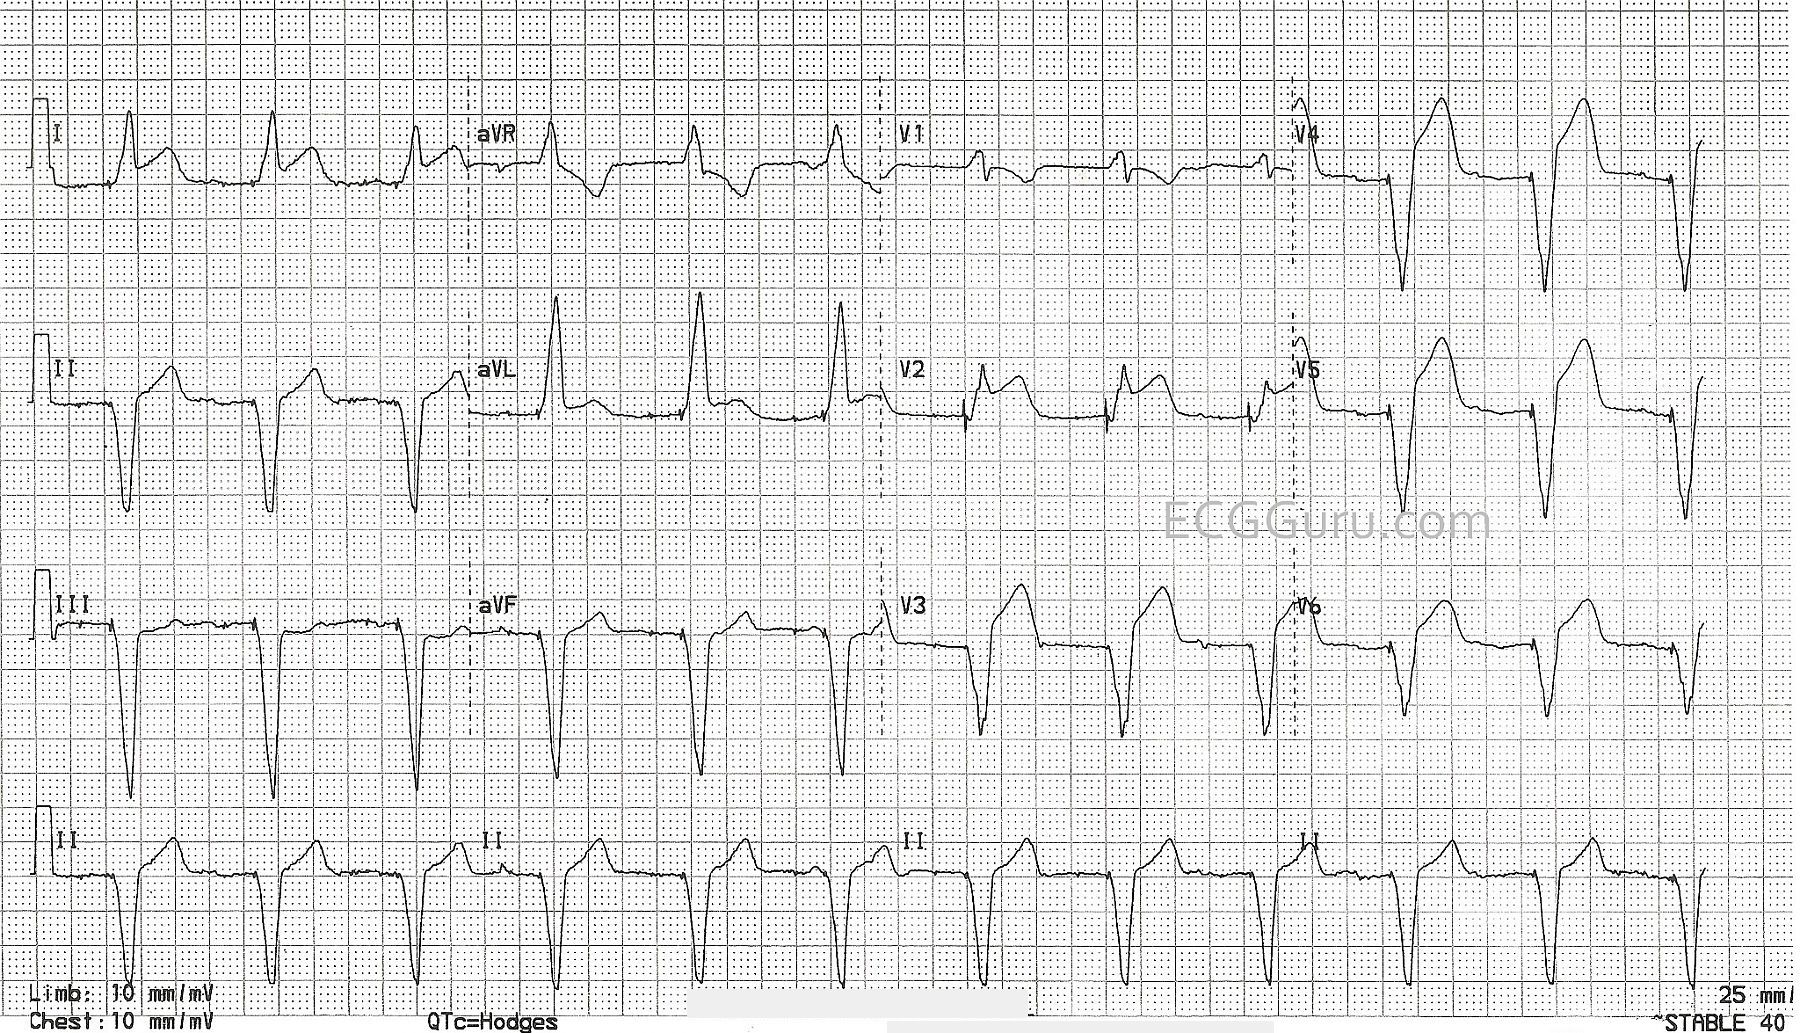
This ECG is taken from an elderly man who has a history of complete heart block and AV sequential pacemaker.  On the day of this ECG, he presented to the Emergency Department with chest pain and shortness of breath. His vital signs were stable and within normal limits.  We do not have information about his treatment or outcome. 

I don’t see spikes.  How do we know this is a paced rhythm?  The ECG clearly shows the presence of an AV pacemaker.  There are very tiny pacer “spikes”, probably best seen in Leads III, aVF, aVL, and most of the precordial leads.  Other ECG signs that this is a paced rhythm are:  wide QRS at about .16 seconds (160 ms); abnormal left frontal plane axis; regular rhythm with AV dissociation (there are P waves seen occasionally that have no fixed relationship to the QRS complexes).  Also, V6 is negative.  That rules out left bundle branch block unless the electrodes are misplaced.  There are no capture beats in this strip.  The patient appears to be, at least right now, 100% dependent on the paced rhythm. 

Why does the presence of a pacemaker make it harder to diagnose an M.I. from the ECG?  Wide-QRS rhythms, such as right-ventricular paced rhythms, left bundle branch block, and ventricular ectopic rhythms, usually have “discordant ST and T wave changes”.  That is, when the QRS is positive (upright), the ST and T wave are negative.  The reverse is also true:  when the QRS is negative and wide, the ST and T wave changes are positive (ST elevation).  This is not true for right bundle branch block because the conduction delay that causes the widening of the QRS is in the right ventricle, and the ST segment is reflecting the LEFT ventricle’s repolarization.  Discordant ST changes can make it difficult to determine from the ECG alone that there is an ST elevation M.I. (STEMI).  Diagnosis usually must be made from patient presentation, ECG changes over time, and cardiac enzymes – or more definitively from cardiac angiogram. Pacemakers that produce narrow QRS complexes do not cause discordant ST changes. 

Dawn's picture

Teaching Series: Acute Anterior Wall M.I.

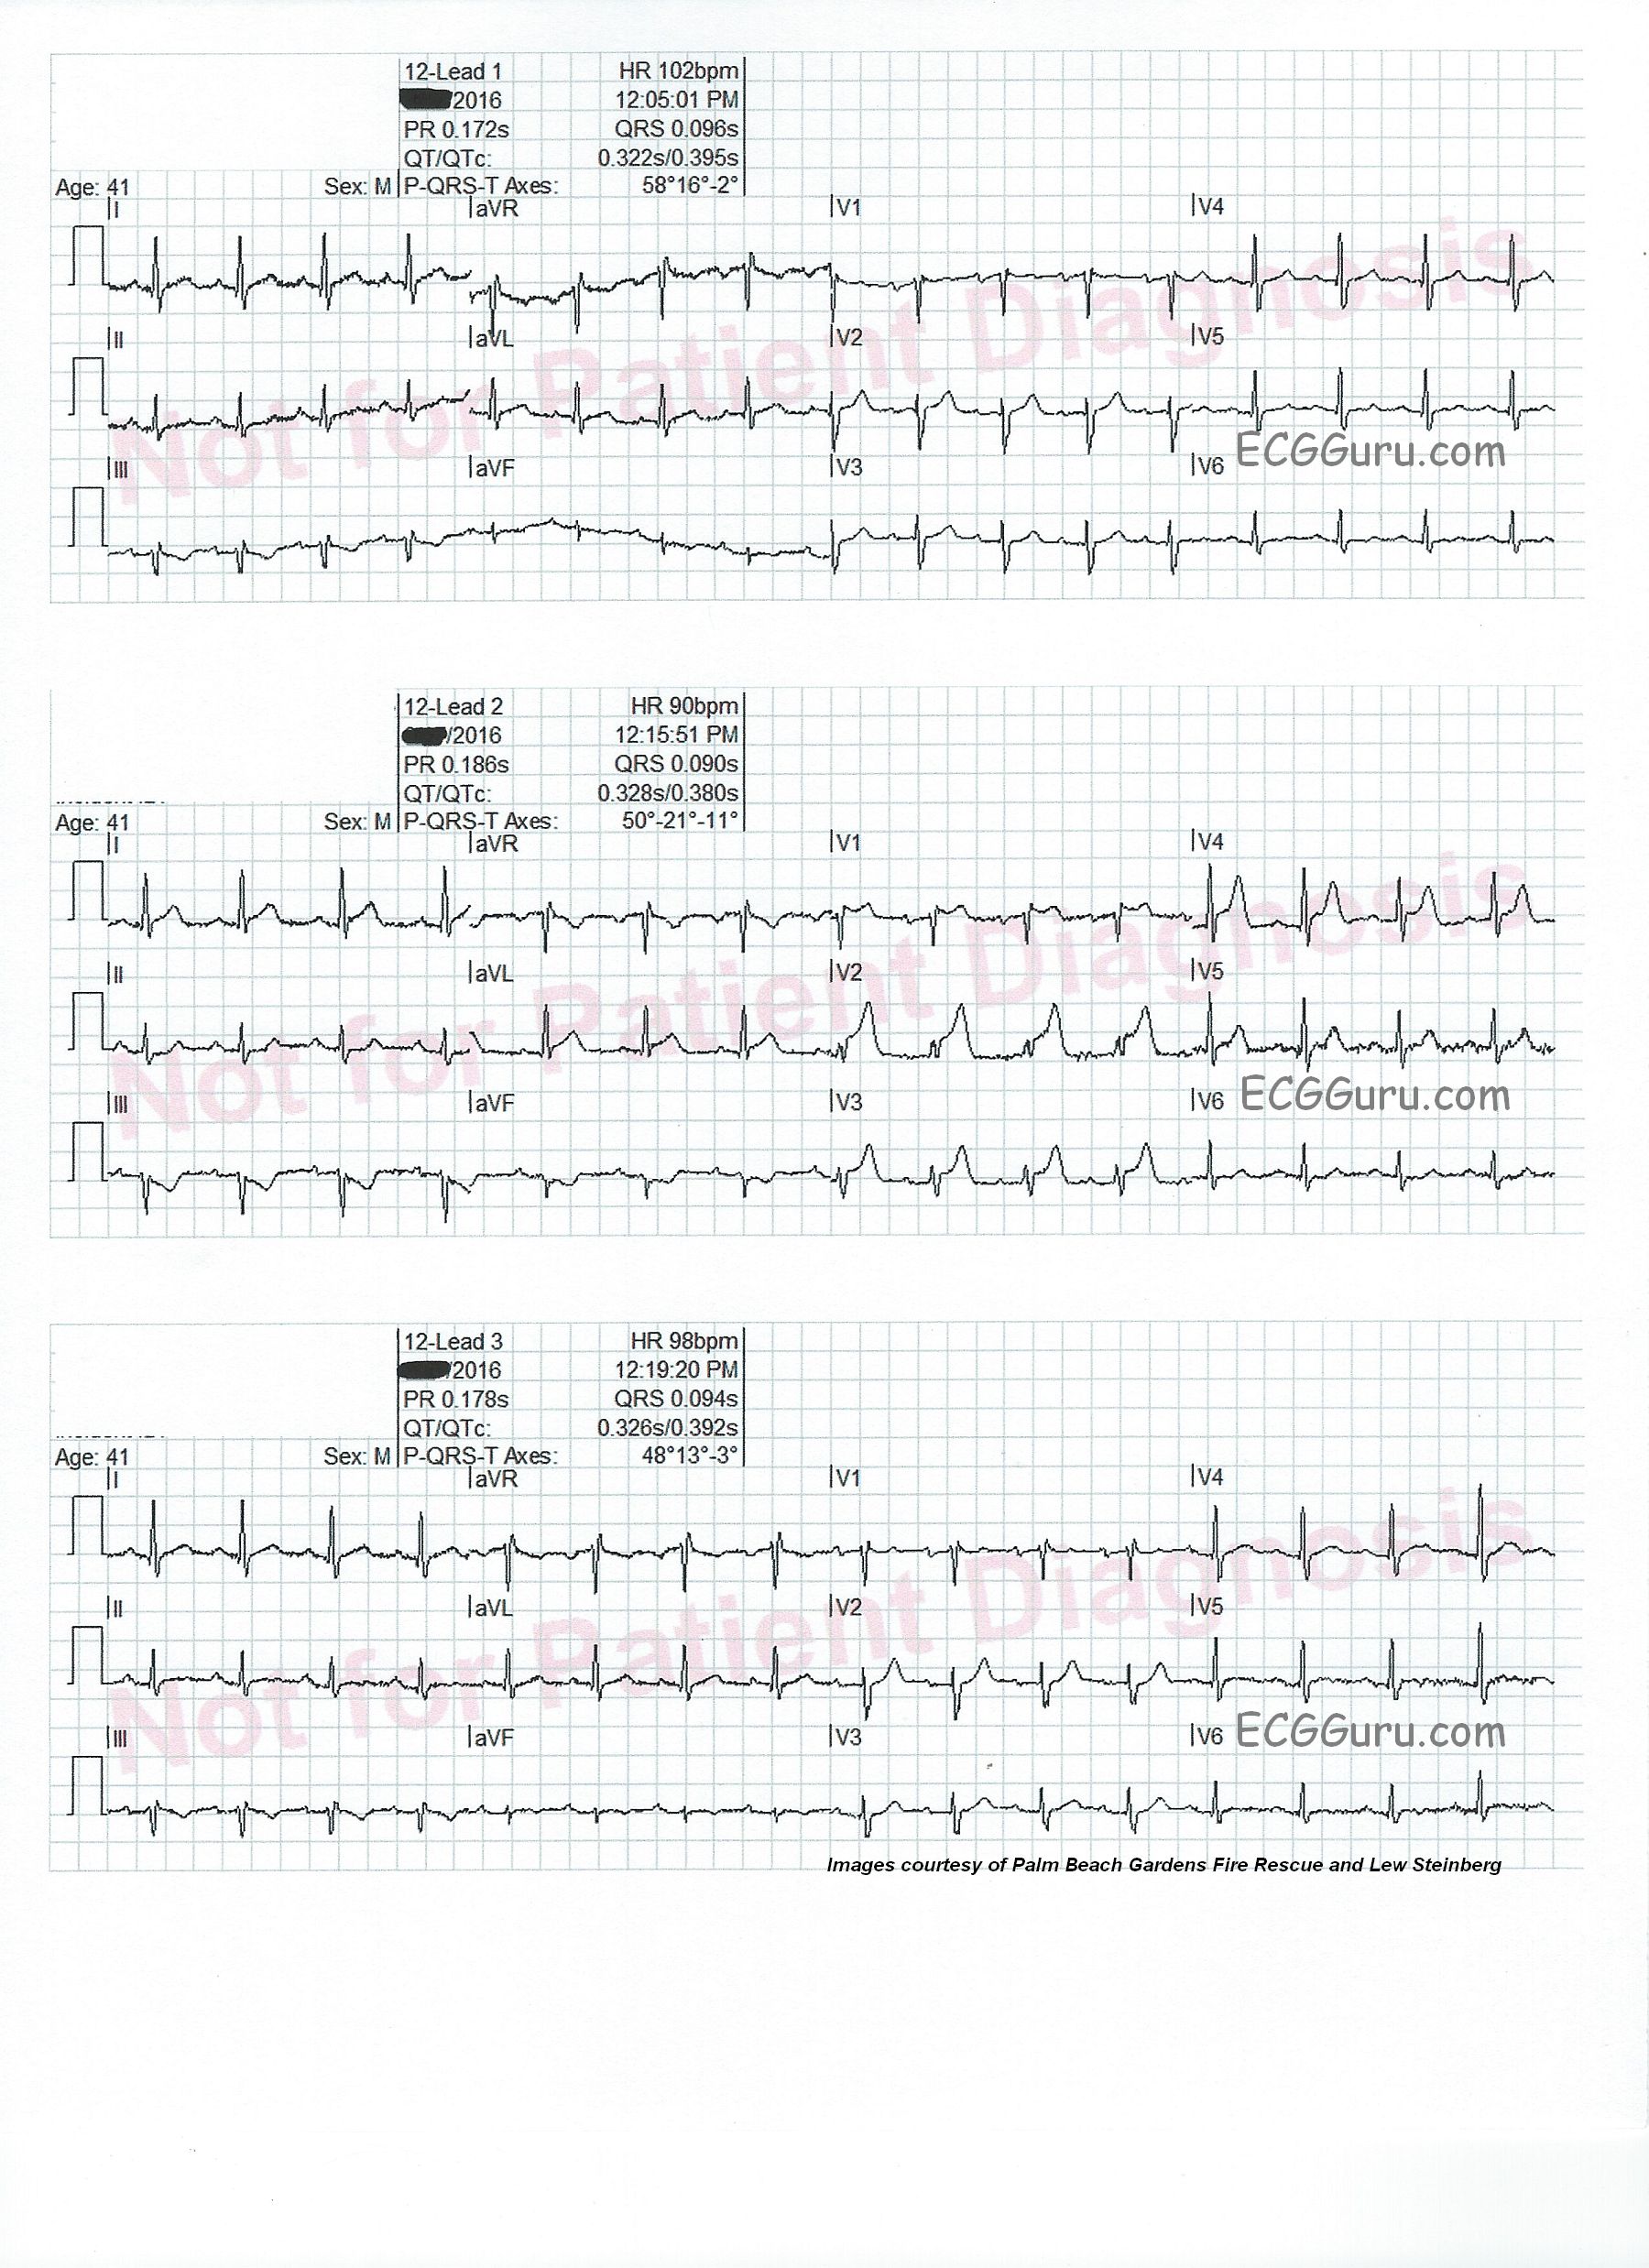
Intermittent chest pain.     This series of three ECG were taken from a 41-year-old man with a two-week history of intermittent chest pain.  At the time of the first ECG, 12:05 pm, he was pain-free.  We see a sinus tachycardia at 102 bpm, and has just come under the care of paramedics. There is a very subtle ST sagging and T wave inversion in Lead III, and no other ST changes. He had an uneventful trip to the hospital.

On arrival at the Emergency Department, just before he was unloaded from the ambulance (12:15), he experienced chest pain.  An ECG was obtained, which shows ST elevation in V1 through V4, as well as in Leads I and avL.  There are reciprocal ST depressions in Leads III and aVF. 

The patient was taken into the ED, where his symptoms abated, and a third ECG was obtained (12:19). The third ECG looks very much like the first one. V5 and V6 have T waves that appear flat, or even inverted, but there is some baseline artifact making it hard to see them. 

Diagnosis confirmed       Based on the patient’s presentation, and the second ECG, he was taken immediately to the cath lab. A 100% occluding lesion with a clot was discovered in the mid LAD.  The clot was removed with suction, and the lesion stented.  A 40% narrowing was discovered in the RCA.  

Repeat ECGs whenever possible       This series of ECGs offers a compelling argument for performing repeat ECGs.  This can be especially important when symptoms are waxing and waning.  Sometimes, a clot can completely occlude an artery, then “float” to another position, allowing blood flow to resume.  Sometimes, the artery constricts around the lesion, causing occlusion, then relaxes.  Had the rescue crew not repeated the ECG at 12:19, there may have been a delay in this young patient receiving interventional care.

Dawn's picture

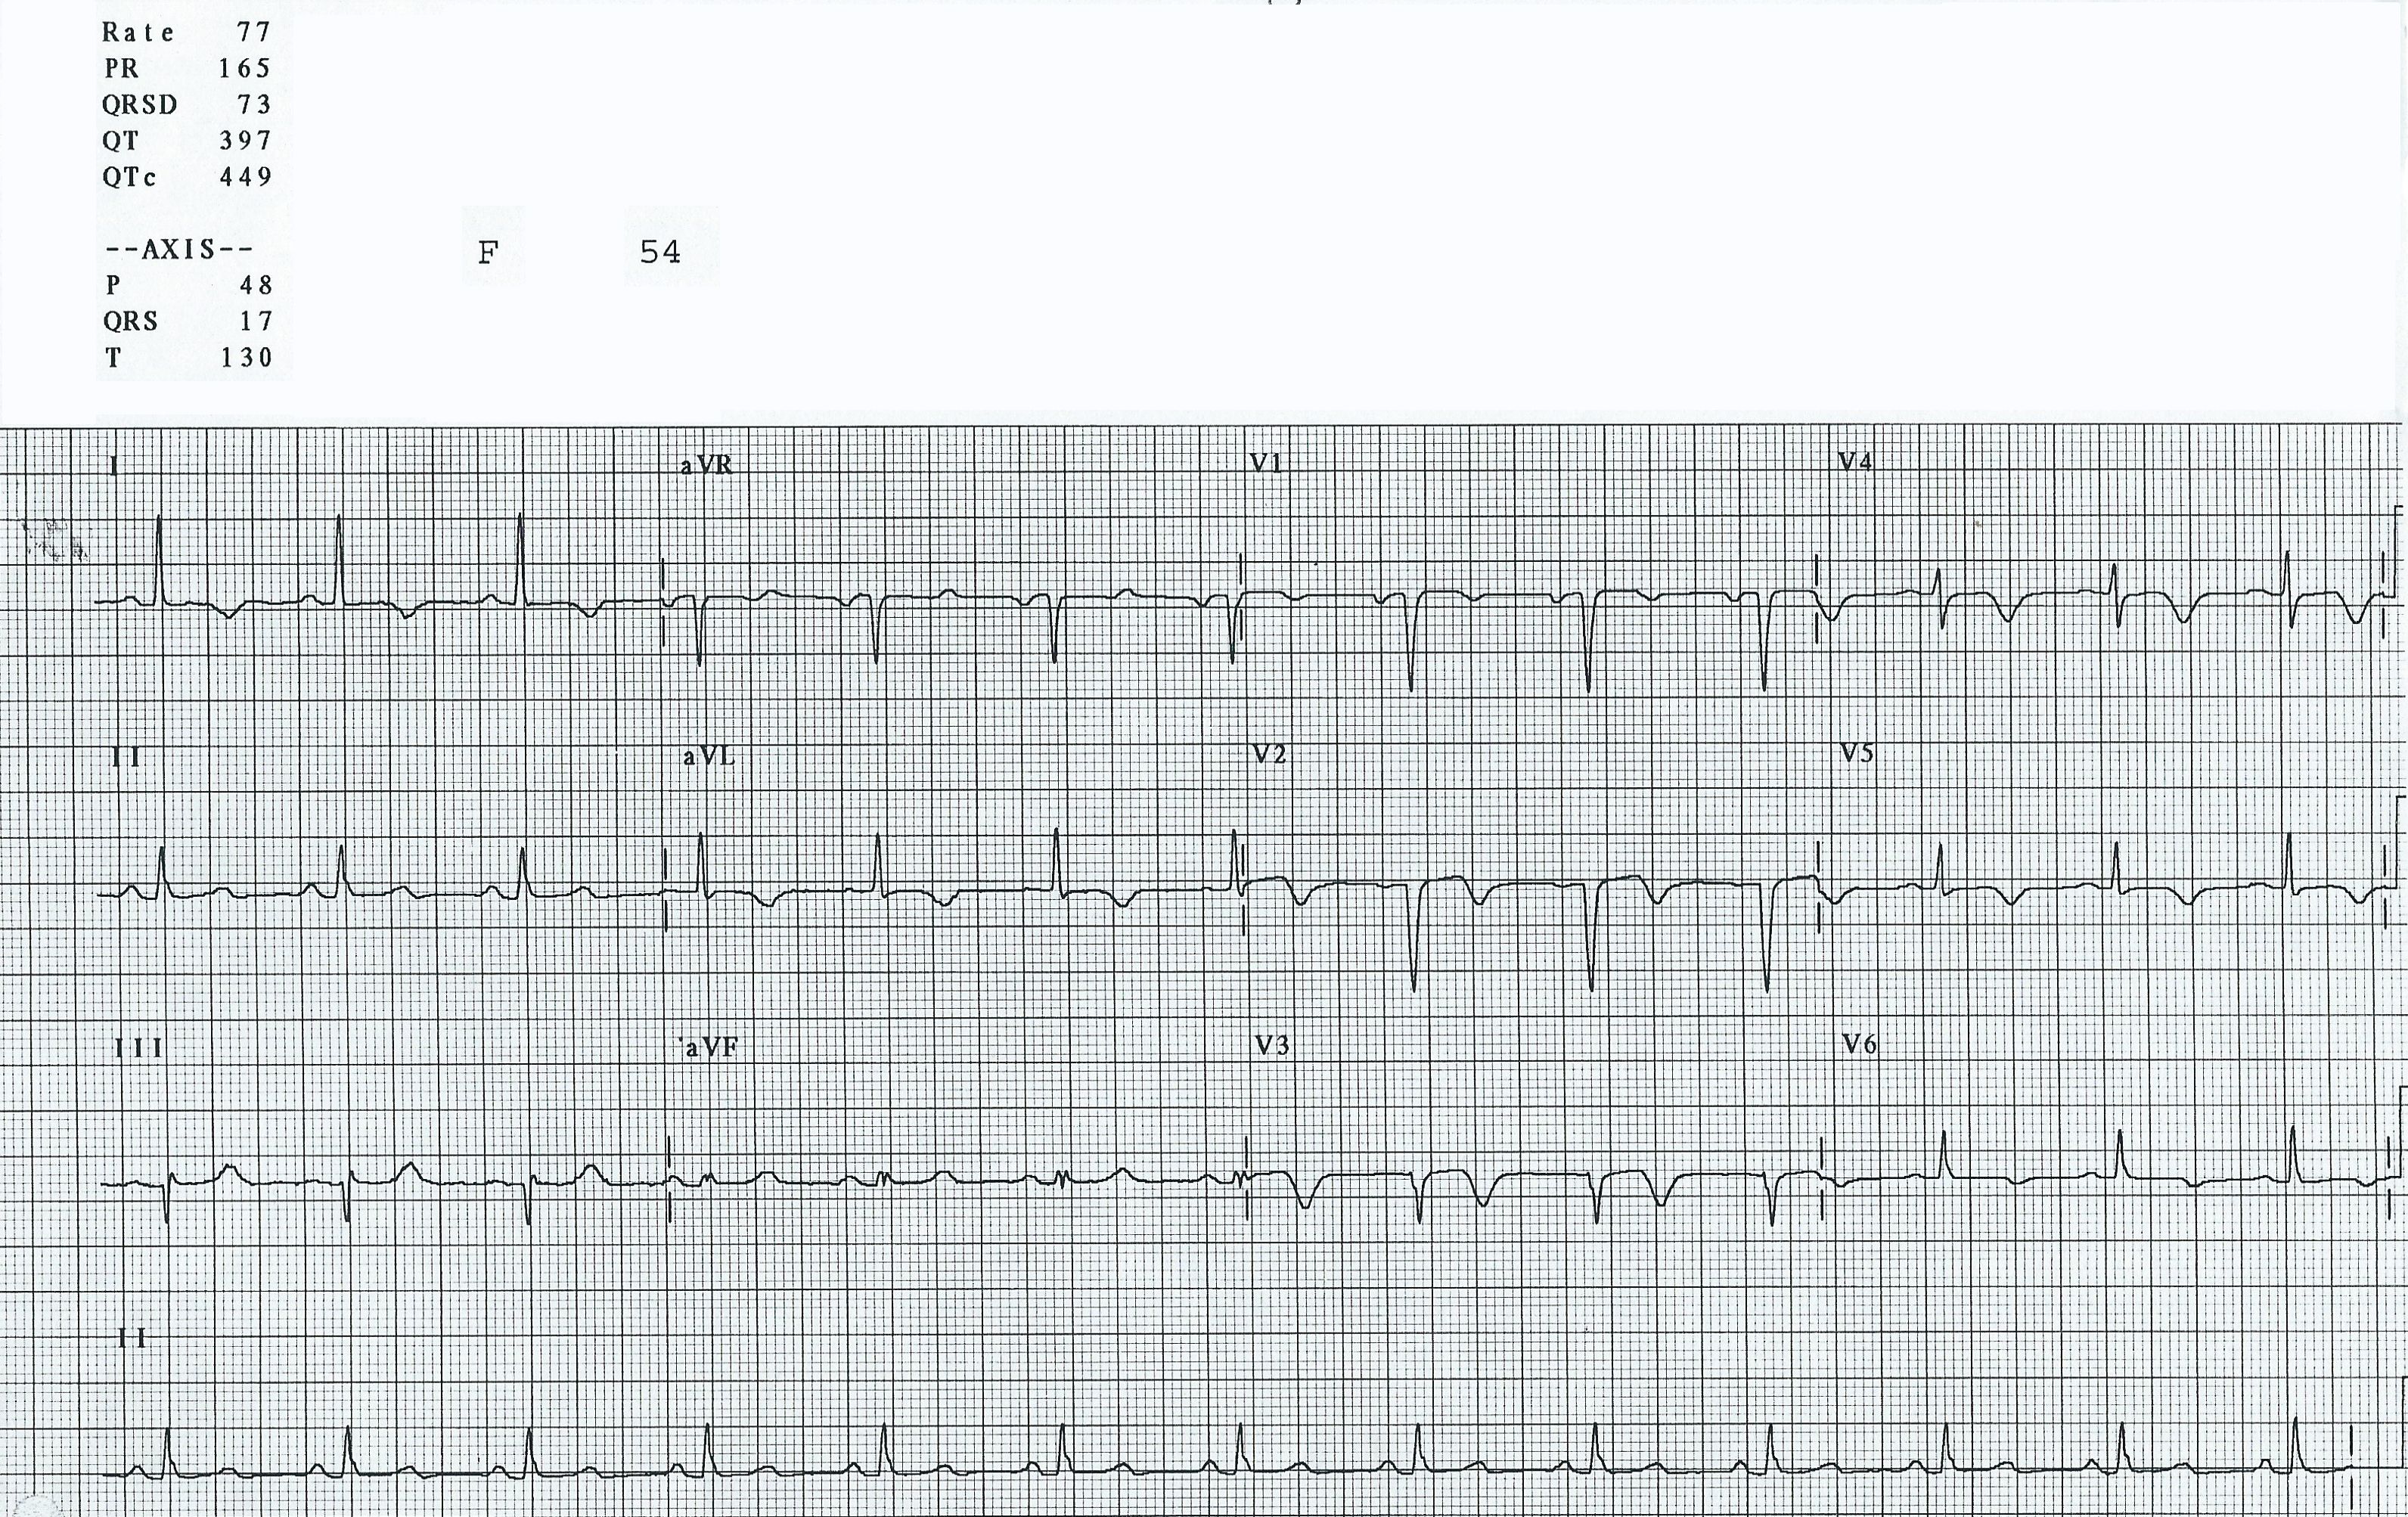
Recent M.I.

This ECG is from a 54-year-old woman who had an M.I. one week prior to this tracing.  She did not receive interventional treatment, as it was not available where she lived when this happened years ago.  Her ECG shows the signs of healing injury, as well as probable permanent damage. 

Where was this M.I.?      The affected leads are all of the precordial leads (V1 through V6), as well as I and aVL.   The precordial leads reflect the anterior and low lateral walls of the heart, and Leads I and aVL show us the high lateral wall.  This area is perfused by the left coronary artery, and she had a proximal lesion. 

What ST and T wave changes are present?    All of the leads listed above show a flattening of the ST segments.  While they are no longer elevated (the acute injury is over), they are flat and almost convex upward.  This shape is usually abnormal, and it has persisted even though the acute injury is subsiding.  The T waves in the anterolateral leads are all inverted.  This represents reperfusion of the injured tissue.  Whether the offending clot is removed by invasive procedure, thrombolytic drugs, or natural degradation, the tissue that is still alive will reperfuse. 

Dawn's picture

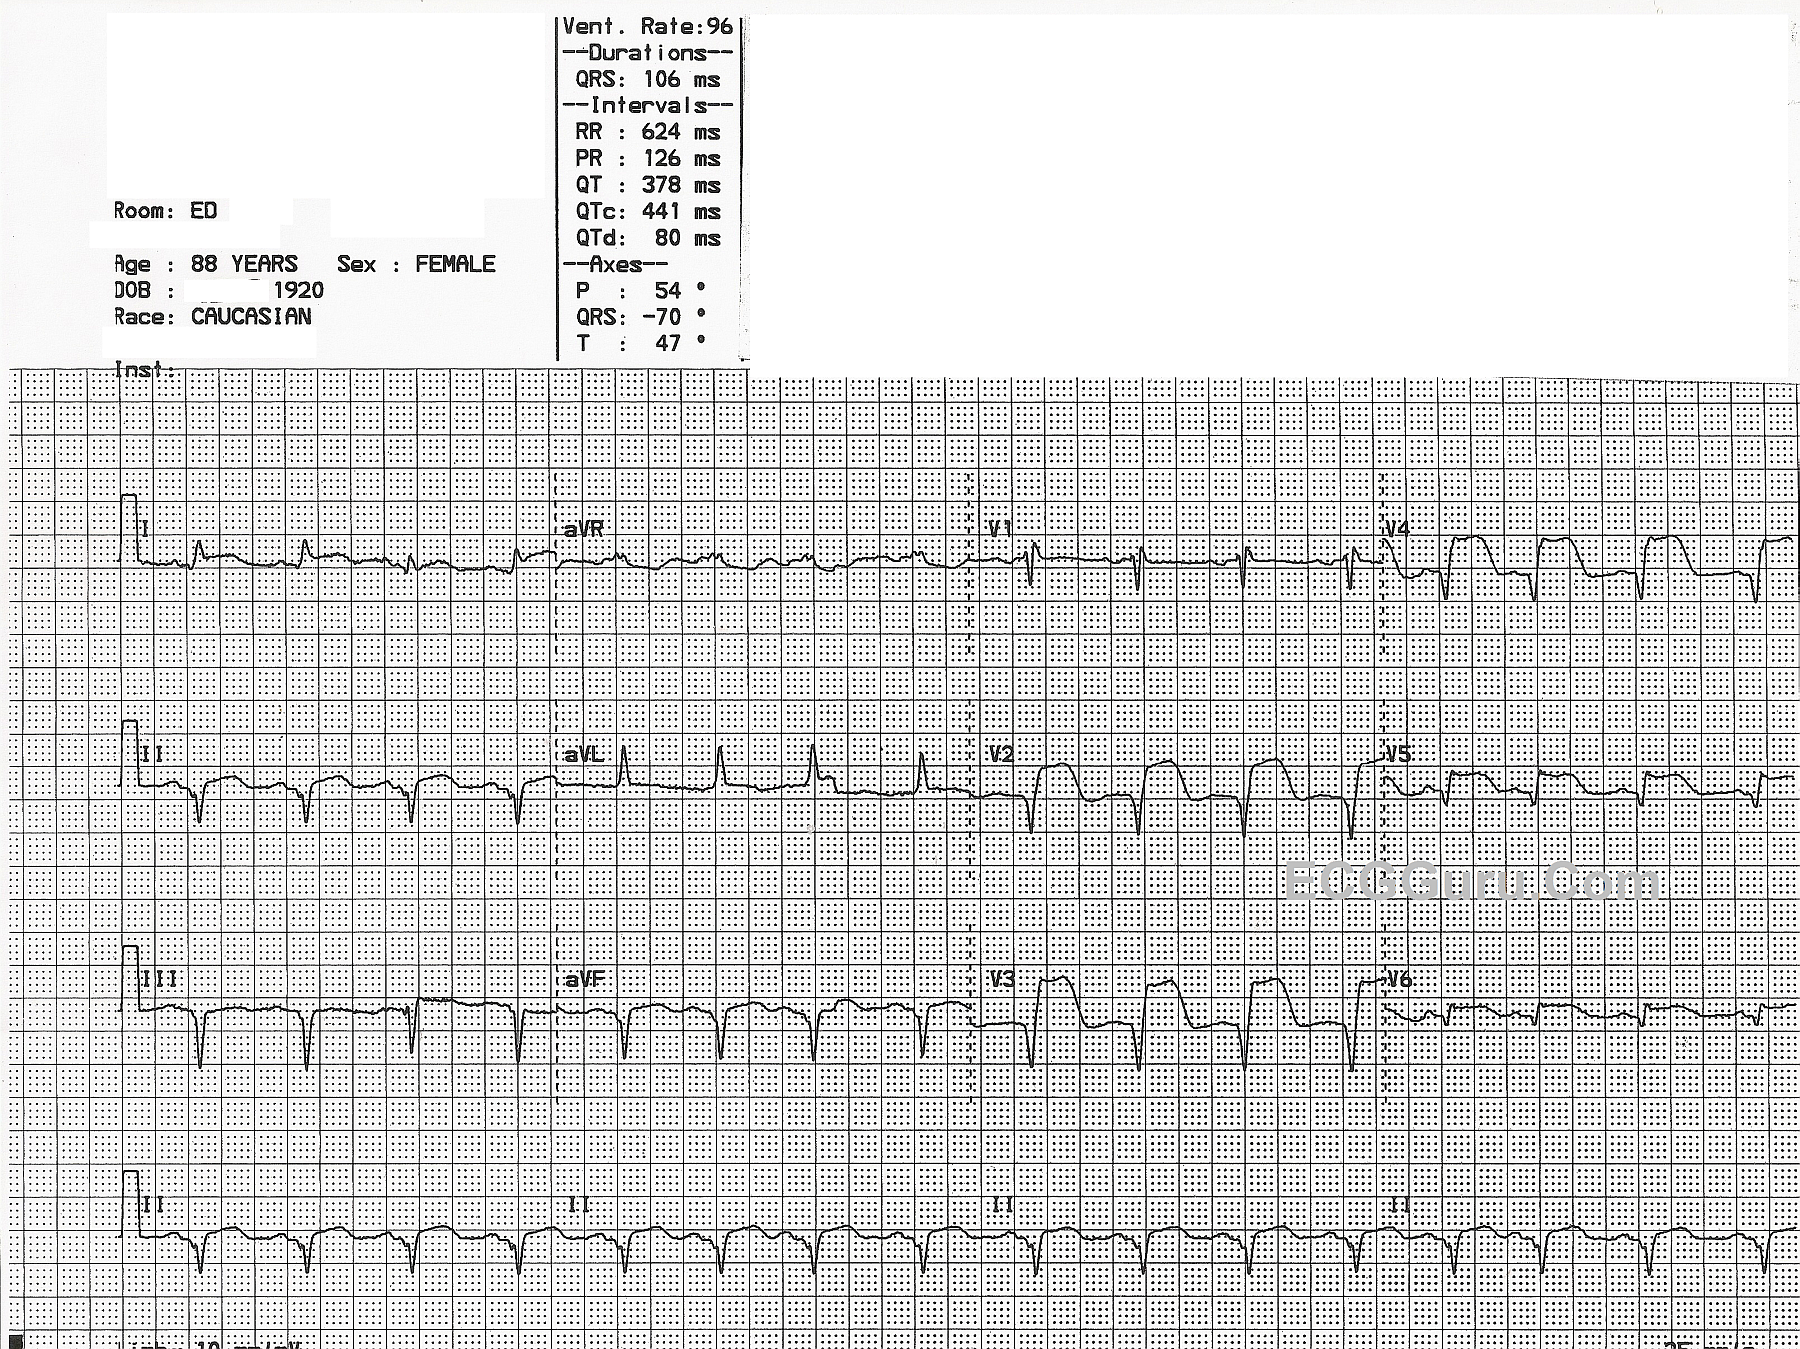
Extensive Anterior Wall M.I. With Recent Inferior Wall M.I.

This 88-year-old woman was brought to the Emergency Department in cardiogenic shock.  Very little is known of her past medical history, but it was relayed to the EMS responders that she had been ill for about four days, when she became much worse.

This ECG shows a large, acute anterio-lateral wall M.I., as evidenced by the ST ELEVATIONS in V2 through V6, Leads I and aVL.  To make matters worse, there are PATHOLOGICAL Q WAVES in Leads V2 through V6.  Pathological Q waves indicate areas of necrosis.  Because the myocardium facing the positive electrode is not electrically active, we "see through" the dead tissue to the myocardium on the opposite side of the heart.  Pathological Q waves could be thought of as "reciprocal R waves".  This represents a great deal of dead myocardium, which will be akinetic - not moving.

To make matters worse, she has pathological Q waves in the INFERIOR WALL as well, in Leads II, III, and aVF.  Her ST segments in those leads are flattened and possibly slightly elevated, but not much.  There are no reciprocal ST depressions in I and aVL, because they are affected by the anterior - lateral wall M.I., and are elevated.

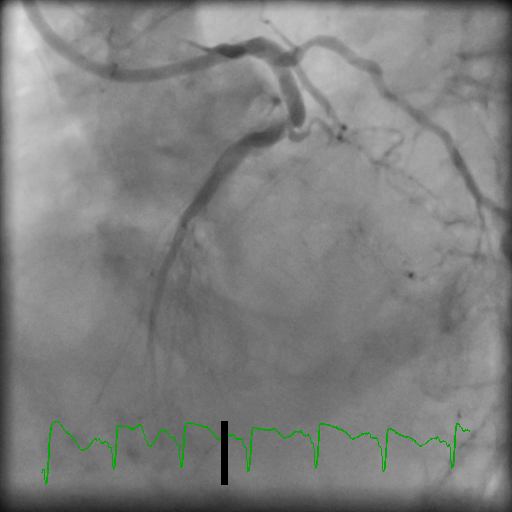
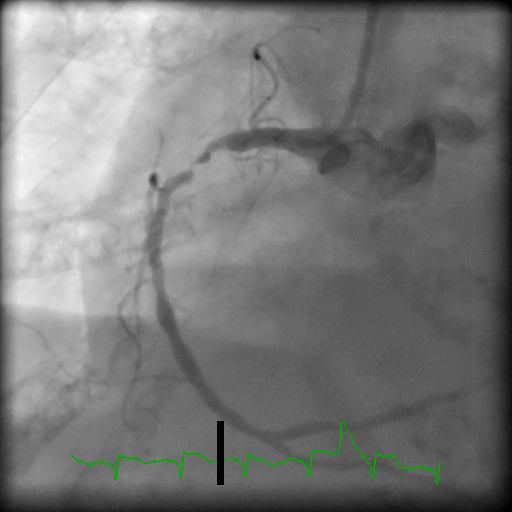
The accompanying photos show her left coronary artery angiogram indicating severe coronary artery disease and a "missing" left anterior descending artery.  This is due to a proximal lesion that occurred around the area of the first diagonal artery, cutting off blood flow to a very large part of her anterior-lateral wall.  The photo of the right coronary artery shows a very tight lesion which is allowing some blood to pass.  The Interventionalist felt that this represented a resolving 100% occlusion (remember, she had been sick for four days).  As the blood clot broke up, blood flowed again, lowering the ST segments.  Unfortunately, permanent damage had already been done, and she had Q waves in the inferior wall also.  This leaves very little of her heart beating, and it is easy to understand why she presented in shock.  She suffered cardiac arrests several times during the procedure, and was managed with a balloon pump and ventilator.

Unfortunately, this type of injury is not survivable, and she died in the CVICU a few hours after her procedure. She contributes to our education by demonstrating the cumulative effects of M.I., especially when permanent damage occurs.  For a look at her ventriculogram, to understand the devastating effects of these injuries, go to our You Tube channel.


Dawn's picture

Acute Anterior-lateral M.I. With Right Bundle Branch Block and Left Posterior Fascicular Block

This ECG was obtained from a patient who suffered an occlusion of the left main coronary artery.  ST elevation is seen in Leads V1 through V6, as well as I and aVL.  This is an indicator that the circumflex artery is included in this M.I., and the occlusion is above the bifurcation of the LM and the circ.  The patient also has a right bundle branch block and a left posterior fascicular block.  This bi-fascicular block can be a dangerous complication of acute M.I., as two of the three main bundle branches are no longer functional.

The ECG shows typical ST depression, probably reciprocal to the elevation, in the inferior leads.

The right bundle branch block is diagnosed by the following criteria:  1) Wide QRS;  2) Supraventricular rhythm; and 3) rSR' pattern in V1 with Rs with a wide little s wave in Leads I and V6.

The left posterior fascicular block is diagnosed by right axis deviation and by ruling out other causes of right axis deviation.  In RAD, Lead III will have a taller positive ( R ) wave than Lead II, and a negative Lead I.

This type of occlusion is often called the "Widow Maker", and requires very rapid intervention to restore blood flow and prevent complicatons.  If there is good news, it is that there are no pathological Q waves, which would indicate necrosis, and this patient was taken quickly to a full-service cardiac center with interventional cath labs and open heart surgery available.

Dawn's picture

Anterior Wall M.I. With Previous Inferior Wall M.I.

This ECG illustrates an acute anterior wall M.I. in a patient with a previous history of inferior wall M.I.  The anterior wall M.I. can be seen in the classic signs in V1 through V6:  ST elevations with coved upward shape (tombstones), T waves inverting beginning around V2 and continuing through V6, and pathological Q waves in V1 through V6.

The patient had a history of previous inferior wall M.I., unknown age.  This is normally seen in Leads II, III, and aVF.  The first two complexes on the strip are wide QRS complexes without associated P waves, presumably ventricular.  It is impossible to know from this ECG whether the first complex is a PVC or escape beat, but the second appears to be escape.  So, to evaluate the ST segments, T waves, and pathological Q waves in the inferior wall, all we have are aVF and the Lead II rhythm strip at the bottom.  These show pathological Q waves (necrosis), and some slight elevation of ST, with coving or horizontal flattening.  From this, we know there is damage in the inferior wall, but the age of the M.I. is undetermined.

This patient went to the cath lab, and received angioplasty with stenting of the proximal left anterior descending branch of the left coronary artery.

Dawn's picture

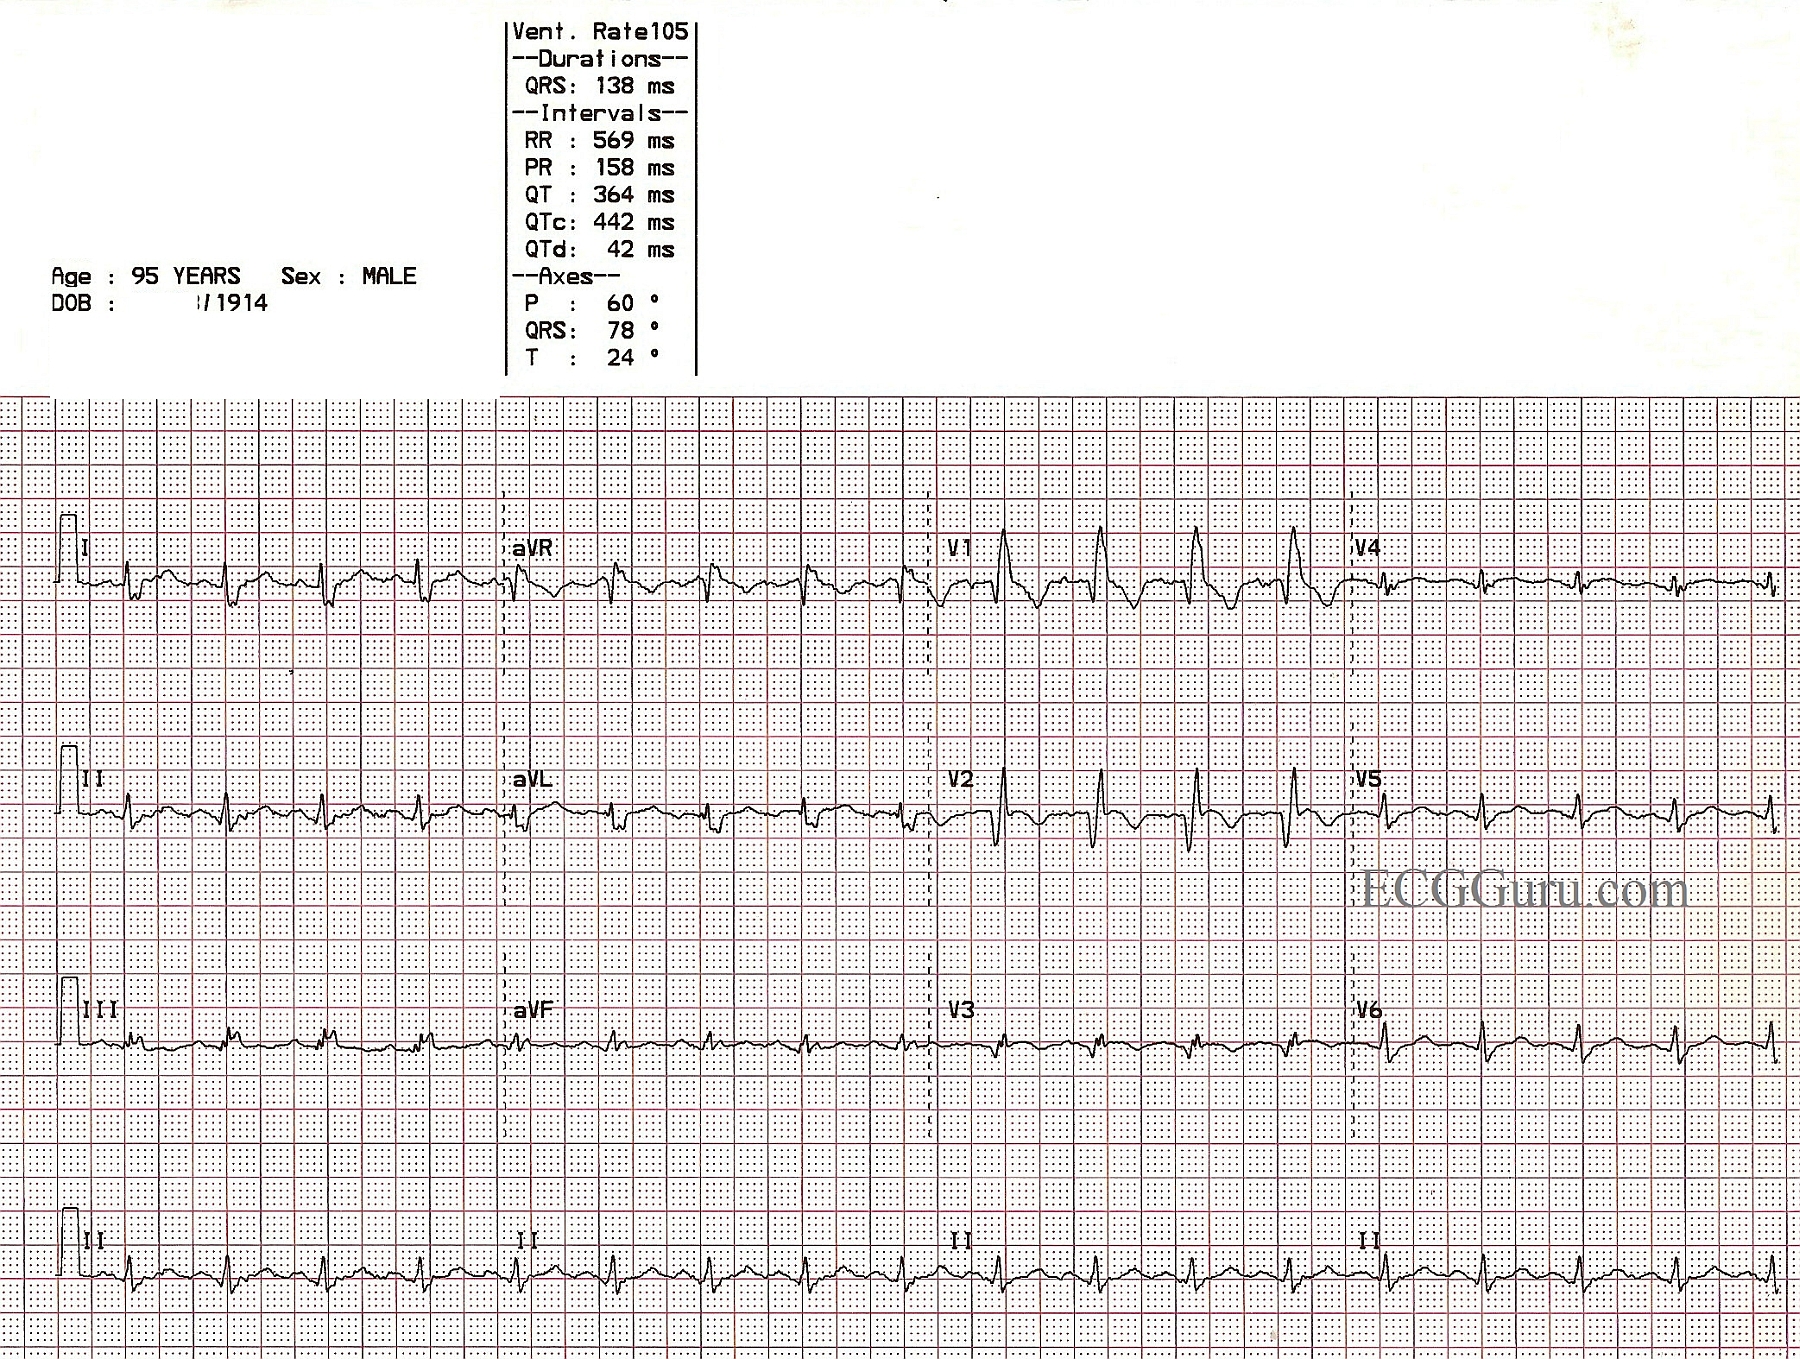
Recent Anterior-Septal M.I. With Right Bundle Branch Block

This is an ECG from a 95 year old man who was recovering from an anterior-septal wall M.I.  Other clinical data for this patient has been lost, except that he suffered a new right bundle branch block during this M.I.  The ECG shows pathological Q waves in V1, V2, and V3, consistent with permanent damage (necrosis) in the anterior septal wall.  The ST segments in those leads are coved upward.  Even though the J points are not elevated, this ST segment shape suggests recent injury.  The classic RBBB pattern is present:  wide QRS, rSR' pattern in V1, and wide little s waves in I and V6.  It is not known why the overall voltage is low in this patient.

Dawn's picture

AWMI With Recent IWMI

This 88 year old woman had been sick for several days, but had not sought treatment. Her family found her nearly unresponsive and called 911. She presented to the Emergency Department as a STEMI Alert, and was in cardiogenic shock, with very poor perfusion. The ECG from the ED shows a large antero-lateral M.I., with ST elevation in V2 through V6, and also I and aVL. In addition, there are pathological Q waves, indicating necrosis, in the precordial leads, V2 through V6. The inferior wall leads, II, III, and aVF, also have pathological Q waves and abnormally shaped ST segments - no longer distinctly elevated, but coved upward.

This is a good tracing to teach students about Q waves and "old", "new", and "recent" M.I., and also about the clinical effects of hypokinesis or akinesis of the ventricles.

Unfortunately, this patient suffered a cardiac arrest in the cath lab while having her LCA reperfused with balloon angioplasty. She was resuscitated, on a ventilator and intraaortic balloon pump, and admitted to the CVICU, where she passed away within a few hours.

You will find photos from her cardiac cath in the Other Instructor Resources section, labelled as patient AW103. Click here for RCA Image, LCA Occluded Image, LCA Angioplasty Image.  Videos of her ventriculogram and left coronary artery angiogram can be found in the Resources section of this website.

Pages

All our content is FREE & COPYRIGHT FREE for non-commercial use

Please be courteous and leave any watermark or author attribution on content you reproduce.