Dawn's picture

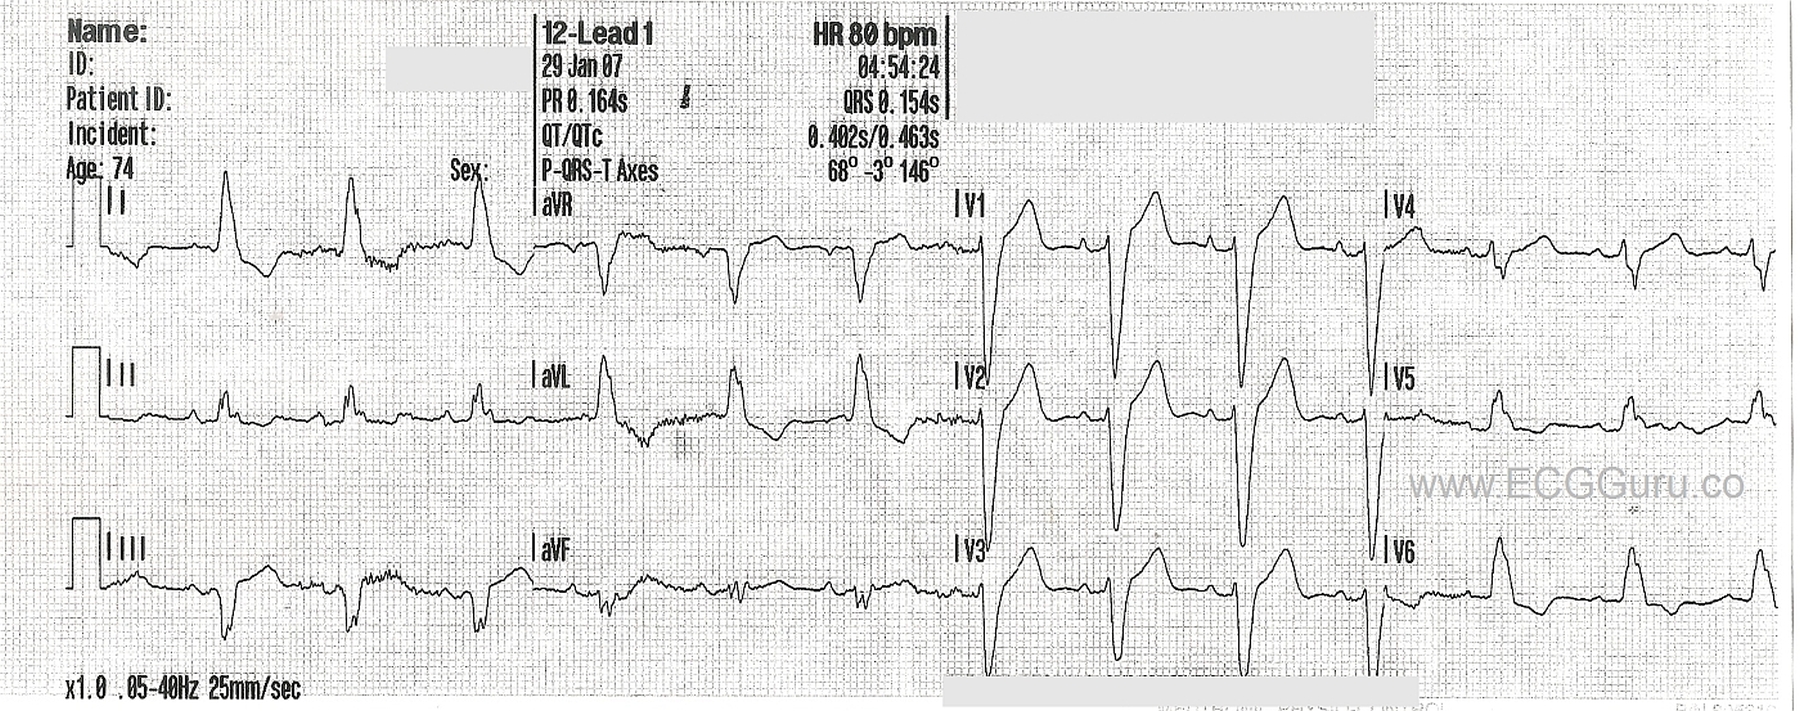
This ECG shows a “classic” left bundle branch block pattern. 

The ECG criteria for left bundle branch block are:

·        Wide QRS (.12 seconds or greater)

·        Supraventricular rhythm (ventricular rhythms do not travel via the LBB)

·        The QRS in V1 is negative, and the QRS in Leads I and V6 are positive. 

The left bundle branch (LBB) can be blocked permanently, temporarily, intermittently, or in the because of a fast rate.  When the LBB is blocked, conduction proceeds from the AV junction down the right bundle branch, depolarizing the right ventricle.  The impulse travels from the right ventricle across the left ventricle, cell by cell.  Conduction is slower this way, and there is asynchrony of the ventricles. This slow conduction and asynchrony of the two ventricles causes widening of the QRS complex.

NOTE:  It is "normal" for wide-complex rhythms to have ST segment elevation in leads with negative QRS complexes and ST depression in leads with positive QRS complexes.  This can make it a bit difficult to determine the ST changes of acute M.I. 


Rate this content: 
Average: 5 (2 votes)

Comments

ekgpress@mac.com's picture


As per Dawn  this is an example of typical LBBB (Left Bundle Branch Block). I'll add a few points to Dawn's comments.
  • There is lots of baseline artifact. Despite this  we can clearly establish normal sinus rhythm and QRS widening with typical LBBB morphology (http://tinyurl.com/KG-Blog-11 ).
  • There is also "fragmentation" of the QRS complex in a number of leads. This is best seen in this tracing by the notch produced in the monophasic R wave seen in lead II  and, the obviously notched complex in aVF  and, the delay in the downslope of the S wave in V4. Among the names attributed to such notching are "Cabrera's sign" (when notching occurs in the upslope of the S wave in V3,V4) and "Chapman's sign" (when notching is in the upslope of the R wave in leads I or aVL). The thought is that such notching represents disorganization of the typical depolarization path expected with LBBB, and therefore indicates that the patient has had infarction. Sensitivity and specificity of these signs is suboptimal  as conditions other than infarction (ie, cardiomyopathy) may be the cause. My preference is to label this alteration in QRS morphology as "fragmentation"  and to simply be aware that it may be seen in patients who in addition to a conduction defect also have infarcted at some point.
  •  Note P wave morphology in this tracing! It is unusual to see a peaked P wave as tall as we see in lead V1. In the absence of P wave notching (which often suggests intra-atrial conduction defect the presence of a fairly tall, peaked P wave in V1 or V2 (as we see here) suggests RAA (Right Atrial Abnormality)  See http://tinyurl.com/KG-Blog-75.  LBBB rarely occurs in adults who do not have underlying structural heart disease  so seeing indication of atrial abnormality suggests possible cardiomyopathy.
  •  It is common for patients with LBBB to have LVH  but the presence of the conduction defect makes ECG detection of LVH difficult. That said  presence of a very deep S wave in V1,V2 or V3 (ie, an S wave deeper than 25-30mm in any of those leads) strongly suggests there is LVH. While the S waves in V1,V2 here are deep  they don't quite meet this voltage criterion. This does not mean that this patient doesn't have LVH (since statistically most LBBB patient do have LVH but only that we can't "call it" based on ECG criteria ...
  •  Finally  it is good to become comfortable with the ST-T wave changes expected with LBBB. We find the easiest way to assess this  is to remember that when there is typical LBBB (or typical RBBB that the ST-T wave should be directed opposite to the direction of the last QRS deflection in each of the 3 KEY leads (See Figure 3 in my ECG Blog #11 http://tinyurl.com/KG-Blog-11 ). We think of the 3 "Key" leads for BBB as leads I, V1 and V6. Note how in this case the ST-T wave in leads I,V6 is negative and opposite to the monophasic R wave in these leads. By the same token, the upright ST-T wave in lead V1 is opposite the deep terminal S wave in this leads. Therefore  ST-T waves are directed in these 3 leads the way they should be when typical LBBB is present. Deviation from this expected direction of ST-T wave deflection would suggest ischemia/infarction.
  •  So there is ST elevation in this tracing (in leads V1,V2,V3 but it is not excessively elevated given the presence of LBBB (ie, the amount of J-point ST elevation in each of these leads is not more than 25% of the depth of the S wave in that lead  See http://tinyurl.com/modified-Smith-Sgarbossa ). Therefore  there is no ECG evidence of acute coronary occlusion in these anterior leads.
  •  Diagnosing acute coronary occlusion in the presence of LBBB is clearly challenging. And there is ST elevation in lead III here! That said  neither of the other two inferior leads (II,aVF) show ST elevation and ST-T wave morphology qualitatively otherwise does not appear atypical for LBBB  such that my hunch would be that there is nothing acute going on in this case. That said — we do not know full details in this case ...
For those wanting review of the Basics of Bundle Branch Block - Please check out my 17-minute ECG video on this subject  GO TO  www.bbbecg.com 


Ken Grauer, MD  www.kg-ekgpress.com   [email protected] 

All our content is FREE & COPYRIGHT FREE for non-commercial use

Please be courteous and leave any watermark or author attribution on content you reproduce.