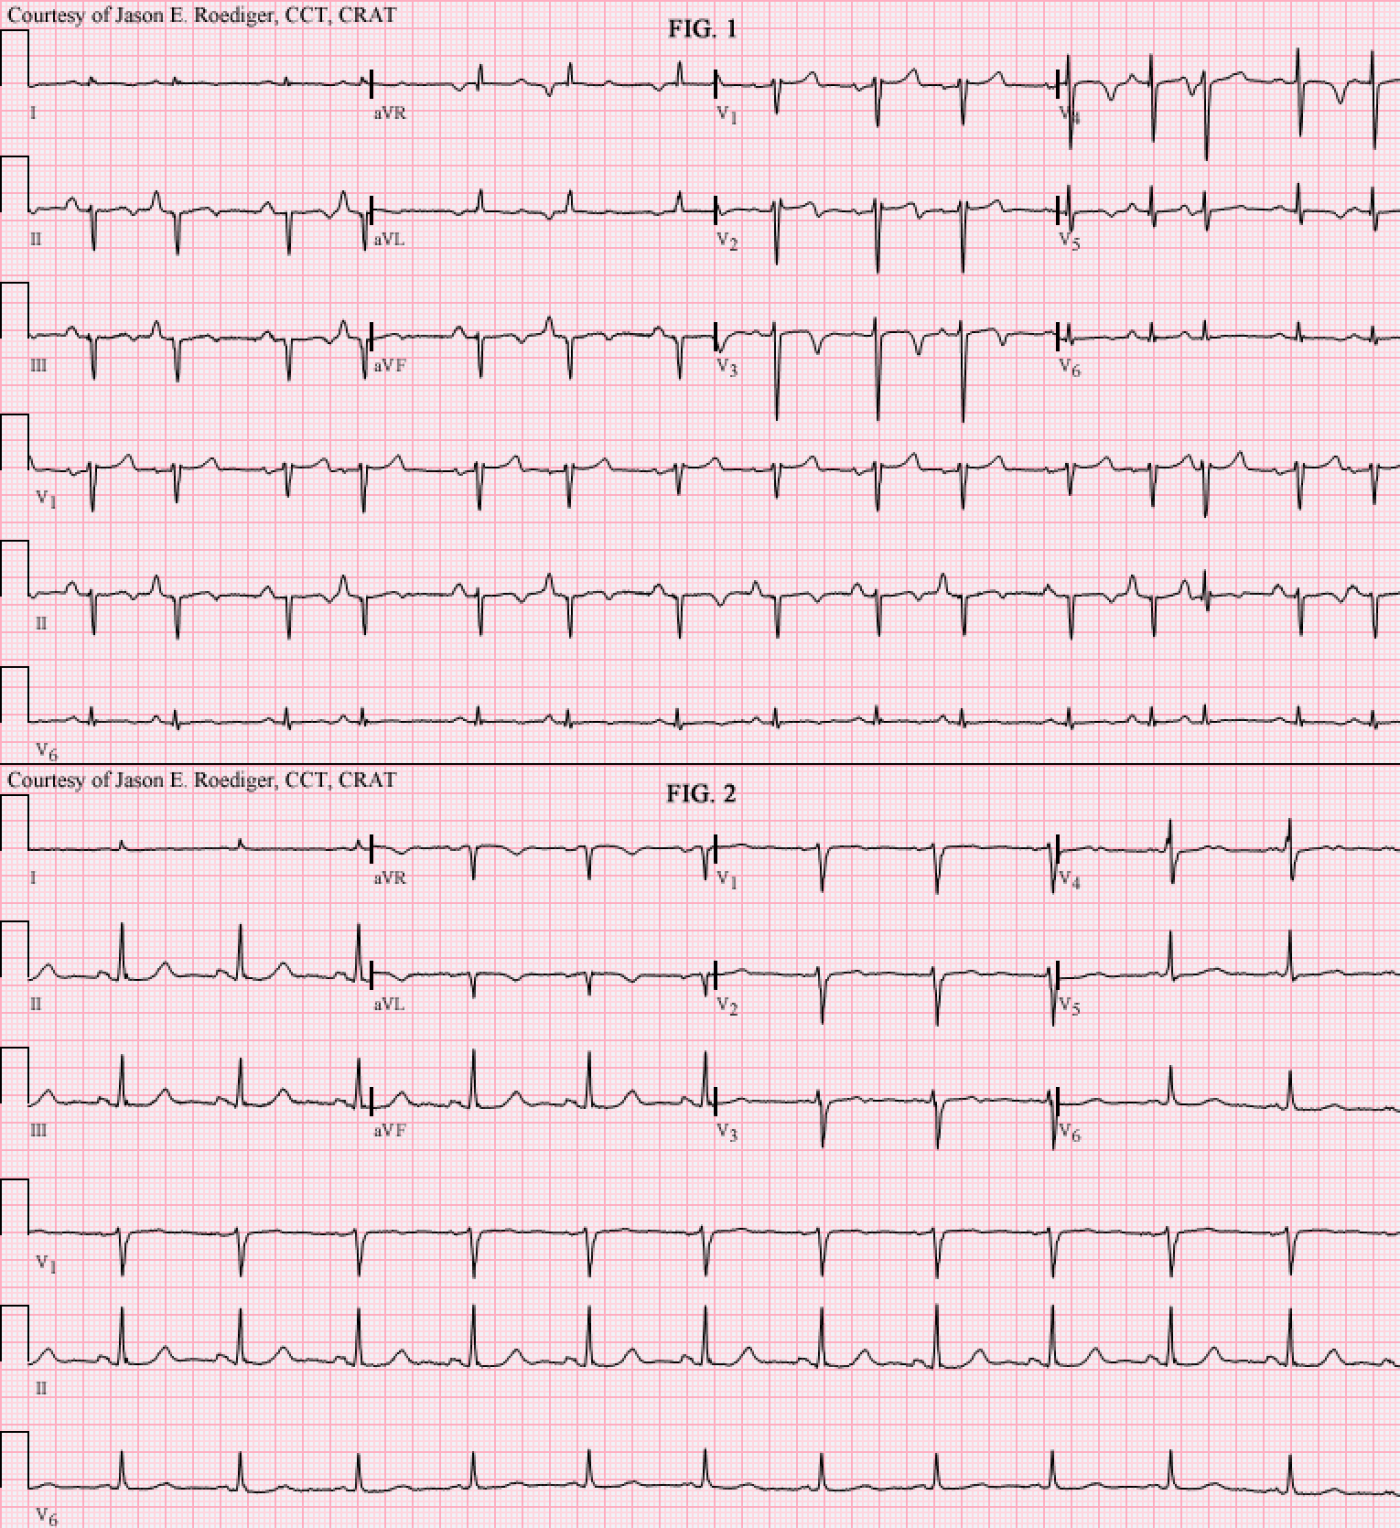
Two more ECGs classified under the general heading: “Tracing suggestive of ____ ”. I like ECGs that strongly favor a very specific clinical disorder.
Recently I performed these ECGs on two different patients. They were both recorded a little more than an hour apart and exemplified a common electrocardiographic theme I noticed during that work shift.
The primary goal of this week’s blog is not to determine the name of each ECG’s rhythm but rather what each ECG is virtually diagnostic of.
This sign is commonly referred to by one of two names: (1.) Either by the lead that it appears in or (2.) eponymously named after the doctor who is credited with first describing it.
To date, the ECG machine's computer is not programmed to recognize this particular sign/pattern nor will it make the suggestion to consider this possibile clinical disorder in it's statements printed at the top of ECG. Hopefully, in the future, manufacturers of ECG machines will add this algorithm to their computer's diagnostic statements.
Patients’ clinical data:
- Fig. 1 (Top tracing): 61-year-old black man, underweight, active smoker (long history of tobacco abuse), and persistent cough. The challenge for me was to obtain an artifact-free tracing in between coughing fits. When asked, this patient denied having this medical condition that his provider had diagnosed him with.
- Fig. 2 (Bottom tracing): 70-year-old white man, active smoker (long history of tobacco abuse). When asked, this patient also denied having this medical condition that his provider had diagnosed him with.
Personally, I think that a certain degree of denial goes hand-in-hand in this patient population when confronted with their self-destructive vices.
So, both men have similar (albeit limited) histories and a similar clue on their ECGs. In each of the two ECGs, there is a single lead where the waveforms look nearly identical.
- Hint # 1: The answer to the clinical disorder is a 4-letter acronym.
- Hint # 2: The only thing that superficially mimics this pattern is simultaneously switching the arm cables with their respective leg cables on the same side (i.e., RA reversed with RL and LA reversed with LL)
Questions:
- (1.) Which one of the 12 individual leads am I referring to and . . .
- (2.) What clinical disorder is that lead a highly specific marker of?
-

- jer5150's blog
- Log in or register to post comments
All our content is FREE & COPYRIGHT FREE for non-commercial use
Please be courteous and leave any watermark or author attribution on content you reproduce.


Comments
I believe it is known as the
I believe it is known as the "Lead I Sign", although I can't recall who the doc is that it is named after. It has been shown, albeit retrospectively, to be very specific for COPD. The criteria is informally given as "very low voltage Lead I", but I do believe there is a formal millimeter criteria available for each of the P, QRS, and T waves.
Christopher
sixlettervariable.blogspot.com
ems12lead.com
INTERPRETATION:
Both of these patients have “Smoker’s Lung”. Fig. # 1 was diagnosed with chronic bronchitis which is a type of COPD. Fig. # 2 was diagnosed with COPD. Note the poor r-wave progression in the precordial leads of Fig. # 1. The only real clue, suggestive of COPD, in Fig. # 2 is the disproportionately low P-QRS-T voltage in lead I.
Whenever Lead I appears nearly isoelectric, one must consider the possibility that the arm cables have accidentally been reversed with their respective leg cables on the same side.
Despite this sign being a highly specific indicator of COPD, neither one of these ECGs prompted the computer to suggest the statement of: “consider pulmonary disease” or “pulmonary disease pattern”.
The “Lead I sign” is largely credited as being described by the late
Dr. Leo Schamroth from Johannesburg, South Africa. It later came to be also known as “Schamroth’s sign” or “Schamroth pattern” which was an eponymous term popularized by Dr. Bill Nelson.About 4 years ago I was performing a 12-lead ECG on a patient in the Surgical Intensive Care Unit (SICU) and I asked the assigned nurse if his patient had COPD. The nurse confirmed my suspicions and with a very surprised expression on his face, he inquired: “You can tell that just from glancing at his ECG?!” to which I replied “Yes, it’s obvious, if you know what clue to look for”. I went on to explain this lone clue to him. Patient’s are also amazed when you can recognize their COPD in the waveforms of their ECG.
Schamroth’s Sign Criteria: Isoelectric P wave in lead I combined with a very small QRS complex of less than 1.5 mm total deflection and a T wave of less than 0.5 mm in lead I. (1)
Sources / Reference:1.) http://www.sma.org.sg/smj/4004/articles/4004cr4.html
2.) http://www.netdoctor.co.uk/diseases/facts/smokerslung.htm
3.) http://nelsonsekgsite.com/additional/NNA SITE-Additional Examples-Patterns & Eponyms.ppt
4.) http://nelsonsekgsite.com/instruction/NNA SITE-Patterns & Eponyms.ppt
Jason E. Roediger - Certified Cardiographic Technician (CCT)
[email protected]
Don't Forget to Look for Other Signs of Pulmonary Disease!
This interesting column by Jason brings up the important question of how to assess an ECG for the likelihood of pulmonary disease. As another Marriott disciple — I was glad to see Jason reintroduce the long forgotten (by many in the field) Schamroth sign that I've regularly looked for over decades. Jason's post reminds me that I need to add this sign to the next edition of my ECG Pocket Brain.
Ken Grauer, MD www.kg-ekgpress.com [email protected]