
Submitted by Dawn on Tue, 08/20/2019 - 20:48
The Patient This ECG was obtained from a 28-year-old woman who was found in her home, unresponsive. She was hypotensive at 99/35. No one was available to provide information about past medical history or the onset of this event.
Before you read my comments, pause to look at the ECG and see what YOU think. We would welcome comments below from all our members!
The ECG This ECG is quite challenging, as it illustrates the helpfulness of ECG changes in patient diagnosis, and also points out how important clinical correlation is when the ECG suggests multiple different problems. Forgive me in advance, but there is a lot to say about this ECG.
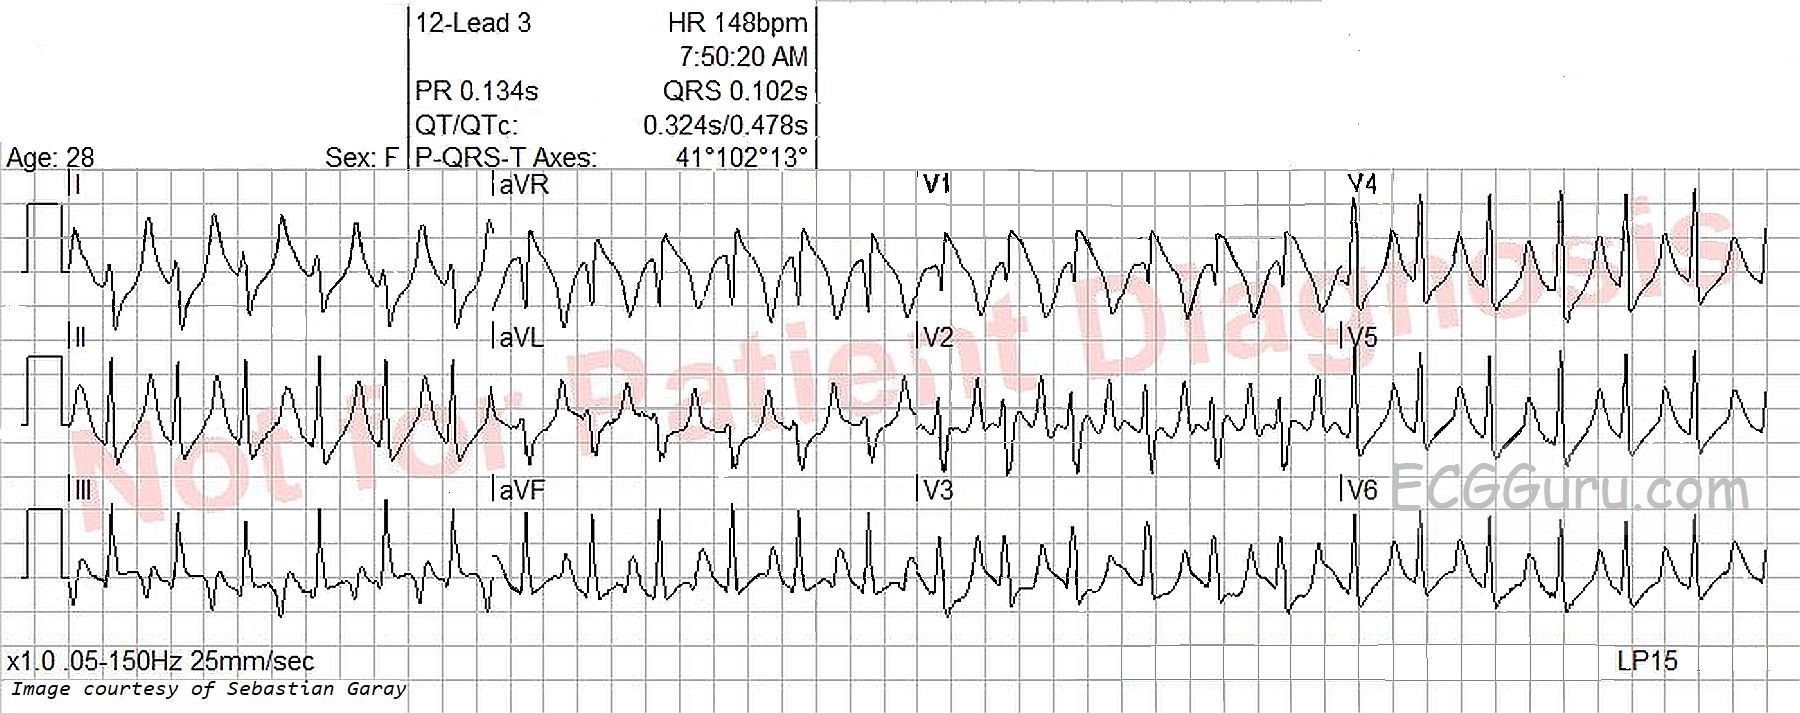
The heart rate is 148 bpm, and the rhythm is regular, although not perfectly. P waves are not seen, even though the ECG machine gives a P wave axis and PR interval measurement. The rate is fast enough to bury the P waves in the preceding T waves, especially if there is first-degree AV block. Differential dx: sinus tachycardia, PSVT, atrial flutter. The very slight irregularity points more towards sinus tachycardia. The rate of nearly 150 suggests atrial flutter with 2:1 conduction, but the only lead that looks remotely like it has flutter waves is V2. The lack of an onset or offset of the rhythm makes it difficult to diagnose PSVT with any certainty.
The ECG machine measures the QRS complex at .102 seconds (102 ms). I don’t believe this is correct, as the QRS has an additional wave due to right bundle branch block pattern, and the machine did not count this terminal wave. I measure the actual QRS duration at closer to .12 seconds (120 ms). The J point, or end point of the QRS complex, is difficult to see in most of the leads because of slurring from the QRS to the ST segment.
Differential dx: There are some signs of right ventricular failure on this ECG, but ECG is not 100% accurate for determining right heart strain. The ECG evidence must be confirmed by clinical correlation. In a young person with sudden onset of right heart failure signs, one must consider pulmonary embolus. Some, but not all, of the ECG signs that can be associated with pulmonary embolism are:
· Sinus tachycardia (44%)
· Right bundle branch block or incomplete RBBB (18%)
· Right ventricular strain: T wave inversion in right precordial leads and inferior leads (only present here in V1 and Lead III, which is often normal).
· Right axis deviation (16%). Present here, but not severe at around 100 degrees.
· S1 – Q3 – T3 the “classic” but not often present, sign of pulmonary embolism. The S wave in I may simply be the RBBB and the Q wave with T wave inversion may be a normal variant.
· Non-specific ST segment and T wave changes (50%)
· P pulmonale (we cannot see P waves)
There are also ST and T wave changes that resemble Brugada Syndrome, a genetic disorder of the sodium channel that can cause sudden death. Illness can unmask the ECG changes that point to Brugada syndrome, but also there are conditions that cause similar ECG changes without the patient actually having a channelopathy. The shape of the ST and inverted T wave in V1 here are “Brugada like”. In Brugada Syndrome, those changes are usually seen in V1 and V2.
The loss of P waves and the tall, peaked T waves with narrow bases are indicative of hyperkalemia. It is difficult to determine just from the ECG how far along the patient is in serum potassium levels, but widening of the QRS with loss of voltage is a dire sign. Because hyperkalemia can progress swiftly to a “sine wave” pattern, it is crucial to make the diagnosis and begin treatment as soon as possible. Usually, the serum K is high because the K has moved out of the intracellular space and entered the serum. Rather than remove K from the body, it is necessary to “push” it back into the cells, where it rightly belongs.
And, to make matters even more confusing, this ECG show signs of drug toxicity, specifically sodium channel blocker overdose. Tricyclic antidepressants and some antiarrhythmics fall into this broad category. Remember, this patient was found unresponsive, and we have no remote OR recent medical history. Everything is on the table. ECG signs of sodium channel blocker OD include:
· Sinus tachycardia
· Wide QRS complex
· Prolongation of the PR interval or QT interval
· Right bundle branch block
· Brugada pattern
Hospital Follow Up At this time, we have only a preliminary follow up report. Notably, this young woman was found to be in diabetic ketoacidosis, with a blood glucose level of 1,332 mg/dL! As a result, she was also hyperkalemic, with a serum potassium of 8.2. The severe dehydration and acidosis of DKA cause sinus tachycardia.
Thanks to Sebastian Garay for donating this interesting ECG.
Related Terms:
Rate this content:
All our content is FREE & COPYRIGHT FREE for non-commercial use
Please be courteous and leave any watermark or author attribution on content you reproduce.
Comments
A Funky Rhythm – Peaked T Waves – and RBBB-plus in V1
As is usually the case with tracings contributed by Sebastian Garay — “C’est bizarre” (ie, This one is a doozy! ). All we are told is that the patient is a 28-year old woman who was found at home, unresponsive. This opens up a host of potential diagnoses.
The Rhythm — is unusual! As Dawn astutely detected — the rhythm is almost-but-not-quite regular. Using CALIPERS is essential for proceeding further — since there is not much difference in R-R intervals on this tracing. But IF you use calipers — you can verify my observation that there is a pattern to this rhythm! That is, every 3rd R-R interval is slightly longer! (ie, color-coded shorter BLUE vs slightly longer RED double arrows in my attached Figure). This regular-irregularity pattern of “group beating” essentially rules out sinus tachycardia — and makes me highly suspicious of Wenckebach exit block out of the AV node.
Proceeding further with description of the rhythm — I do not see clearly defined P waves, although (as per Dawn) — there may indeed be atrial activity in lead V2 (See regularly-occurring slanted RED lines at ~300/minute in lead V2). Although the QRS complex is wide — QRS morphology clearly resembles the supraventricular etiology of RBBB (qR in V1 + wide terminal S waves [within RED circles] in leads I and V6). Although AFlutter almost always manifests at least some sign of regular atrial activity in more than a single lead — I am at a loss to explain this rhythm any other way! AFlutter is the only rhythm producing regular atrial activity at an atrial rate close to 300/minute (which we seem to see in lead V2, albeit not in other leads) — and, it is common for AFlutter to manifest unusual patterns of group beating due to various conduction ratios resulting from multi-level Wenckebach block out of the AV node.
I suspect that in addition to the RBBB described above — that there is also a Brugada-1 pattern in lead V1 (within the BLUE rectangle). This is almost certainly a Brugada Phenocopy — which means that rather than a true Brugada “Syndrome” — we transiently see a Brugada-1 ECG pattern as the result of some other underlying cause — and that when this precipitating cause is corrected, the ECG will normalize. This is important clinically for risk assessment — since morbidity and mortality from Brugada-pattern ECGs is significantly less in patients with Phenocopy rather than the true “Syndrome”. (CLICK HERE to take you to 9:17 in in my 29-minute ECG video on Brugada ECG Patterns. IF you click on SHOW MORE under the video in the YouTube page — You’ll find a full linked Contents to all in this video).
In addition to RBBB — there is also marked RAD (Right Axis Deviation). Given rS morphology in lead I — and qR morphology in each of the inferior leads — this is consistent with a bifascicular block pattern of RBBB/LPHB (Left Posterior HemiBlock).
Finally — Moving to assessment of the ST-T waves — this is complicated because IF the rhythm is in fact AFlutter — atrial flutter activity may alter the appearance of the ST-T wave in any lead. That said — the predominant finding in virtually ALL leads on this tracing is tall, peaked and pointed T waves with a narrow base. To me, this appearance suggests significant hyperkalemia until you prove otherwise!
Of NOTE — hyperkalemia can produce numerous unusual ECG findings, that then “go away” once the hyperkalemia is corrected. Hyperkalemia is a common cause of Brugada Phenocopy — so repeating this ECG after hyperkalemia is corrected might result in complete resolution of the Brugada-1 pattern we see in lead V1. Hyperkalemia might also produce marked axis deviation (as we see from the predominantly negative QRS in lead I).
BOTTOM LINE: As per Dawn — clinical correlation is essential to this case. Given that this is a younger adult who was found unresponsive — we need to add Sodium Channel Blocker Overdose (given tachycardia, QRS widening with right axis, terminal R’ in aVR and Brugada-1 pattern in lead V1). We also need to add other causes of unresponsiveness that might produce marked hyperkalemia (with acute DKA being high on that list).
Follow-Up: As noted by Dawn — Sebastian confirmed DKA with serum K+ = 8.2 mEq/L at the time this tracing was obtained. I’d LOVE to see a follow-up ECG after DKA resolves, after serum K+ corrects, and when the patient has woken up.
Our THANKS again to Sebastian Garay for another SUPER contribution!
Ken Grauer, MD www.kg-ekgpress.com [email protected]
Dawn...
Dawn...
What a GREAT ECG and my thanks to Sebastian Garay for the opportunity to see this. Also, great discussions by YOU and Dr. Grauer.
First and most importantly, we are diagnosing this dysrhthmia (as well as the rest of the ECG) from a 12-lead ECG. Never - let me repeat that - NEVER - diagnose a dysrhythmia from a rhythm strip. The width of the QRS depends on the orientation of its vector in each lead. It is quite possible (I have examples that I use to trip up my students in my advanced ECG classes) that a wide QRS rhythm may have a vector orientation causing the terminal portion of the QRS in one or more leads to be essentially isoelectric. This will cause that lead to appear to have a normal, narrow QRS complex.
After reviewing the rhythm, intervals etc...
One of the first things that caught my eye was the QRS-T complexes in V1. It looks very much like a Brugada syndrome, but I was also immediately impressed that it wasn't. First, the patient is a 28 y/o female. That alone would be very, very unusual for a Brugada syndrome (not impossible, though). Second, the tall, narrow and sharply peaked T waves are so very characteristic of hyperkalemia. And, all cases of hyperkalemia with ST elevation that I have seen - except for ONE! - has looked very similar to the Brugada Type 1 changes in V1. One case was indeed essentially indistinguishable from an acute epicardial ischemia. So at this point I'm thinking hyperK+.
At this level of the serum K+, the patient's heart is likely experiencing a sinoventricular conduction; therefore, no obvious P waves.
Now to the altered consciousness. A systolic BP of 99 should not render anyone unconscious unless 1) it had just recovered from being 30/0, 2) her systolic BP is usually around 180, 3) there is a medication or drug on board or 4) there is a metabolic issue. I would hazard a guess that it wasn't either of the first two (but that would just be a clinical hunch) and would look at reasons 3 or 4. I've seen a number of Class I antidysrhythmic OD's during my time and they all presented with really wide QRS complexes (even some of the Class Ib when taken in overdose). That includes tricyclic antidepressants, also. Based on this ECG, I would put those drugs on the back-burner but that still doesn't R/O other recreational drugs. Check the pupils. If I weren't immediately impressed with any findings suggestive of drug overdose, then I would consider some sort of metabolic derangement. Of course, I'm already leaning heavily toward hyperK+, but other similar cases I've seen in the emergency department over a 40 yr career include hypercalcemia, diabetic ketoacidosis (of course), myxedema coma, central pontine myelinosis and acute adrenal insufficiency. I think a quick sniff of her breath would tell us the result here. Often in these patients, you can smell the ketones as you begin to approach them.
But based strictly on the ECG, I would first consider the sharply peaked T waves (nothing else creates narrow-based T waves that come to THAT sharp of a peak) which for me makes Brugada syndrome much less likely, the repolarization changes in V1 which also look exactly like the STE of hyperkalemia as well as Brugada syndrome but I strongly favor hyperK+ here, and the narrow QRS which is validated in all the leads and not just in one rhythm strip which makes Class I antiarrhythmic and tricyclic overdose much less likely. For me, the metabolic disorder (other than hyperK+) is not obvious on this ECG. I would have had to see the patient in person or else know her serum glucose and acid/base status as well as other electrolytes to verify that.
Quite honestly, I've seen hundreds of DKA's during my career (probably hundreds before I finished residency) but I do not recall having seen one with a K+ level THAT high.
That being said, please allow me to soap box a bit here. Nothing - absolutely nothing - in medicine and especially in electrocardiography is 100%. Recently, on various blogsites, I have seen some contributors criticized for making a statement because someone points out that THERE IS AN EXCEPTION TO THAT STATEMENT! OF COURSE there are exceptions! There is ALWAYS - and I mean ALWAYS! - an exception somewhere. This does not bother me in the least when I make a decision based on a reasonable probability that something has occurred. Obviously, if you have to choose between two diagnoses and one occurs 49% of the time and the other 51% of the time, you'd better NOT use probability of occurrence in your decision. But when you are choosing between 2% and 98%, I find NO PROBLEM using that data to make a decision. I do it ALL THE TIME! Otherwise, you'll find yourself like a first year resident that suddenly faces his or her first life or death decision paralyzed by fear and indecision.
Thanks for maintaining a GREAT website and for allowing others to voice their opinions and perhaps provide a little knowledge for all of us.
Jerry W. Jones MD FACEP FAAEM
https://www.medicusofhouston.com
Twitter: @jwjmd
Thank you, Drs.
As always, I am deeply grateful to have ECG experts of the caliber of Dr Ken Grauer and Dr Jerry Jones comment on the content on this site. Dr Grauer serves as our Consulting Expert, commenting on nearly every ECG in our archives. He helps us make sure we provide information for all levels of students (and instructors). I hope that readers and users of this site will feel free to comment as well, whether to express your opinion on an ECG, or ask questions. It is an amazing resource, having experts (true Gurus) Like Drs Jones and Grauer, who are willing to share their knowledge this way.
Dr Jones - regarding the first paragraph of your comment: I could not agree more! Years ago, I taught a class called, “Beyond the Basics” The first exercise in the class was a set of one-lead rhythm strips for the class to interpret The closer for the class was when I showed them the 12-leads that belonged to the rhythm strips I would say that nearly 100% of the class participants changed their minds on nearly 100% of the ECGs! I have posted a couple of these somewhere back in the archives on this website
Dawn Altman, Admin
In Reply to Dr. Jones ...
Hi Jerry. Thanks (as always!) for your comment. A few thoughts: i) We BOTH agree that the principal underlying problem for this patient (based on this ECG) has to be Hyperkalemia until proven otherwise. And, that’s in fact what this turned out to be (Sebastian Garay confirming a serum K+ = 8.2 mEq/L).
ii) Agreed that a pH as high as 8.2 mEq/L is higher than what I used to see for DKA. I always liked the formula for “guesstimating” the approximate K+ level once the pH of a patient with DKA corrects (0.1 pH units ~ 0.6 mEq/L in the opposite direction) — which means that if one starts with a pH ~ 7.0 and a serum K+ = 8.2 — then 0.6 X 4 pH units ~2.4 mEq/L — so once pH corrects to the normal of 7.4 — serum K+ in that patient should be ~ 8.2 — 2.4 ~5.8, which is still quite high! But in this case, we do not know EITHER what the pH was at the time of this serum K+ level, nor do we know the baseline level of renal function in this patient (ie, if pH was even lower than 7.0 or there was significant baseline renal function — it might be possible to get close to this high of a level for serum K+ …. [and of course this formula is NO MORE than a rough estimate …].)
iii) Is the reason the complex in lead V1 looks like it does in this tracing because — 1 — this is all hyperkalemia? OR — 2 — this is hyperkalemia PLUS a Brugada phenocopy pattern (as I postulate), in which the reason for the Brugada-like appearance in lead V1 is due to the presence of hyperkalemia, which is one of the conditions known to potentially cause a Brugada-ECG pattern ( = Brugada “phenocopy”) — OR — 3 — a combination of hyperkalemia + Brugada phenocopy? And, we’ll probably NEVER know for certain — because treatment of the hyperkalemia (which in this case, is primarily treatment of the DKA) will probably make virtually all of the ECG abnormalities we see “go away”.
iv) Finally (as per the labeled Figure that I added) — there IS a regular irregularity to the rhythm, and that’s what I found most fascinating about this tracing. But as I stated above in my Comment — in my experience, I’ve seen all sorts of unusual rhythm disturbances occur in association with hyperkalemia that defy full explanation, but which “go away” once the hyperkalemia resolves — which is why I never try to “read too much into” either an unusual rhythm OR an unusual ECG pattern when there is obvious marked hyperkalemia — because it OFTEN (in my experience) defies explanation and “goes away” once the hyperkalemia resolves.
THANKS again for your comments Jerry! — :)
Ken Grauer, MD www.kg-ekgpress.com [email protected]
Thanks, Ken and Dawn!
Ken...
I'm not sure I understand the distinction between saying that this is hyperK+ with a repolarization that has the appearance of a Type 1 Brugada as opposed to saying this is a Brugada phenocopy produced by hyperK+. I certainly do NOT think this is hyperK+ AND a Brugada syndrome. Are you suggesting this is a Type 2 Brugada pattern that has morphed into a Type 1 Brugada syndrome due to the hyperK+? In all my articles and textbooks dealing with hyperkalemia, I never read any suggestion that the repolarization changes were associated in any way with the Brugada syndrome. In fact, I don't recall any of the articles even suggesting there can at times be a morphological similarity (when obviously there is).
As far as the irregularity of the rhythm, I agree with you. Any condition that can cause widening of the QRS is causing a conduction delay in the HPS and certainly has the potential to result in rhythm disturbances.
And I agree that hyperK+ is extremely unpredictable. I cringe when I see tables published that show every electrocardiographic sign of hyperK+ assigned to a specific level of serum potassium (one just recently appeared on LinkedIn). My feeling is that aggressive treatment should be started at the first sign of an ECG change. And just because dialysis patients may not show any ECG changes of hyperk+ until the level is fairly high doesn't mean that nothing can happen to them in the meantime.
Thanks for your great comments and analyses. I always enjoy reading them.
Jerry W. Jones MD FACEP FAAEM
https://www.medicusofhouston.com
Twitter: @jwjmd
Re Brugada Phenocopy
Hi Jerry. My understanding is that the entity called, "Brugada Phenocopy" is etiologically distinct from true congenital Brugada syndrome — in which either a Brugada-1 or -2 ECG pattern may be elicited by various underlying clinical conditions including ischemia, electrolyte disorders (hypo- and hyperkalemia) plus a host of other underlying etiologies — that when the inciting "other condition" is treated and resolves — may entirely resolve the abnormal ECG pattern. NICE review of this phenomenon by Anselm, Evans & Baranchuk in this 2014 Editorial of the World Journal of Cardiology. I hope this helps clarify what I have been saying. THANKS again for your comments! — :)
Ken Grauer, MD www.kg-ekgpress.com [email protected]