
Submitted by Dawn on Wed, 10/09/2019 - 20:42
This ECG is from a collection of tracings that, sadly, have no patient information. It is interesting nonetheless, and we would love to hear your thoughts on it.
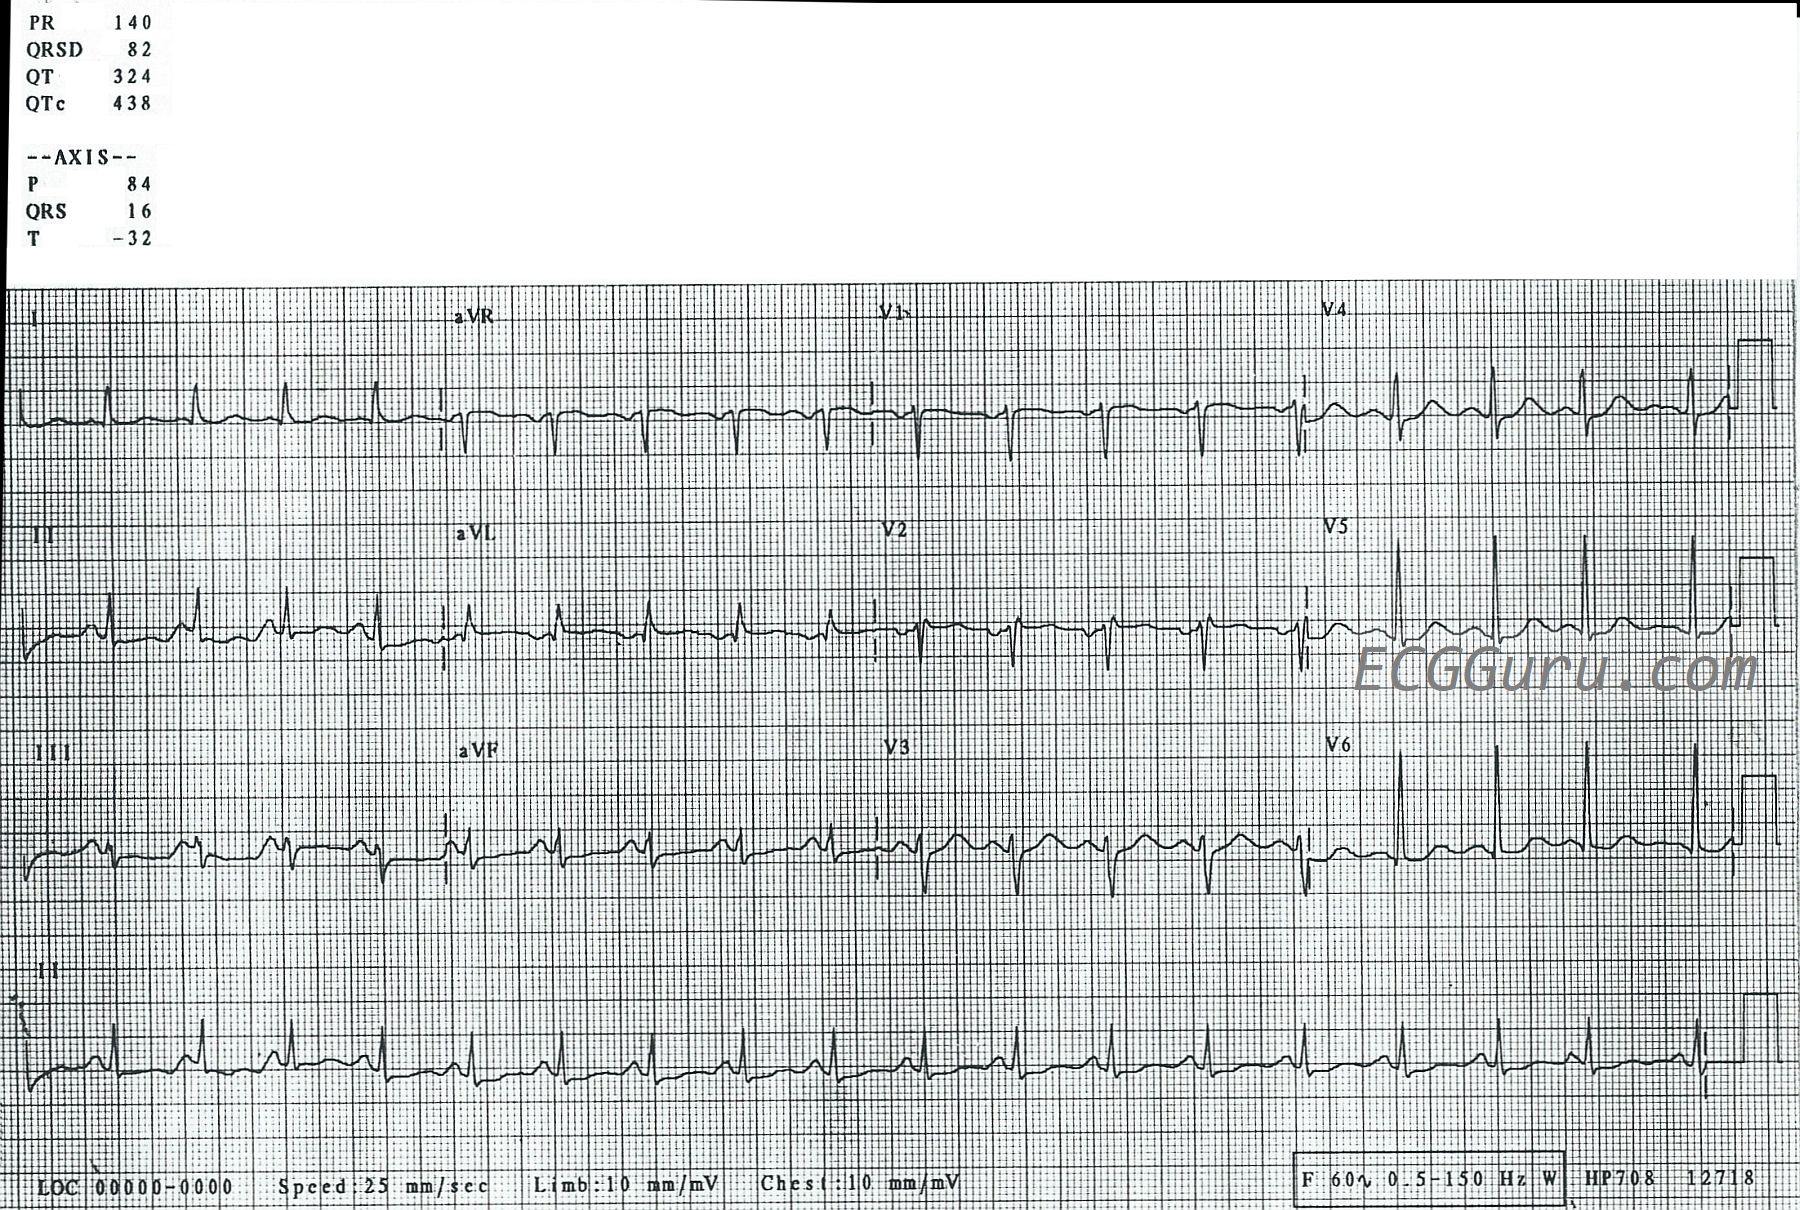
ECG Findings: The rhythm is sinus tachycardia, at a rate of 120 bpm. The QRS is narrow at .08 seconds (82 ms). While the PR interval is normal, at .14 seconds (140 ms), the PR segment is very short. The PR segment is the line between the end of the P wave to the beginning of the QRS complex. This can indicate the presence of an accessory pathway that bypasses the AV node, or of faster conduction within the AV node. The P waves in the inferior leads II, III, and aVF barely meet voltage criteria for right atrial enlargement, but the P waves in V1 do not have the usual prominent positive deflection one would expect with RAE. Even with the short PR segment, the segment appears to be elevated in the inferior leads, without any reciprocal PR depression. The PR segment is where atrial repolarization occurs (the atrial “T” wave). There are many conditions that can elevate or depress PR segments, and without a patient story here, we can’t guess at the cause. If you are an instructor, this would be a good ECG to illustrate why we use the TP segment to determine the “isoelectric line”, rather than the PR segment.
The inferior ST segments are very flat, which is not normal, while the rest of the ST segments display the normal concave up “smile” shape. Serial ECGs would no doubt be helpful here, to recognize changes in the ST segments.
Bottom Line: It would be much easier to make a determination about the causes of these subtle changes if we had patient information. However, this ECG is still valuable as an exercise in measuring intervals, and as an example of short PR segment. It is also a good example of a fairly fast sinus tachycardia. We would love to hear our visitors’ thoughts on this tracing.
Related Terms:
Rate this content:
All our content is FREE & COPYRIGHT FREE for non-commercial use
Please be courteous and leave any watermark or author attribution on content you reproduce.
Comments
Lots of Findings to Talk About, but No History …
Discussion of this ECG is an exercise in assessment and terminology — with the realization that given the lack of history for this case, there are NO definite answers … That said — Dawn has started an interesting discussion. I’ll respond to her comments — and add a few thoughts of my own.
The rhythm is sinus tachycardia. While clinically, it doesn’t matter if the rate is 120/minute or 115/minute —the teaching point is that when the rhythm is regular and fast — one can rapidly and accurately estimate rate by looking at every-other beat. To do this — Focus on the long lead II rhythm strip at the bottom of the tracing — and, pick any QRS that lands right ON a heavy line. Then skip 1 beat — and count how many large boxes it takes for the R-R interval of 2 beats. I count a little bit over 5 large boxes as the amount of time ( = the R-R interval) for 2 beats. Therefore, HALF the rate is a little slower than 300/5 — or HALF the rate ~57-58/minute X 2 = ~115/minute for the rate. Again, it does not matter clinically whether the rate is 115 or 120/minute — but what IS useful, is this Every-Other-Beat Method to facilitate rapid and accurate estimation of heart rate when the heart rate is much faster! (CLICK HERE — and listen to these next 2 minutes in this video for full explanation of this method.)
As to the question about whether the PR interval (or the PR segment) is short — Remember that the PR interval naturally shortens when the heart rate is faster — so even though most of the “PR interval” on this tracing is made up of P wave — I would interpret the PR interval here as totally normal given the heart rate.
Distinction should be made between the older terminology = RA”E” (where “E” stands for Enlargement) — vs a more accurate, more contemporary terminology that favors RA”A” (where “A” stands for Abnormality). Given the clinical reality that factors unrelated to atrial chamber size may serve to produce larger-than-expected P waves (ie, overly thin body habitus; atrial conduction defects) — I favor use of “A” (Abnormality), unless you happen to know from Echo confirmation that the left or right atrium is anatomically enlarged.
That said, the clinical reality is that the ECG is of very poor sensitivity and specificity for detection of atrial enlargement. If you need to know atrial chamber dimensions — then an Echo is needed. As a result — I tend to undercall ECG criteria for atrial abnormality. In this case — inferior lead P waves are a bit peaked, but not really pointed — and P wave amplitude to my measurement is 2 mm, which is less than the required 2.5 mm amplitude to qualify as “RAA”. So, I would not call RAA in this case. That said — in my experience of observing the ECG interpretations of numerous cardiologists over the years — there is tremendous variation in their “threshold” for calling LAA or RAA on ECG. In my opinion — LAA and RAA are often overcalled in clinical practice. (CLICK HERE — for “My Take” on ECG diagnosis of RAA and LAA).
The next question that arises is WHERE to measure the Baseline when assessing for ST segment elevationor depression? Opinions on this vary. In my opinion — one can use either the PR or TP segment — and many times I’ll use a combination of both to determine the baseline for assessing ST segment deviation. Many factors affect my approach — including which segment is more distinct for the tracing at hand — and whether there is baseline wander (CLICK HERE — and listen to the next few minutes for “My Take” on this subject.)
Finally — I suspect there is a lead placement problem with lead V2. I wouldn’t expect an rSr’ complex to be seen in lead V2 and not in V1 — and the prominent negative P wave in lead V2 in association with an rSr’ that we see in this lead is often the result of lead placement too high on the chest. Note that some r wave amplitude is lost between V1-to-V2 — and, then “regained” by lead V3 — and that is just not a physiologic progression. That said — I doubt this technical error will alter my overall interpretation (next paragraph).
As to interpretation of the ECG shown here — I see sinus tachycardia — normal intervals (hard to accurately assess the QTc with such tachycardia) — a normal axis (about + 20 degrees) — No chamber enlargement — and nonspecific ST-T wave flattening with slight depression. There may be slight ST elevation in leads aVR, aVL and V1 — but this is not the result of acute coronary occlusion. The problem is, that without any history — we are confronted with a list of more than 50 potential causes of nonspecific ST-T wave changes as we see here. Many of these changes are non-cardiac. So, while the ST depression that we see on this tracing could be ischemic — it might also be due to drug effect, electrolyte imbalance, tachycardia, “sick patient”, and many other entities. Clinical correlation is needed to say more …
Ken Grauer, MD www.kg-ekgpress.com [email protected]