
Submitted by Dawn on Mon, 05/01/2017 - 15:28
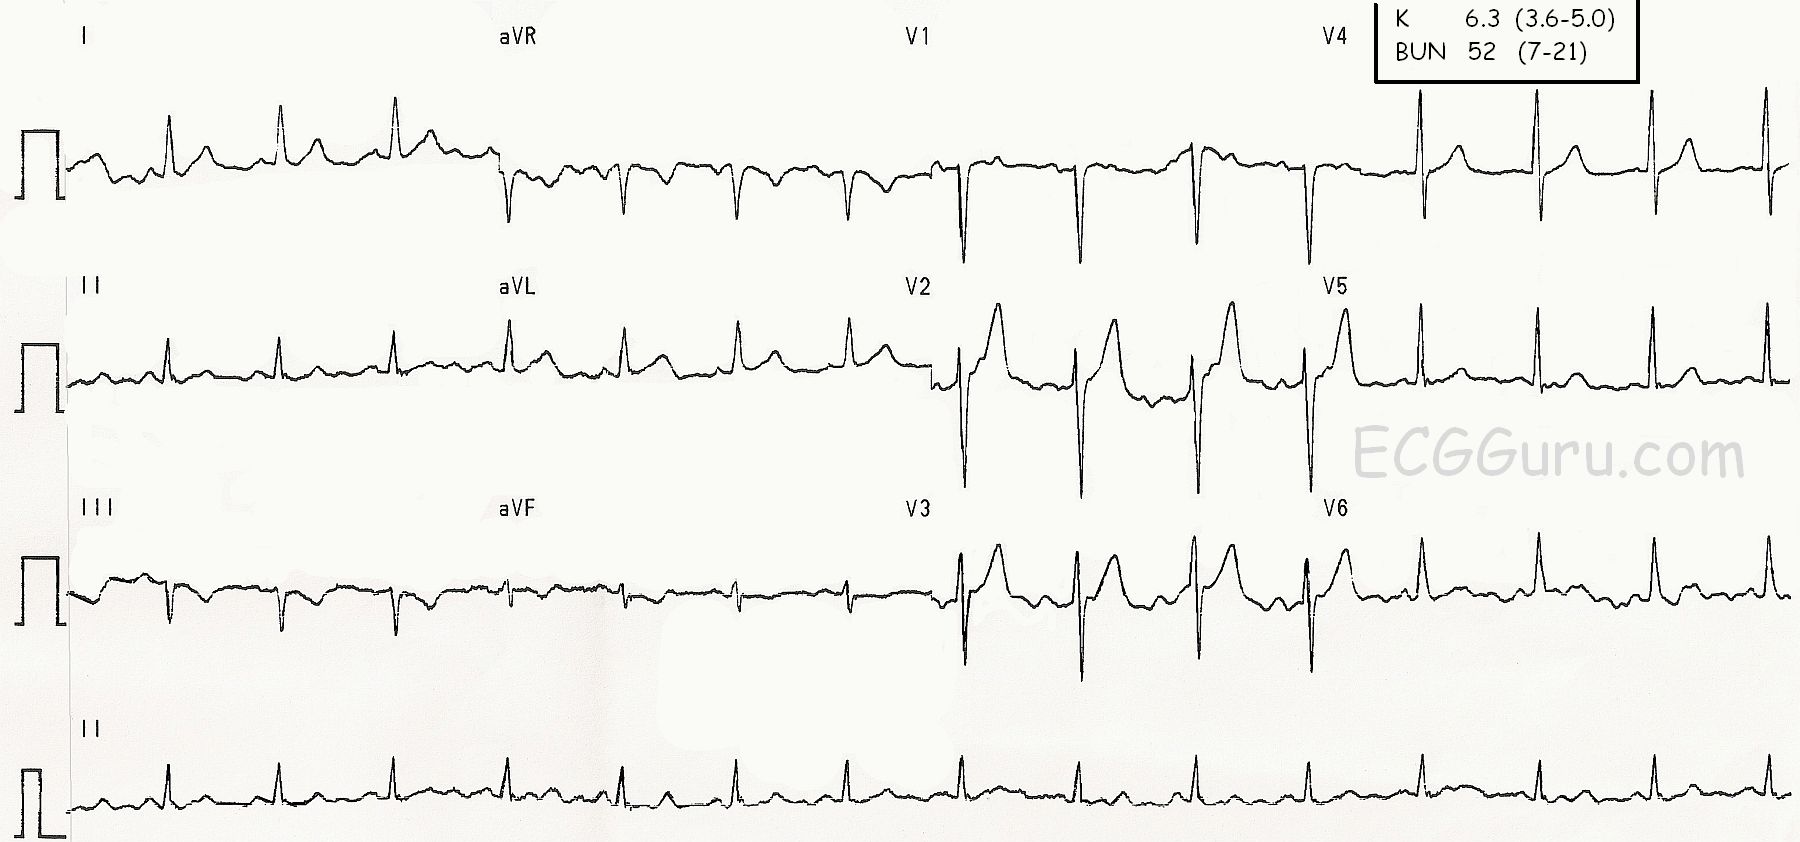
This ECG was obtained from an elderly man with Type II diabetes and early chronic renal failure. His serum potassium level was 6.3 mmol/L, and his BUN was 52 mg/dL. We don’t know his creatinine level.
This ECG shows the beginnings of the effects of hyperkalemia. One of the early changes that increased serum K causes on the ECG is tall, peaked T waves. The bases of those T waves becomes very narrow, making the T wave look sharp and thin. In this ECG, we see the increased height of T waves in V2 and V3, with only Lead V2 having sharp peaks. It is unlikely that hyperkalemia would be diagnosed on the appearance of the T waves alone, and in fact, the hyperkalemia was not confirmed until the lab results were available. The patient’s history of known Type II diabetes and early renal failure help us know what to look for.
We also see in this ECG T wave inversion in Lead III (not an abnormality in itself) and biphasic T waves in aVF.
It is good to remember that electrolyte imbalances are not usually diagnosed only from ECG changes. It is also important to remember that the ECG changes of hyperkalemia can develop very rapidly in conditions that cause rapid increase in serum K. By the time we notice the ECG changes, the patient may very well be in a life-threatening situation.
Related Terms:
Rate this content:
All our content is FREE & COPYRIGHT FREE for non-commercial use
Please be courteous and leave any watermark or author attribution on content you reproduce.
Comments
Peaked T Waves in a Few Leads ...
We are told that this ECG was obtained from an elderly man with diabetes and chronic renal failure. There is no mention of chest pain … For discussion purposes, the findings (prior to knowing that serum K+ = 6.3 mEq/L) show baseline artifact — sinus rhythm — tall, peaked and pointed T waves especially in V2, but also in lead V3 — and some ST-T wave depression in leads III, aVF.
Interpretation would be MUCH more challenging if the history was of a patient with new-onset chest pain! In that case, one would have to consider whether the prominent T waves in leads V2,V3 seen here in association with ST-T depression in leads III, aVF might represent early DeWinter T Waves with reciprocal inferior st-t wave changes … That said, the KEY features to me are: i) How NARROW the base of the T wave is in lead V2; and ii) That this patient does NOT apparently have any chest pain, but instead has diabetes + renal failure. Given that, my strong suspicion would be Hyperkalemia, as was shown to be the case here (K+ = 6.3).
Keep in mind the following: i) There is LOTS of artifact on this tracing. For example, the 2nd ST segment in lead aVL is clearly concerning, but the 3rd and 4th are not. Artifact can make it VERY difficult to intelligibly interpret ECGs. ii) ST-T wave changes of Hyperkalemia are usually much more diffusely seen than they are here … so this tracing is in no way definitive for hyperkalemia. iii) The ECG changes of hyperkalemia are SUPERIMPOSED on whatever else was previously present in the baseline ECG — and whatever else may be going on. Thus, an acute stemi could be masked by hyperkalemia. And combination of T inversion from ischemia + T wave peaking from hyperkalemia could produce “pseudo-normalization”, and a surprisingly unremarkable tracing … It would indeed be interesting to know what this patient’s baseline tracing looked like.
P.S. I distinctly remember several patients we had with a long history of renal failure plus frequent bouts of dehydration and other conditions that predisposed them to periodic episodes of hyperkalemia. For some of these patients, I could INSTANTLY tell by looking at their ECG that, “T waves in a few leads were getting more peaked again — so time to check serum K+”. Relative volume contraction in sensitive elderly patients was a common precipitant of clinical hyperkalemia in such patients. Perhaps that was the case here … ?
Ken Grauer, MD www.kg-ekgpress.com [email protected]