Dr A Röschl's picture

NON-CONDUCTED PAC

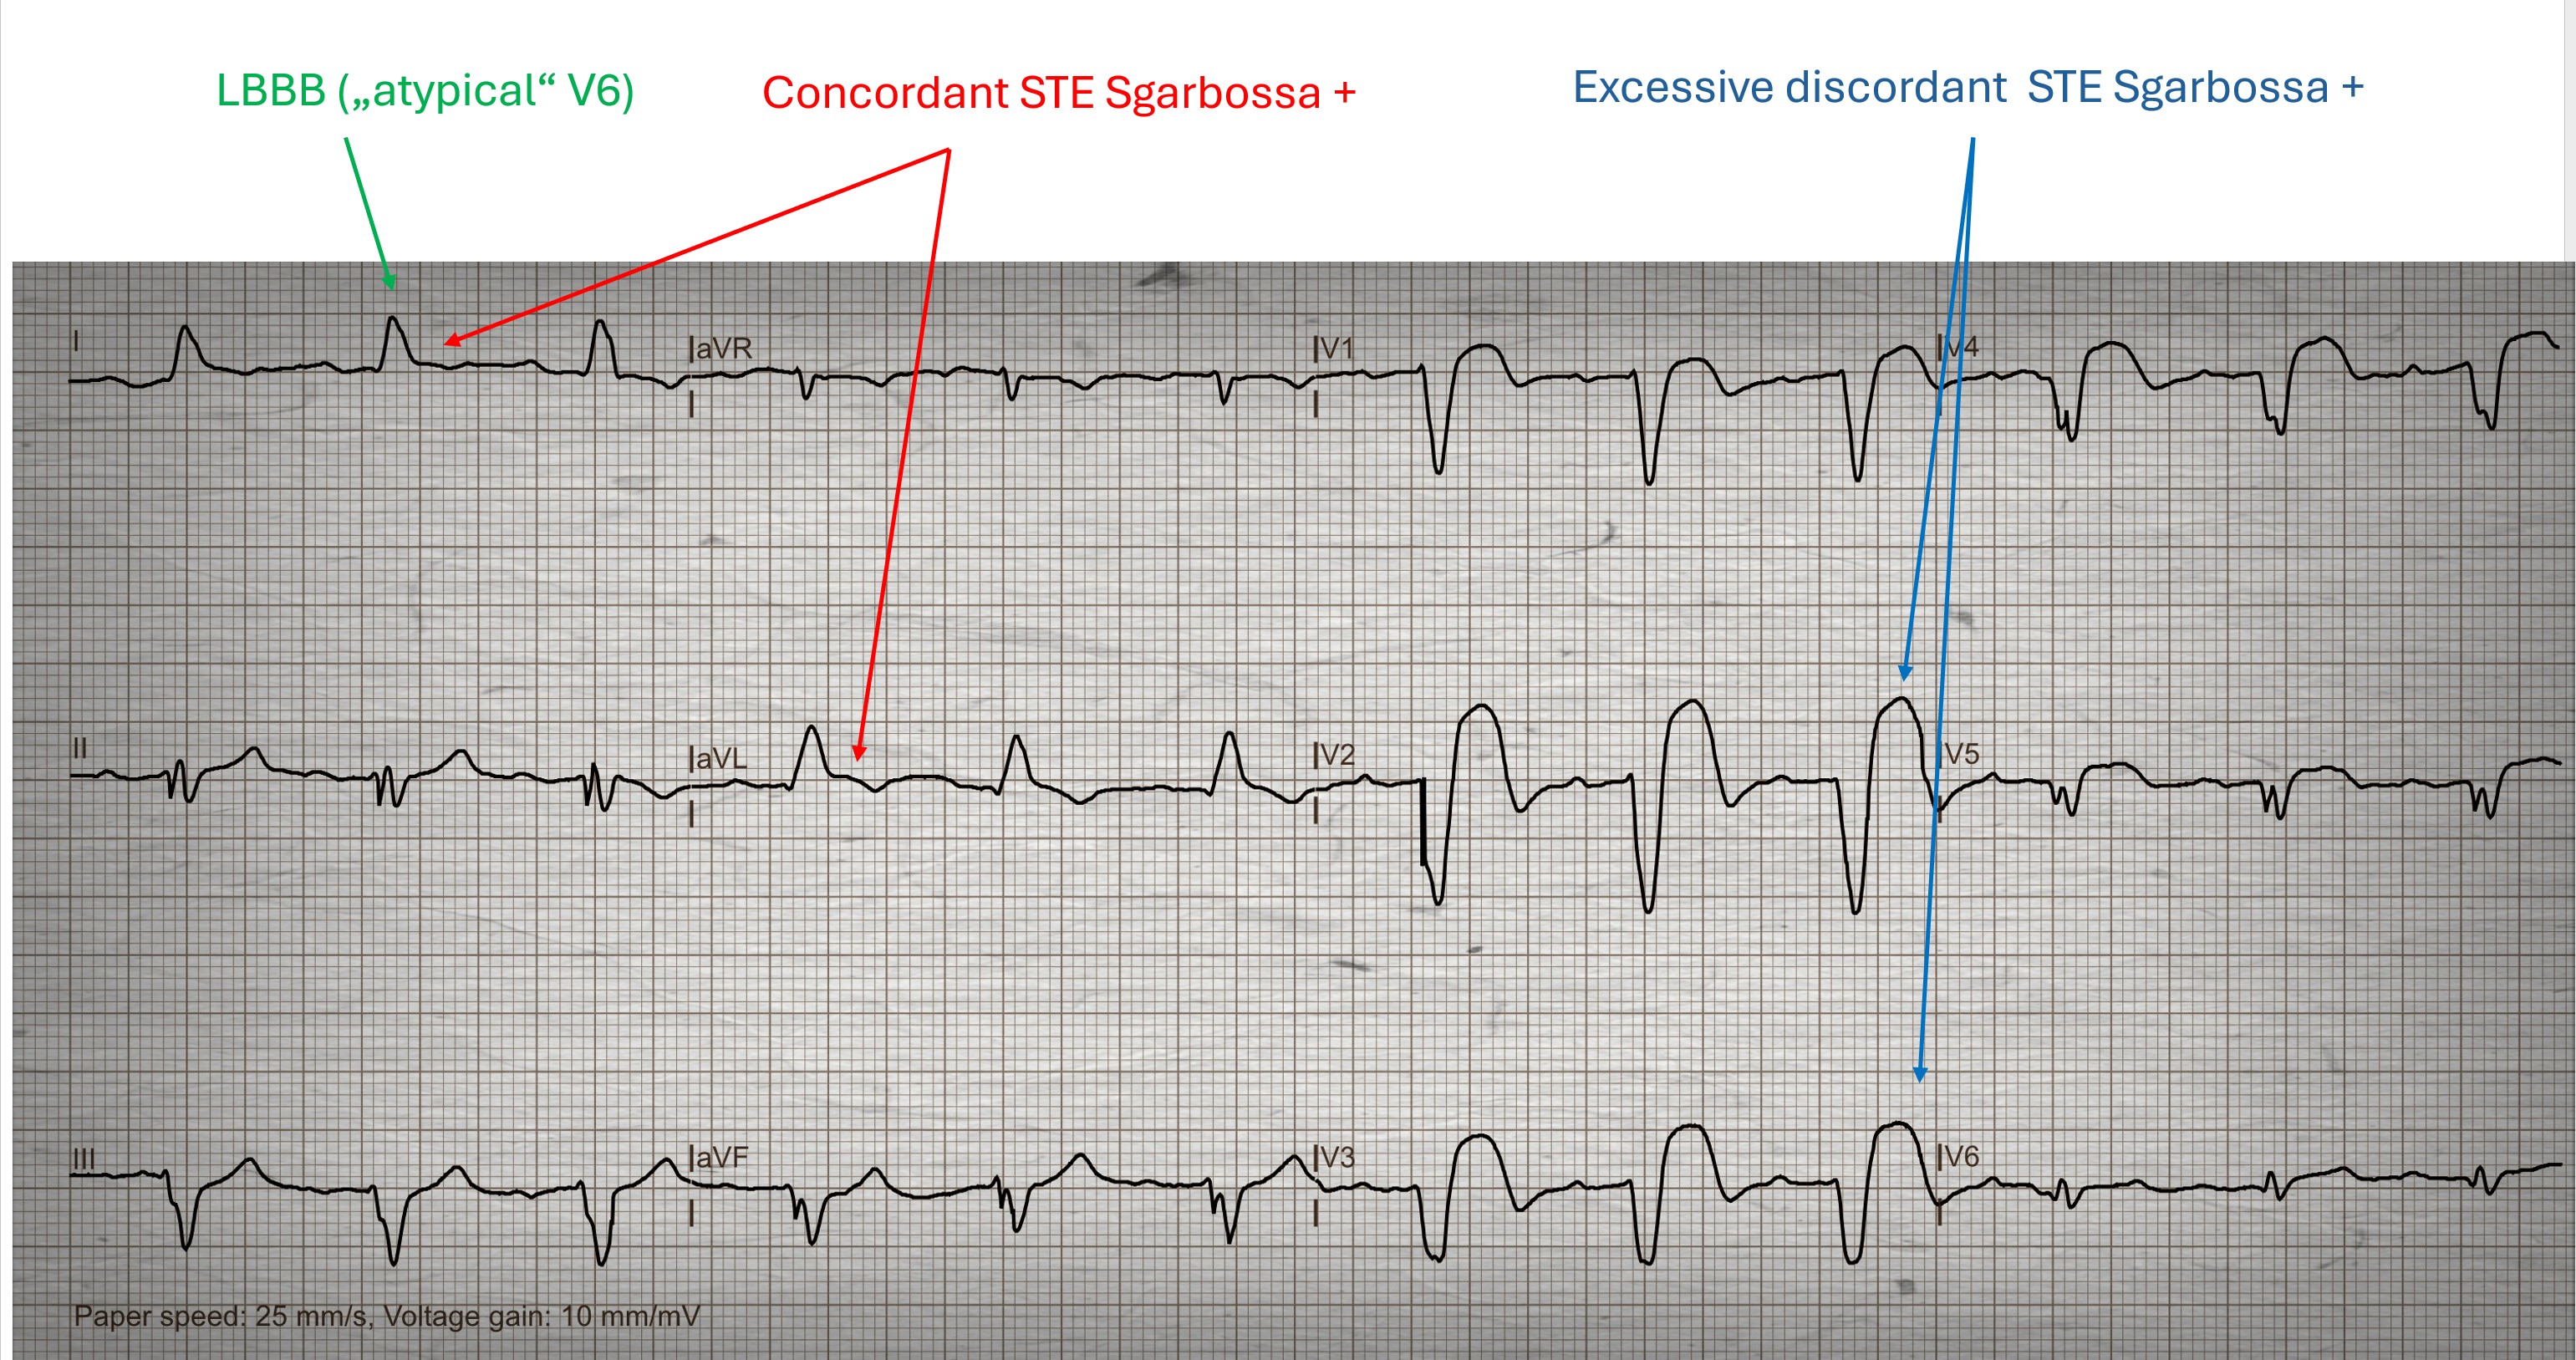
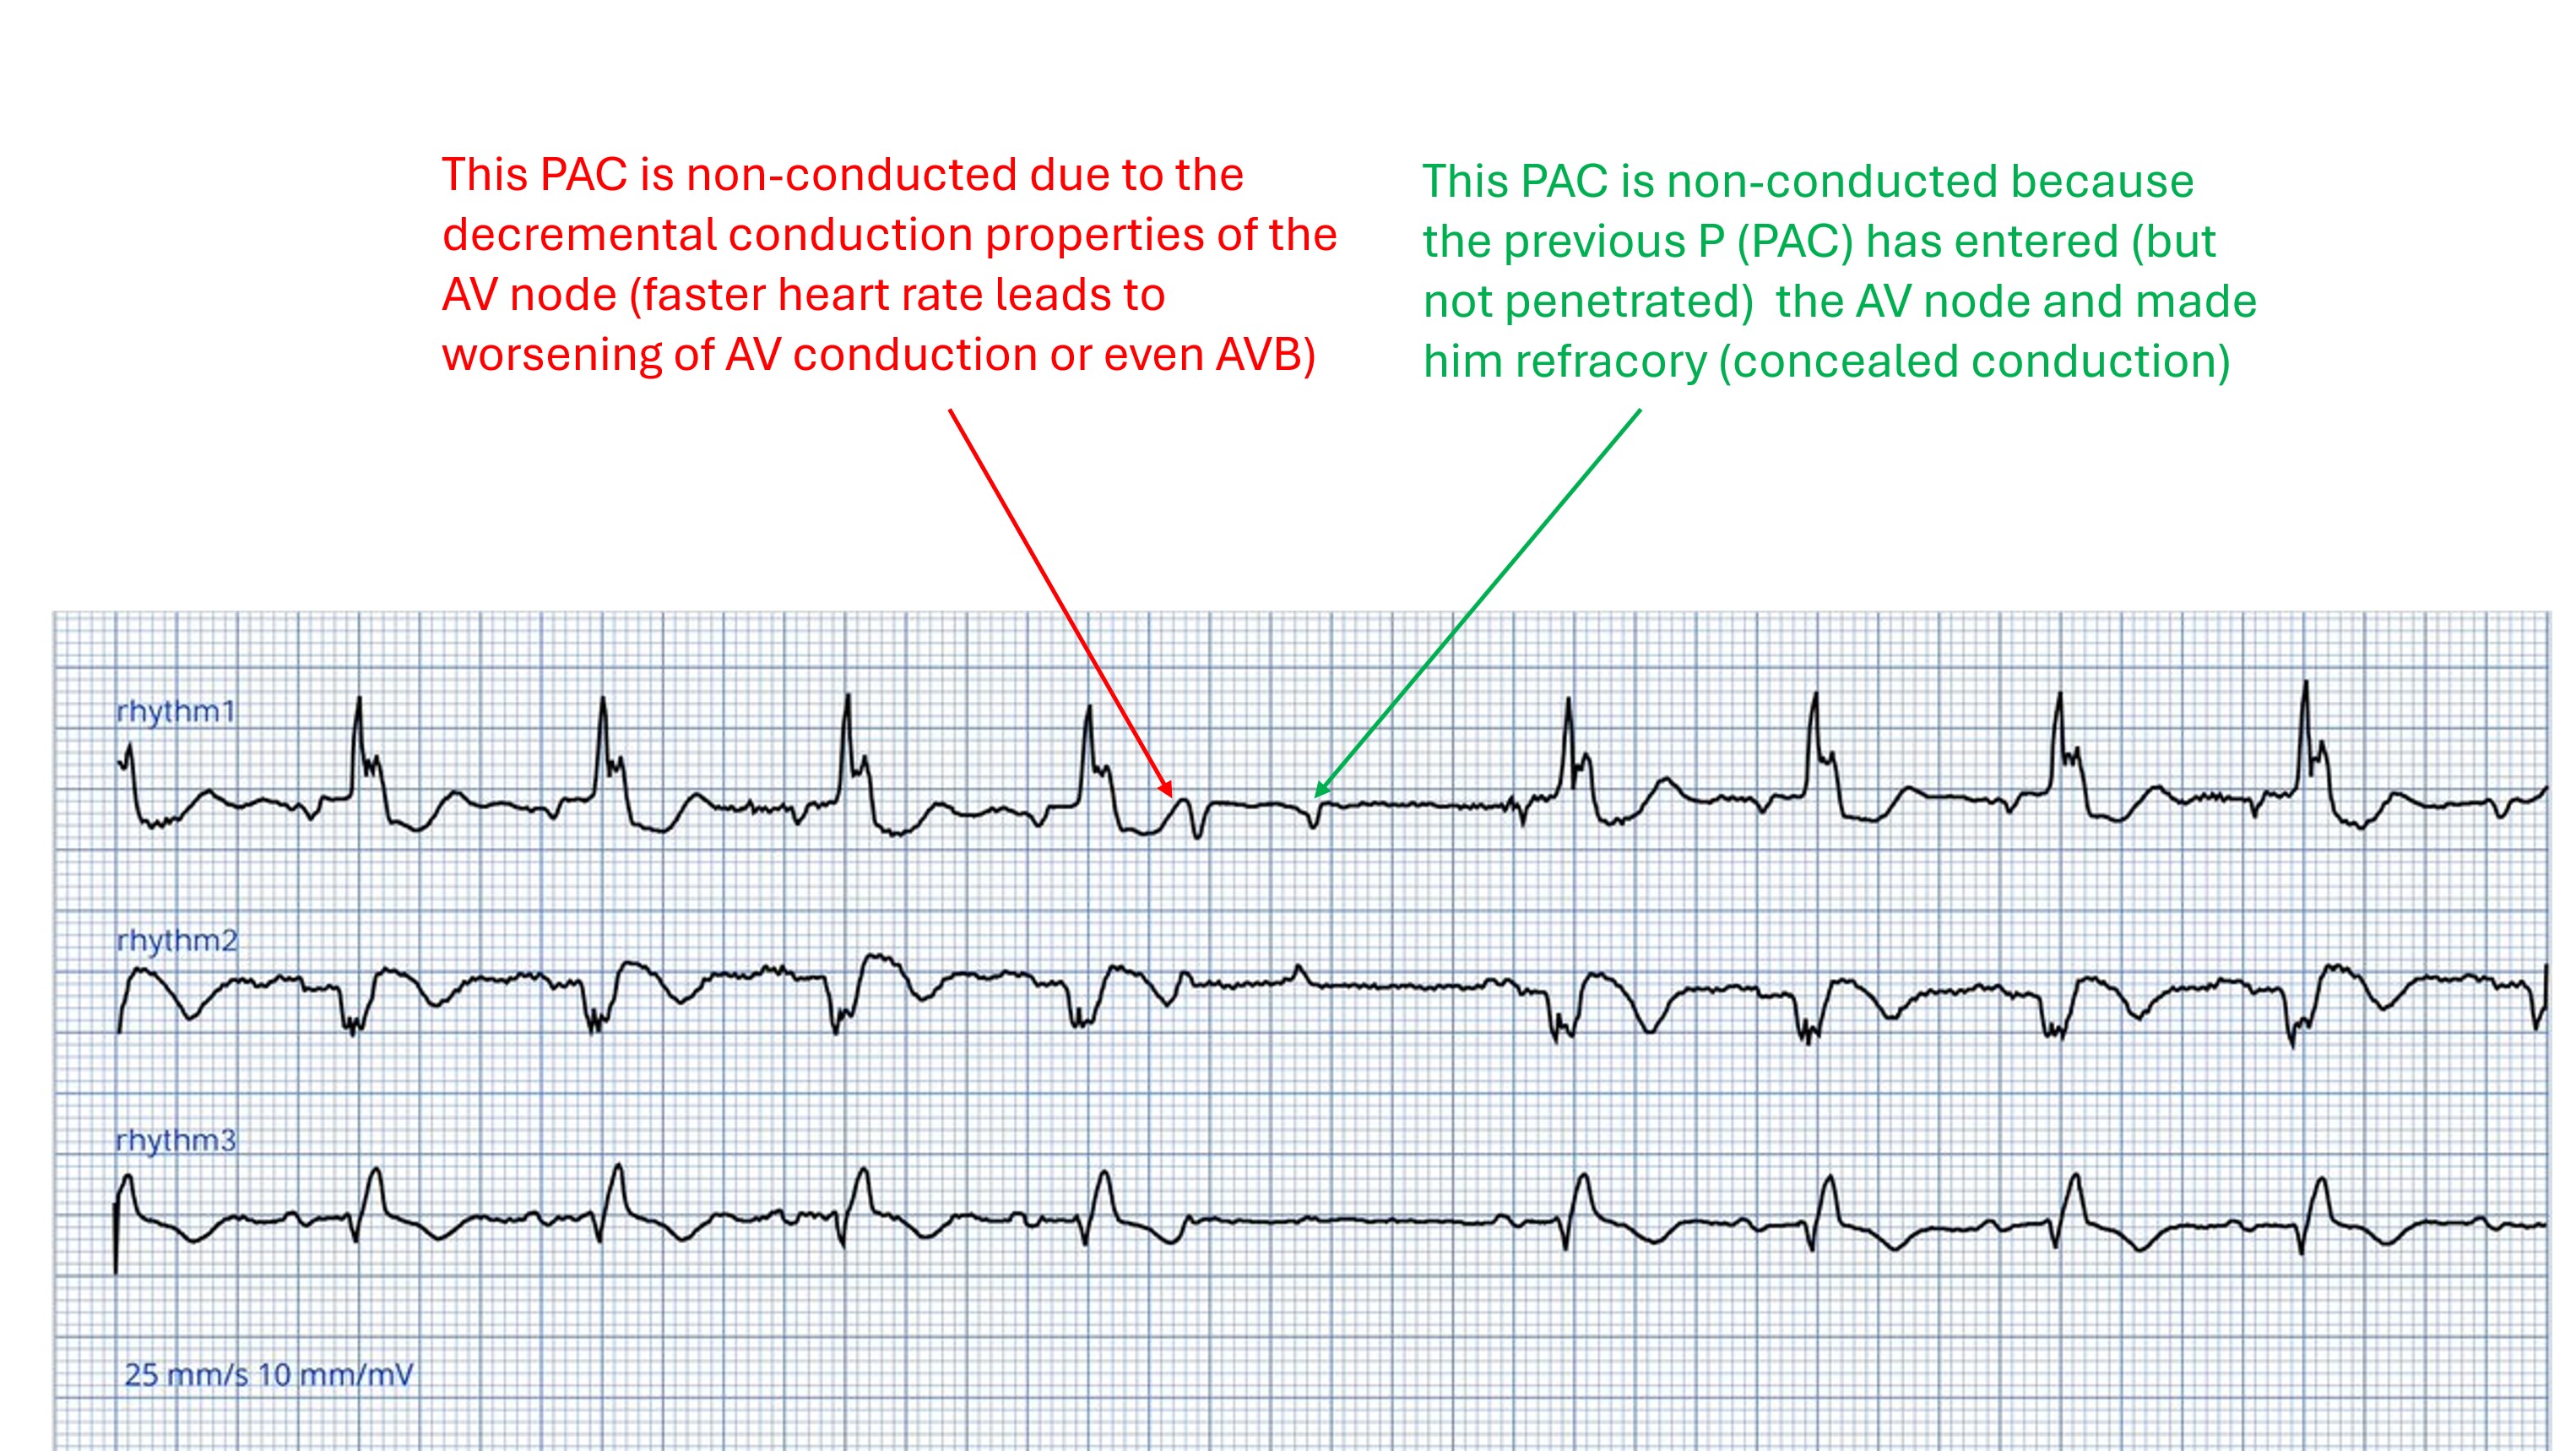
Especially in the social media, one sees again and again similar EKGS like the one shown here with the question: What type of AV block is present here? 2nd degree AVB block type I (Wenckebach) or type II (Mobitz)? It is neither one nor the other!
Here, a PAC can be seen under the blue arrow, which is not conduced because the AV node is still refractory (the refractory period of the AV node depends on the preceding heart rate). Therefore, it is not an AV block, but a physiologically non conducted PAC.

Dr A Röschl's picture

ATRIAL TACHYCARDIA WITH PARTLY ABERRANT CONDUCTION

This ECG comes from Germany, where unfortunately recording is still often done at 50 mm/s. Nevertheless, I believe that you can easily recognize the important changes in this ECG, even if you are not familiar with this recording format. The first two beats are the limb leads, the other beats are the precordial leads. The explanation of the visible ECG changes can be found in the 2nd diagram

Dr A Röschl's picture

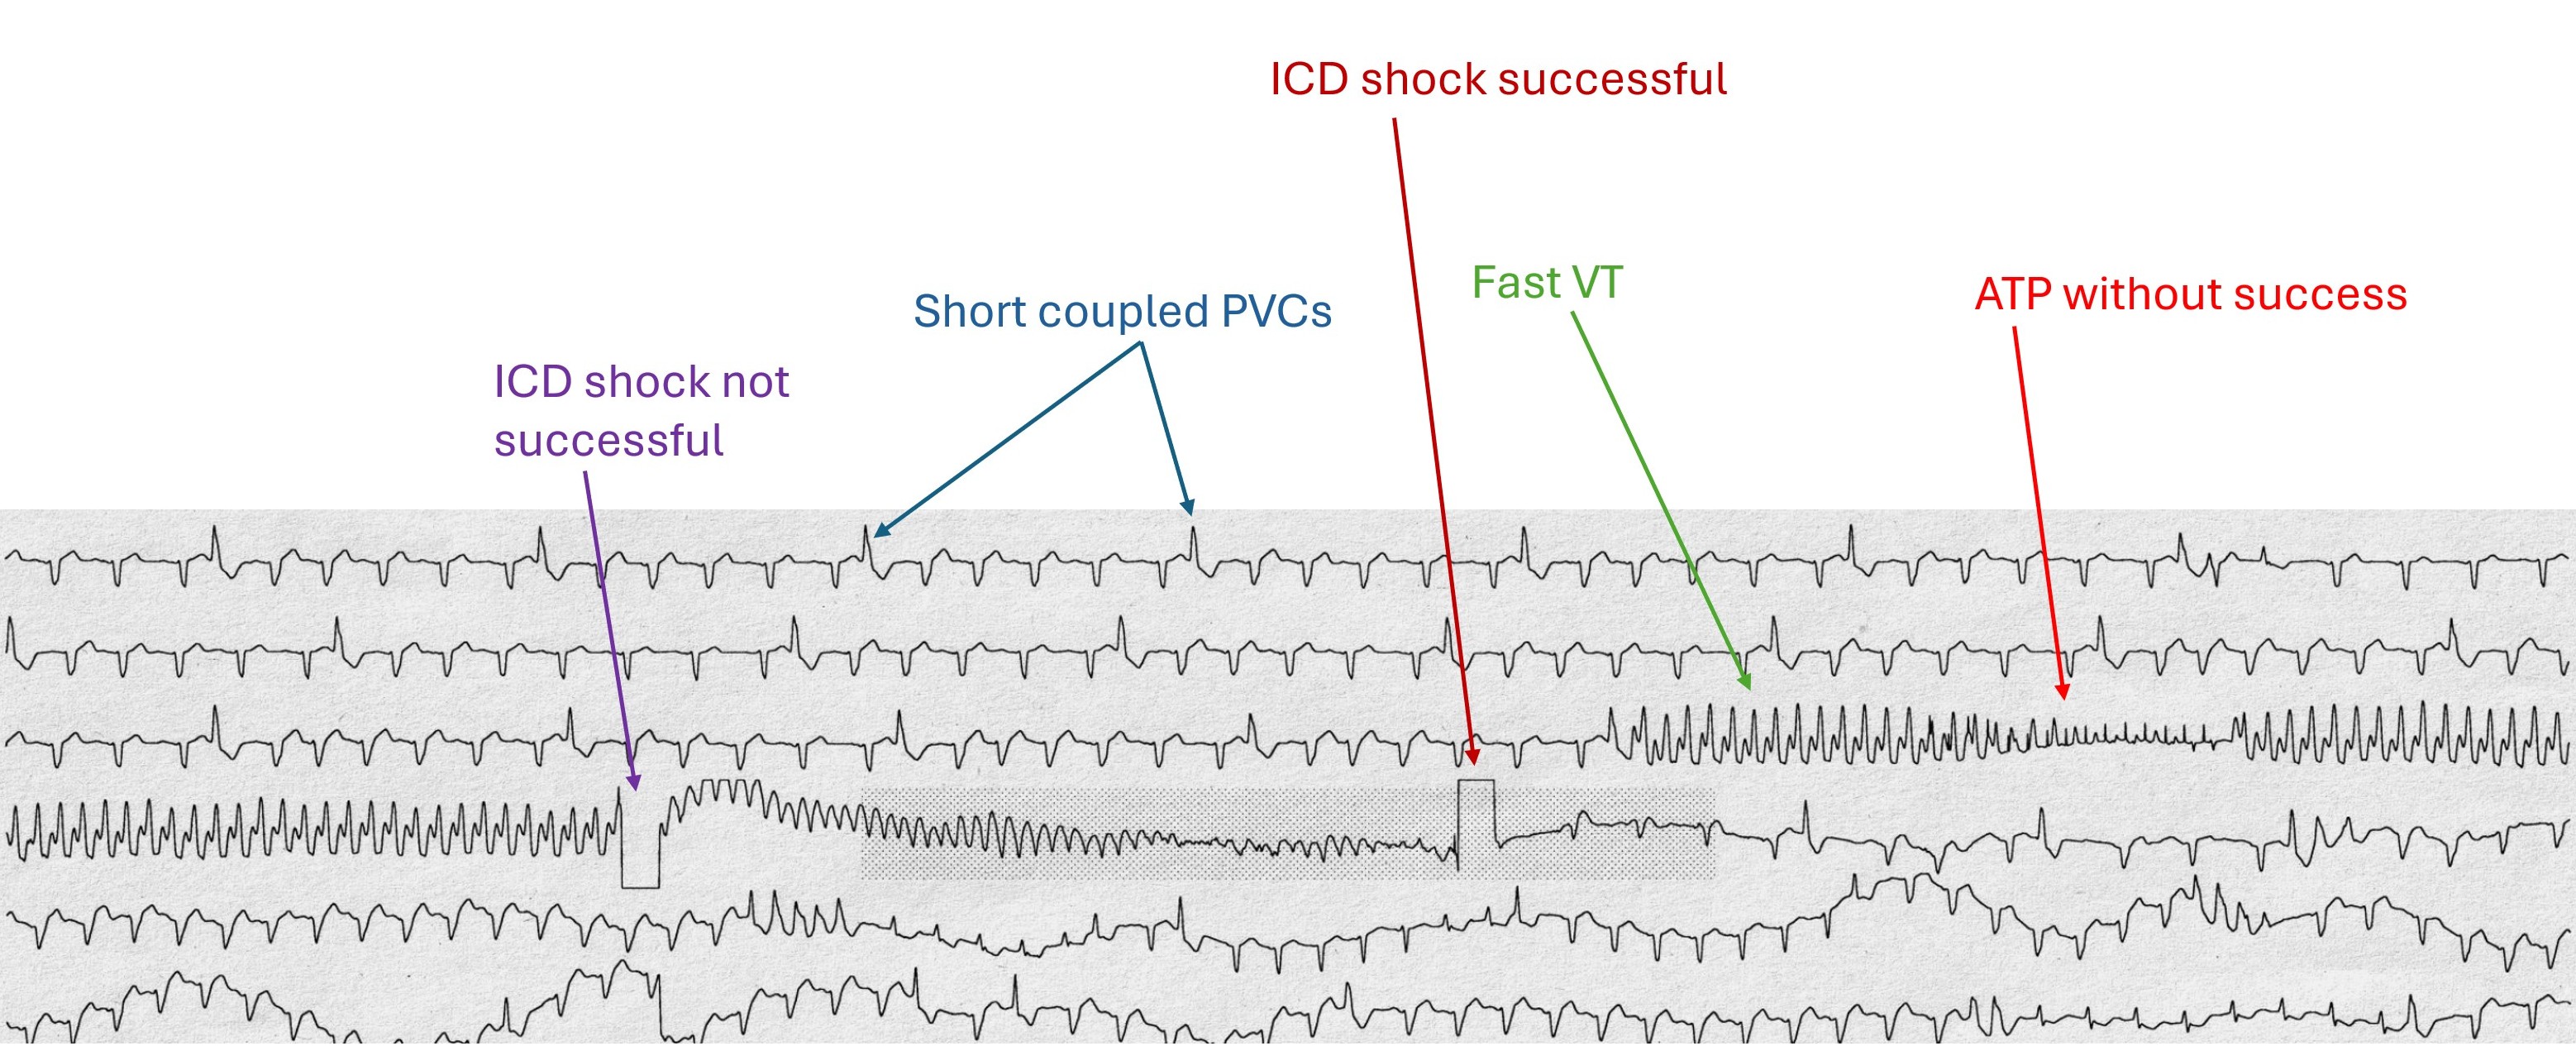
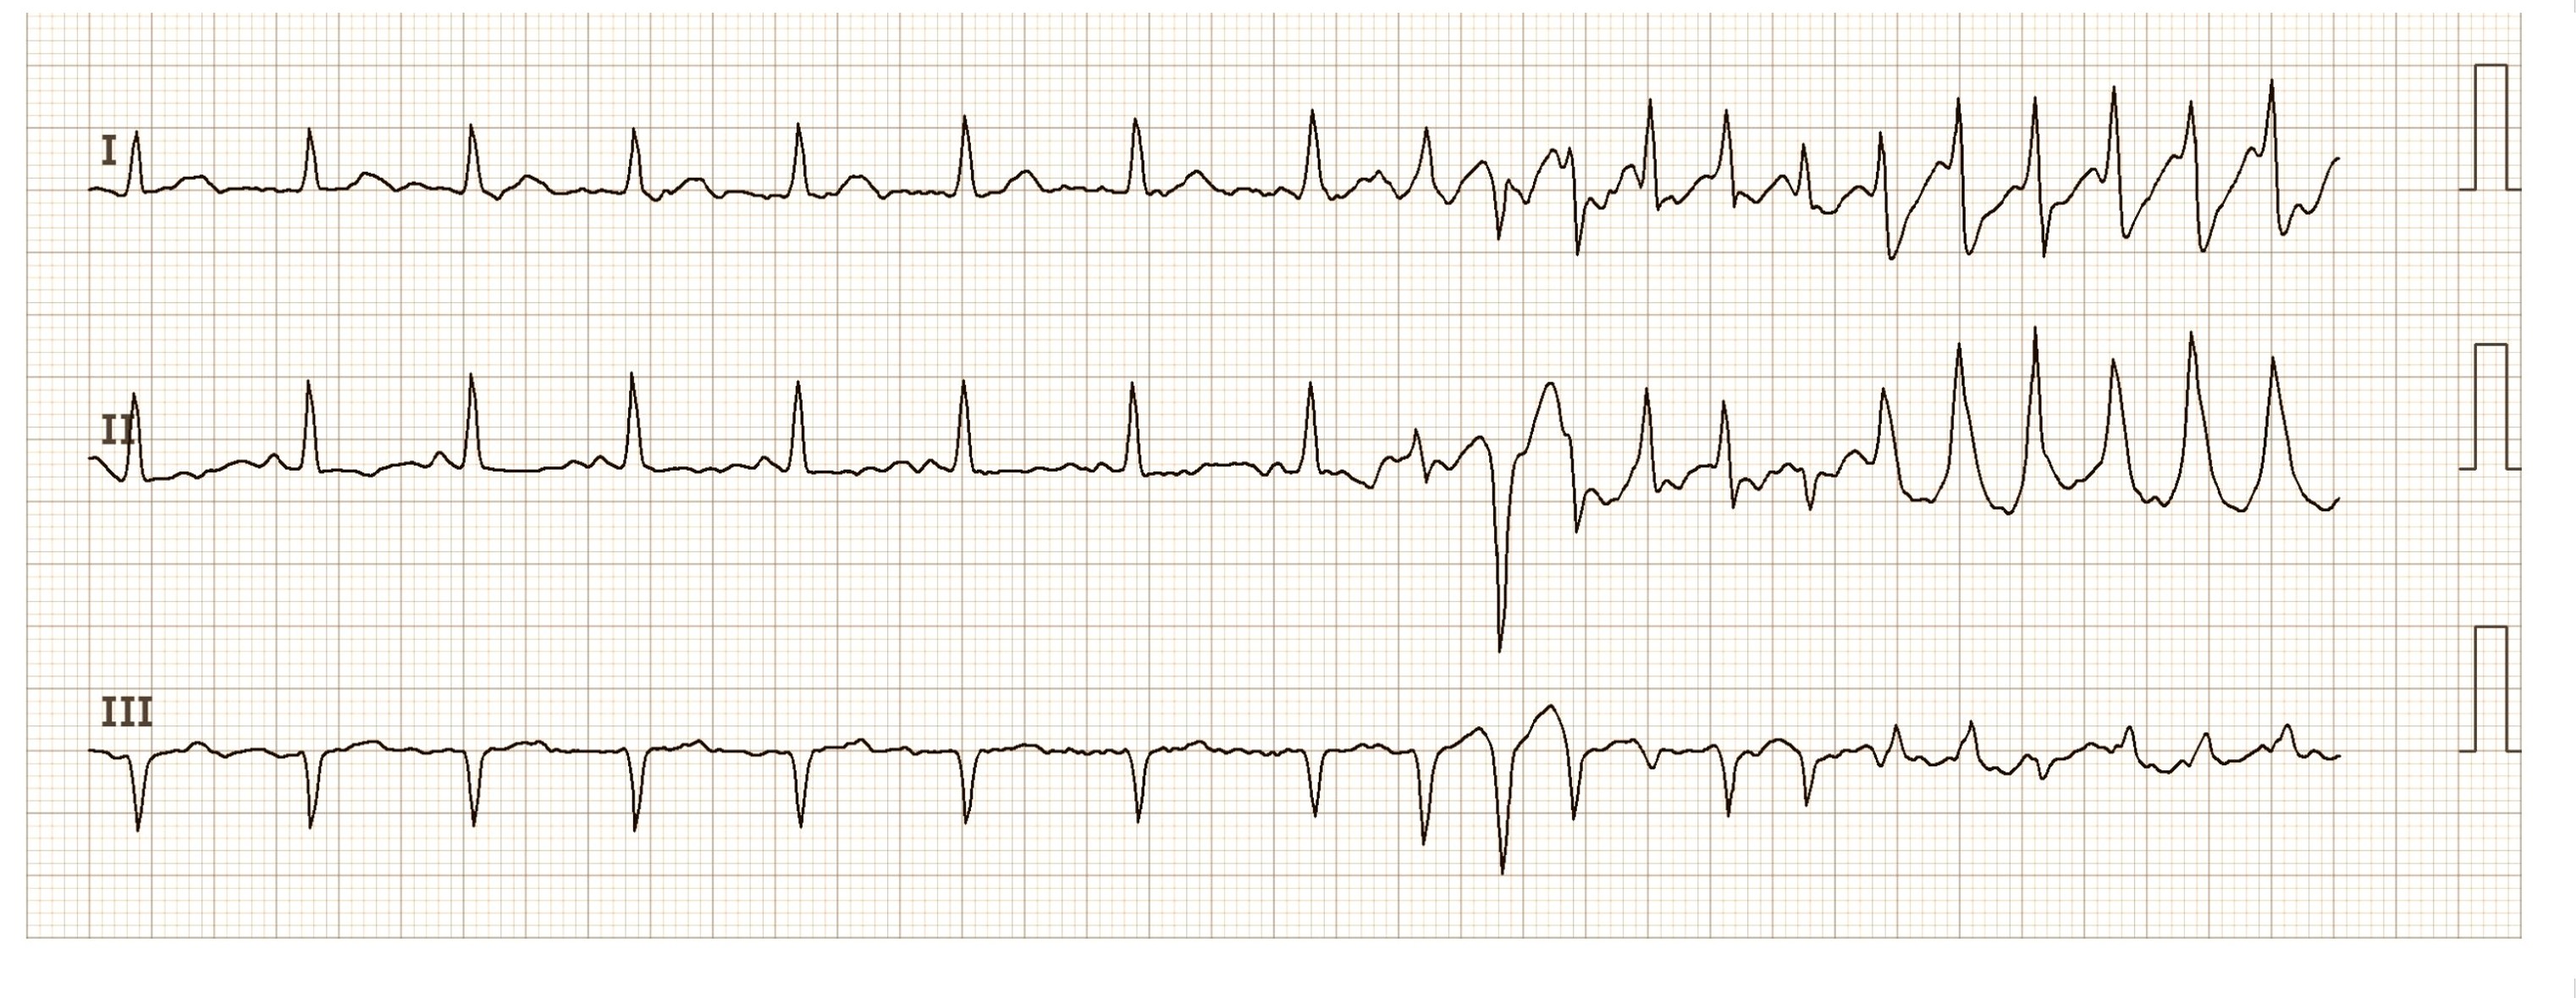
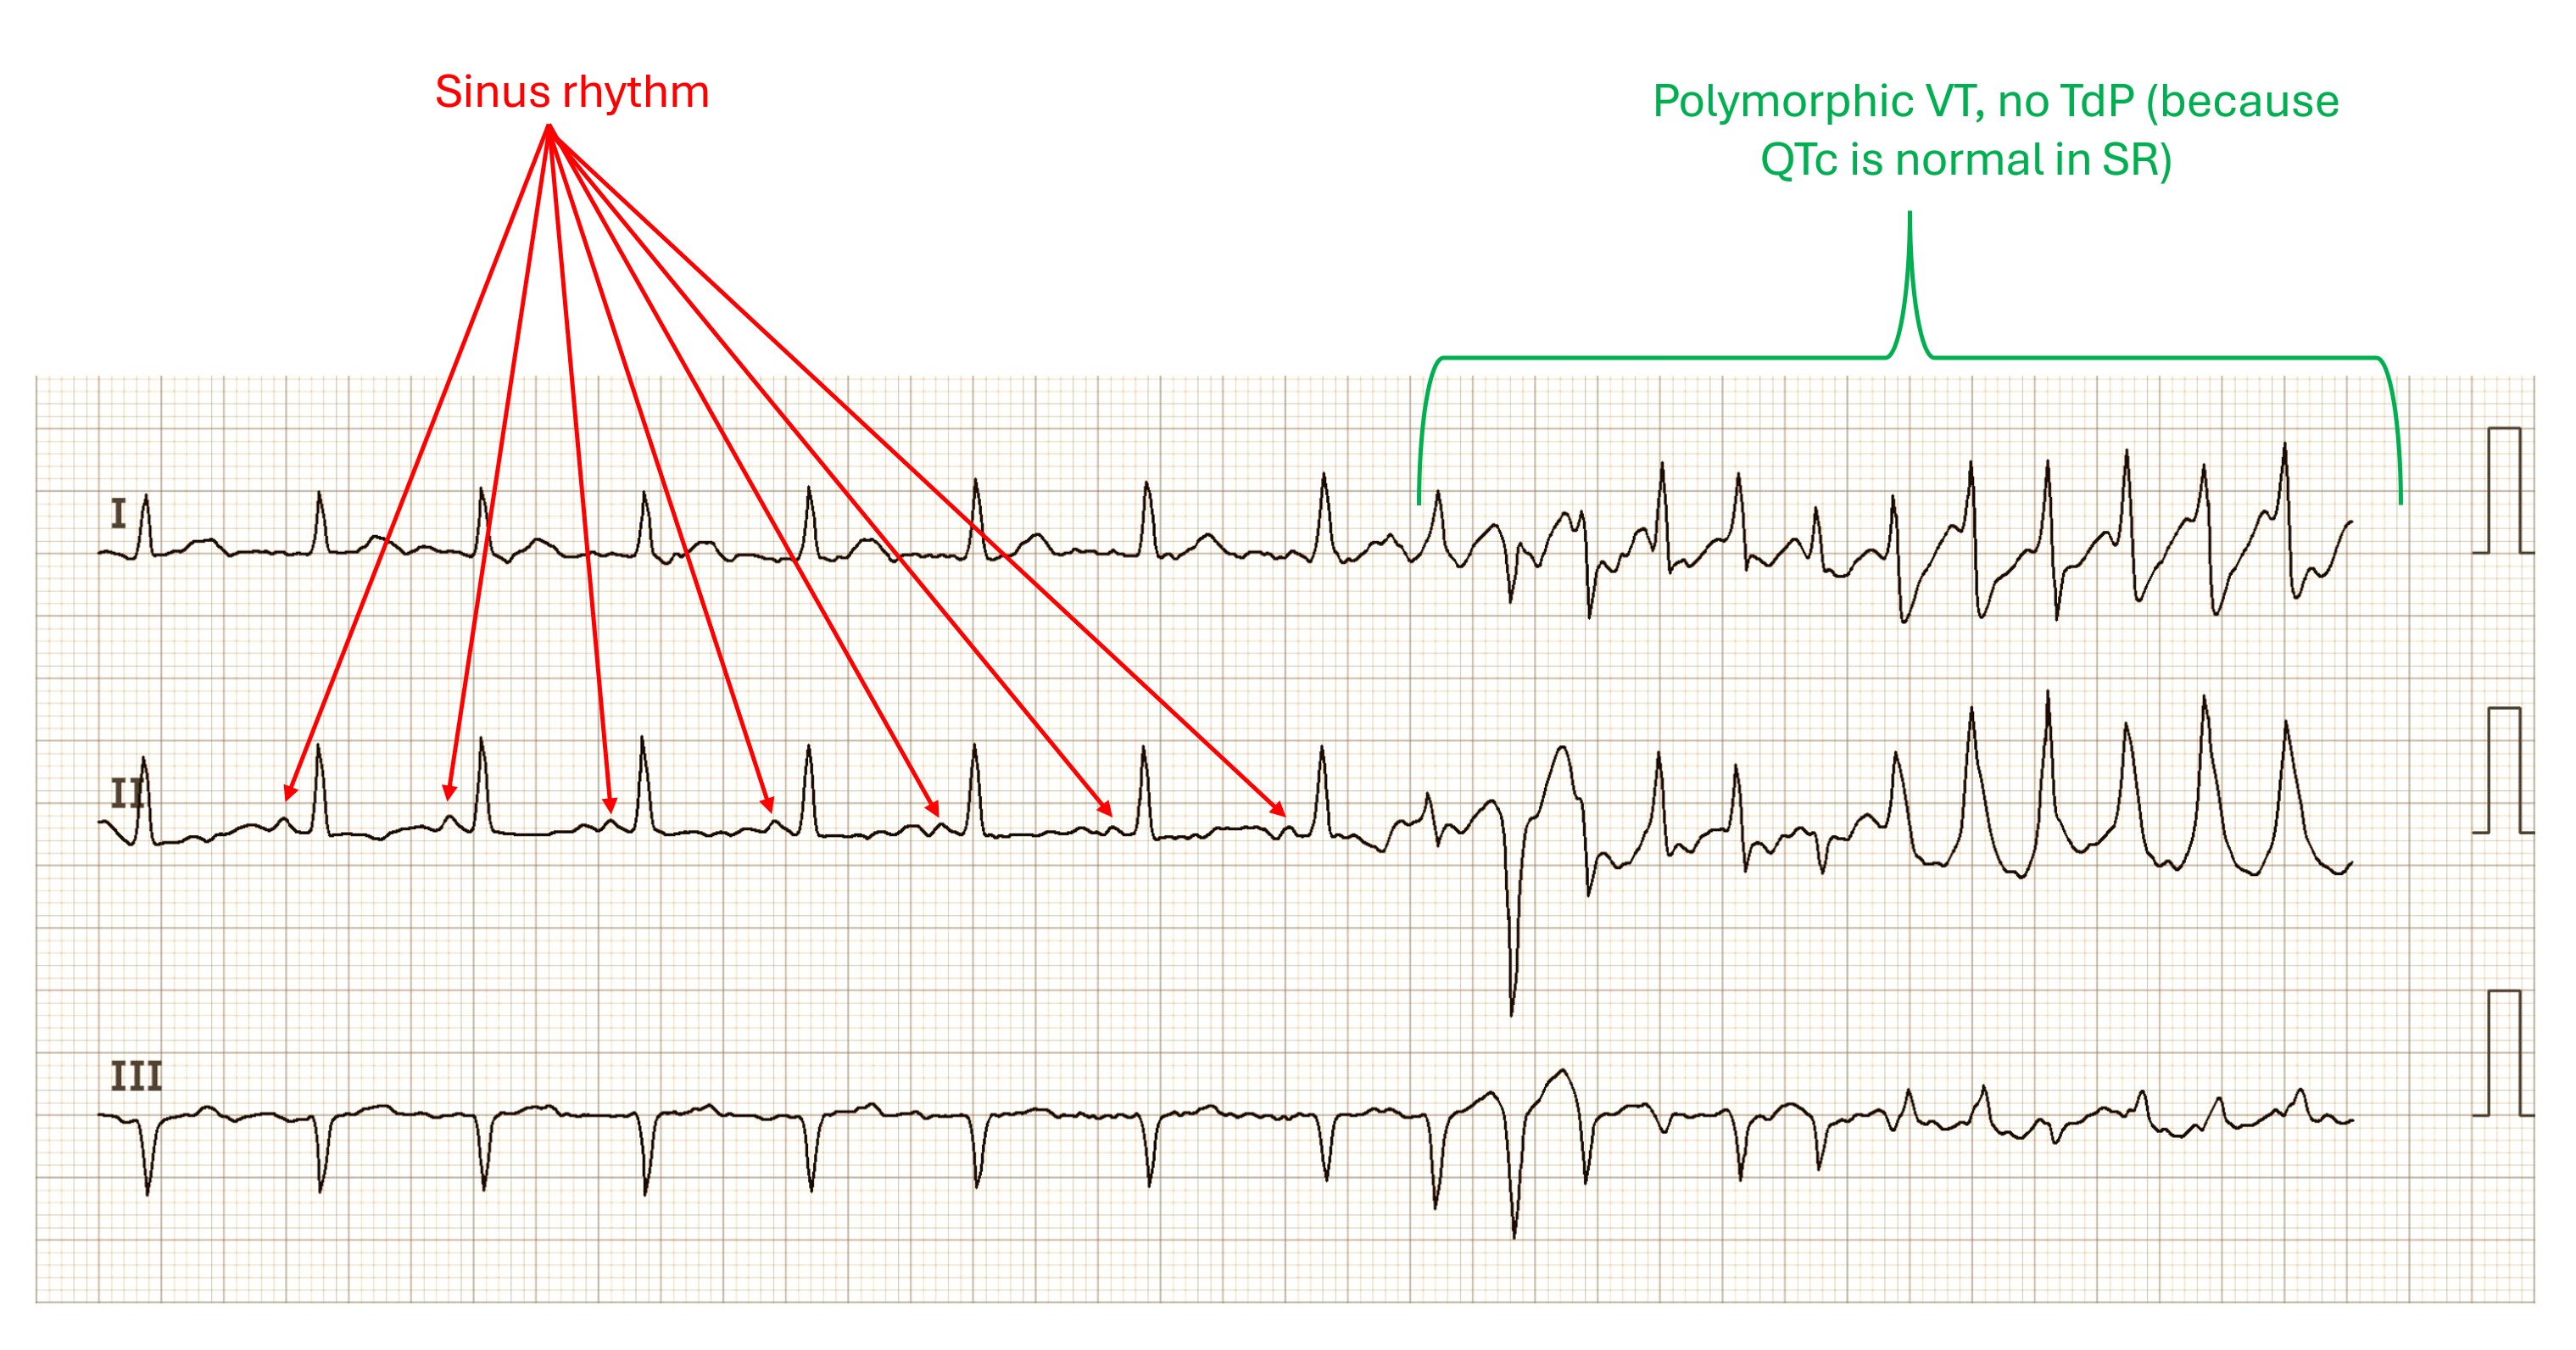
VENTRICULAR TACHYCARDIA, ATRIAL FIBRILLATION AND ABERRANT CONDUCTION

It is not uncommon for several different abnormal changes to occur simultaneously in an ECG, as in this Holter ECG strip. The explanation of the visible ECG changes can be found in the 2nd image

Dr A Röschl's picture

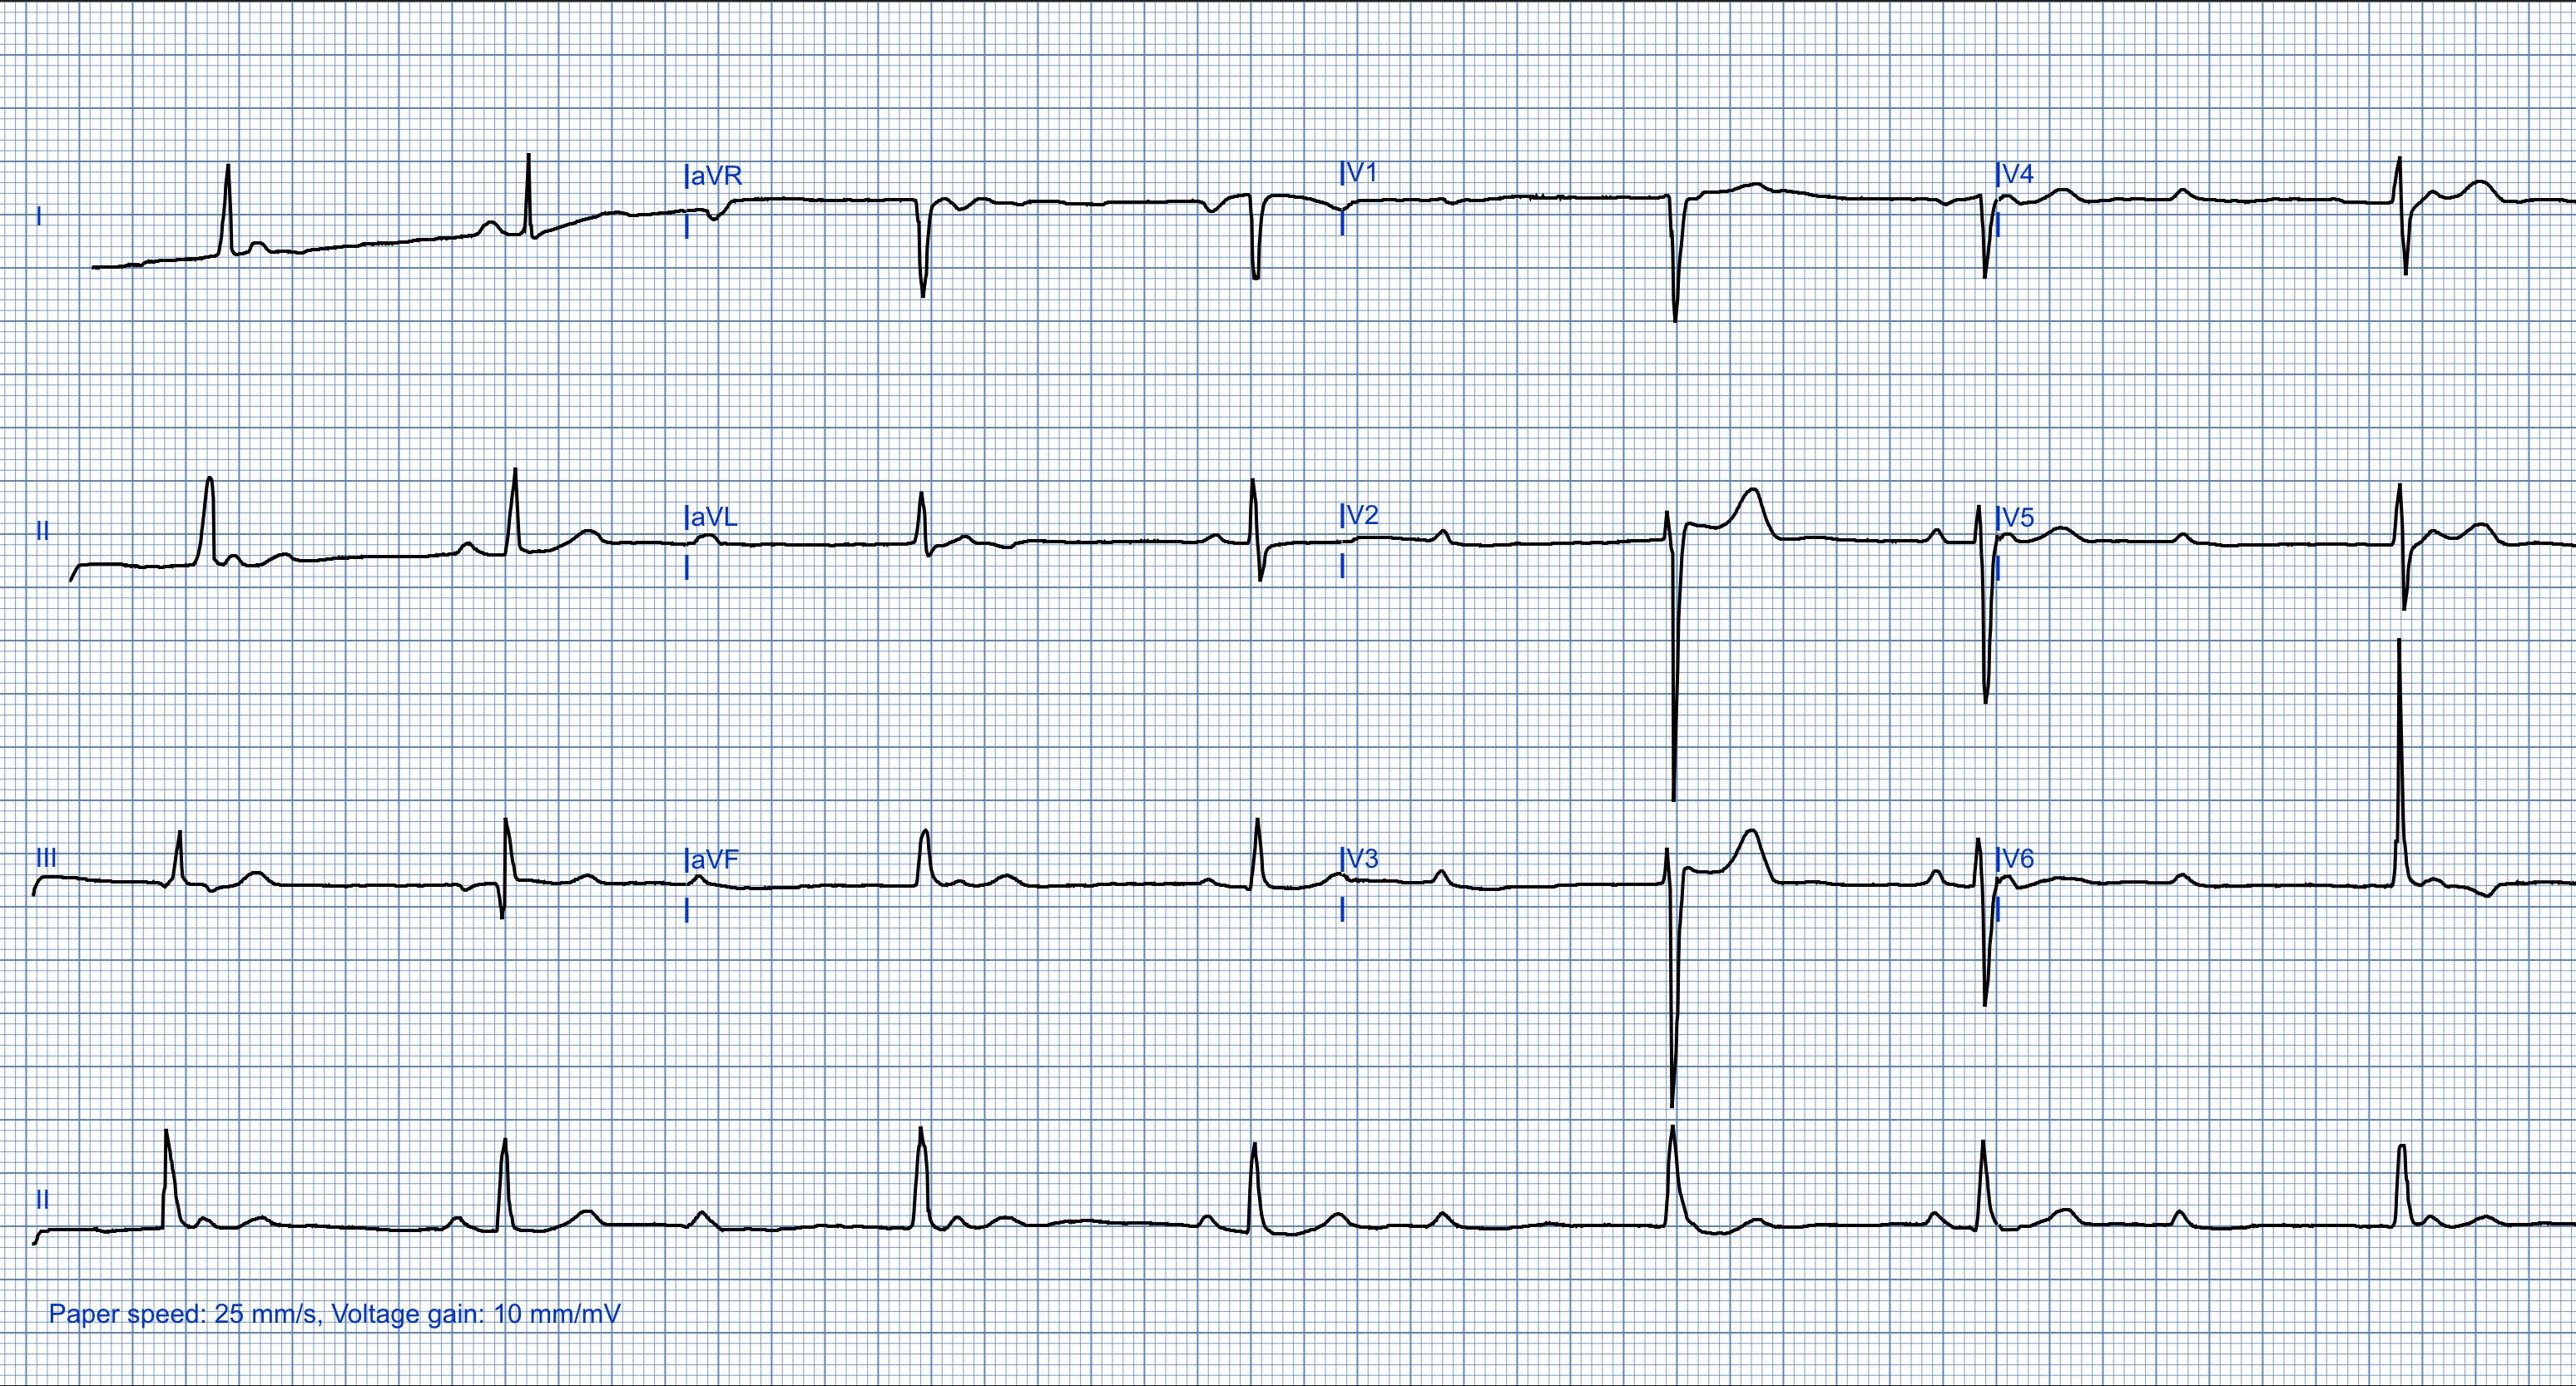
WHY IS THIS A PVC?

The answer to the question is relatively simple. A premature atrial contraction (PAC) is usually characterized by the occurrence of a premature P wave. If the premature P wave is conducted, it is followed by a premature QRS complex. A premature VENTRICULAR contraction (PVC) is a premature beat from the ventricles with a wide QRS complex. A PVC will not have a P wave ASSOCIATED with it. There may be NO P wave before the QRS, or there may be an UNRELATED P wave present. The sinus P wave may be present if the PVC occurs just after the P, but before a normal QRS can result.

Dr A Röschl's picture

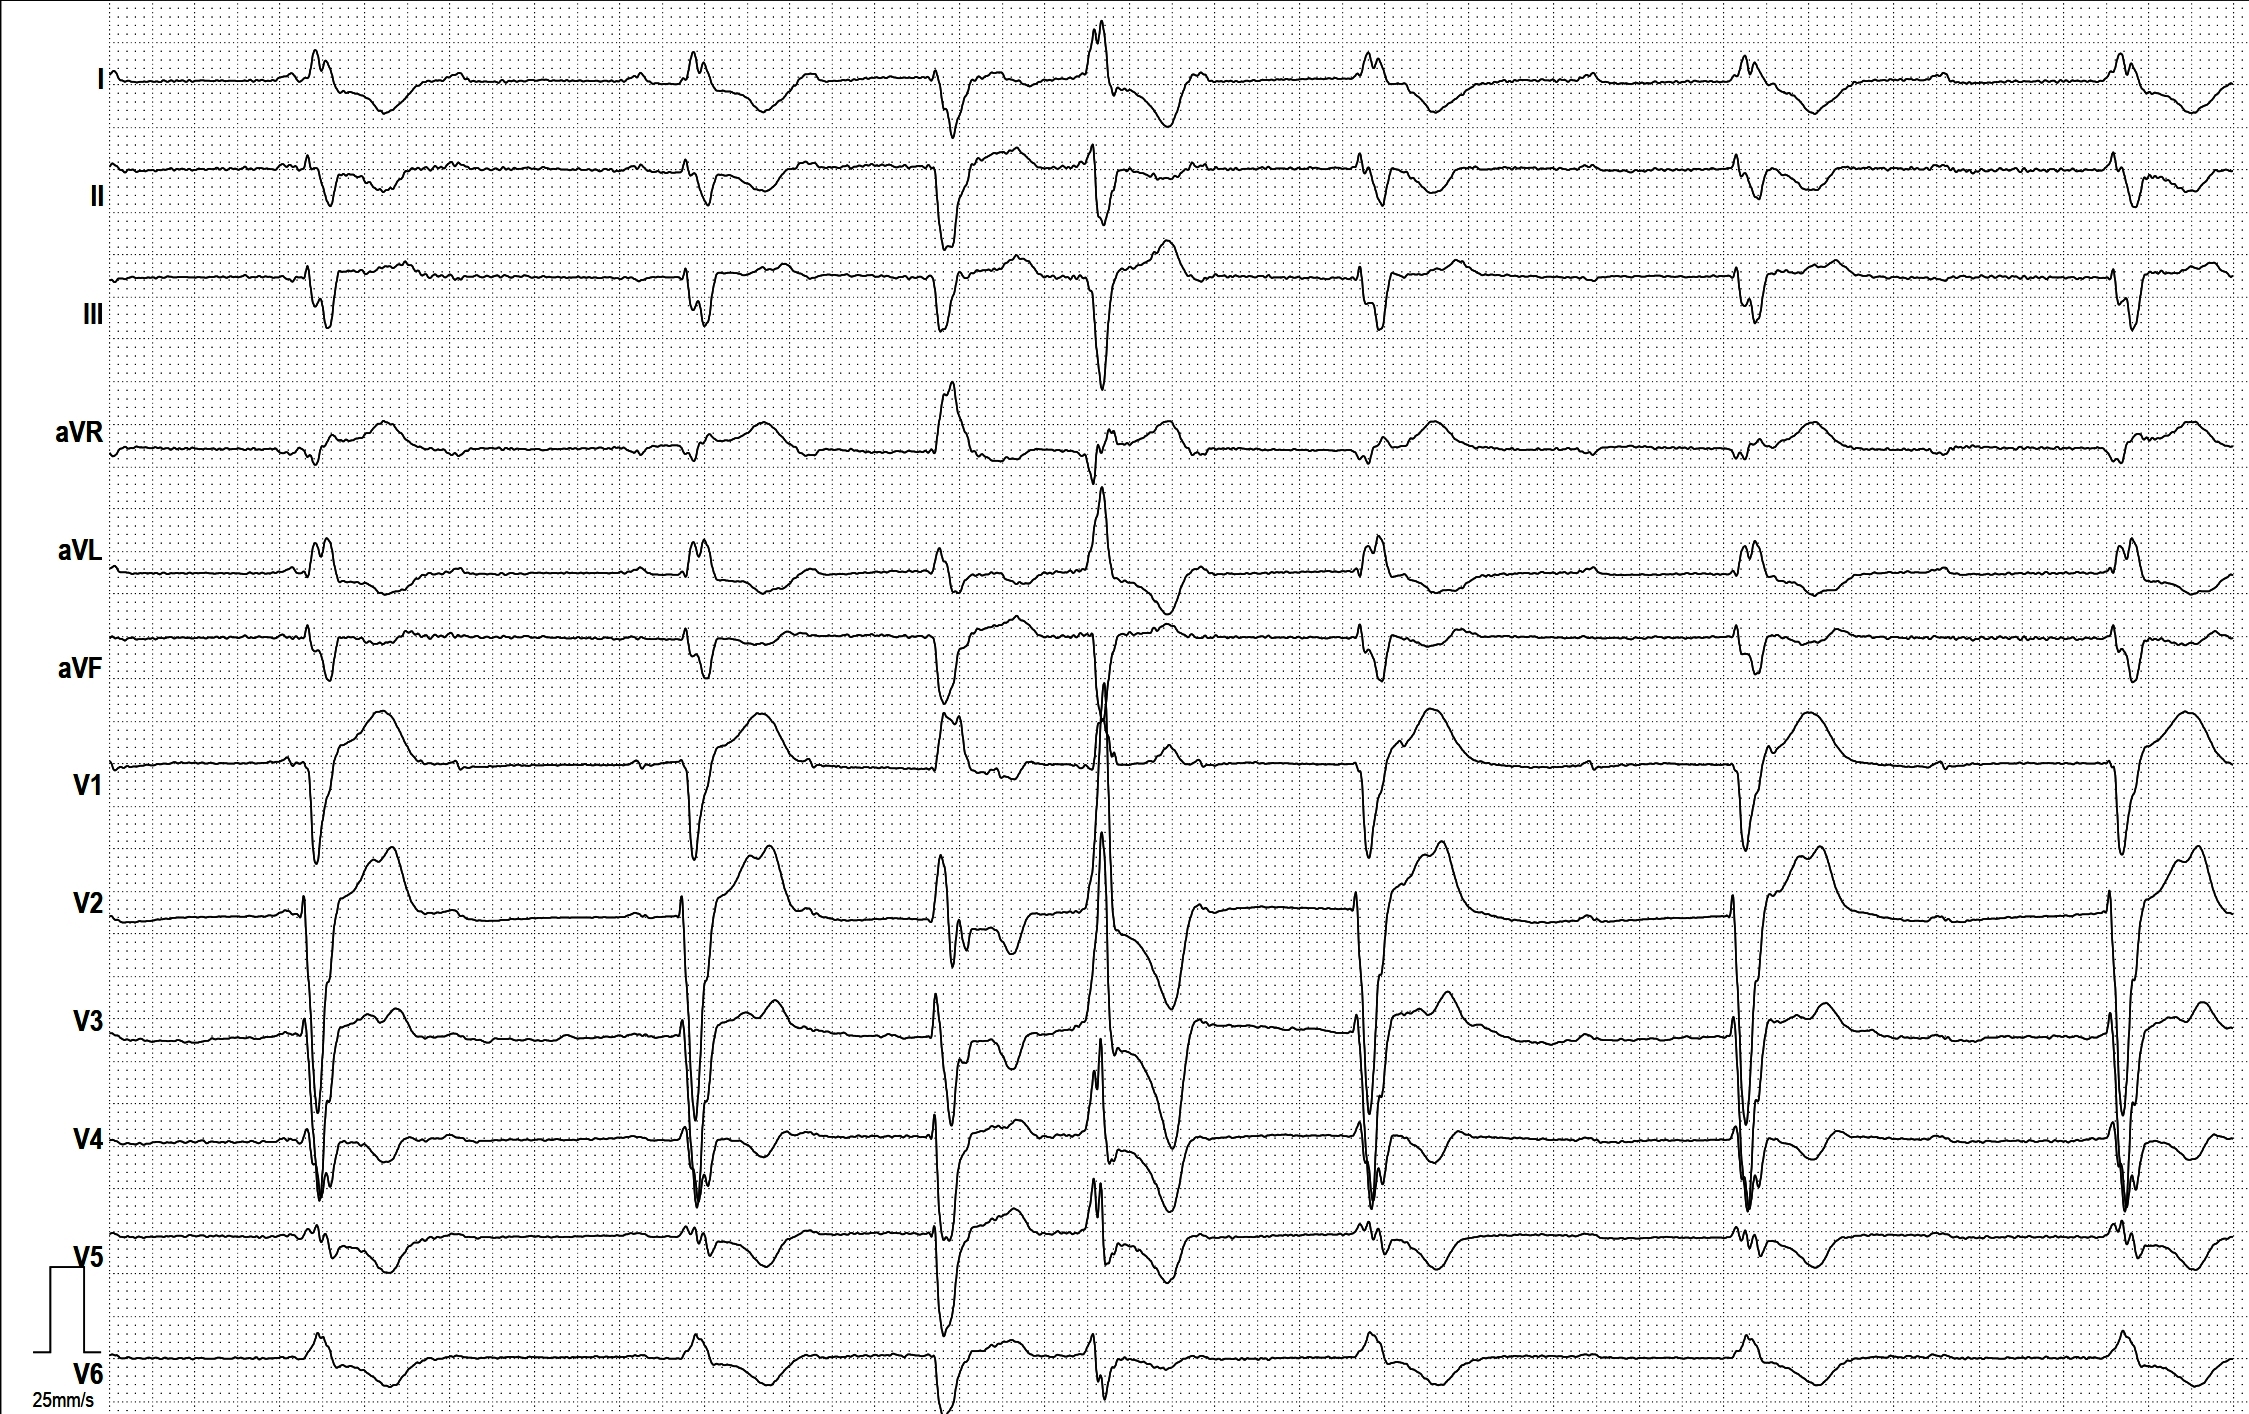
INTERESTING HOLTER-STRIP

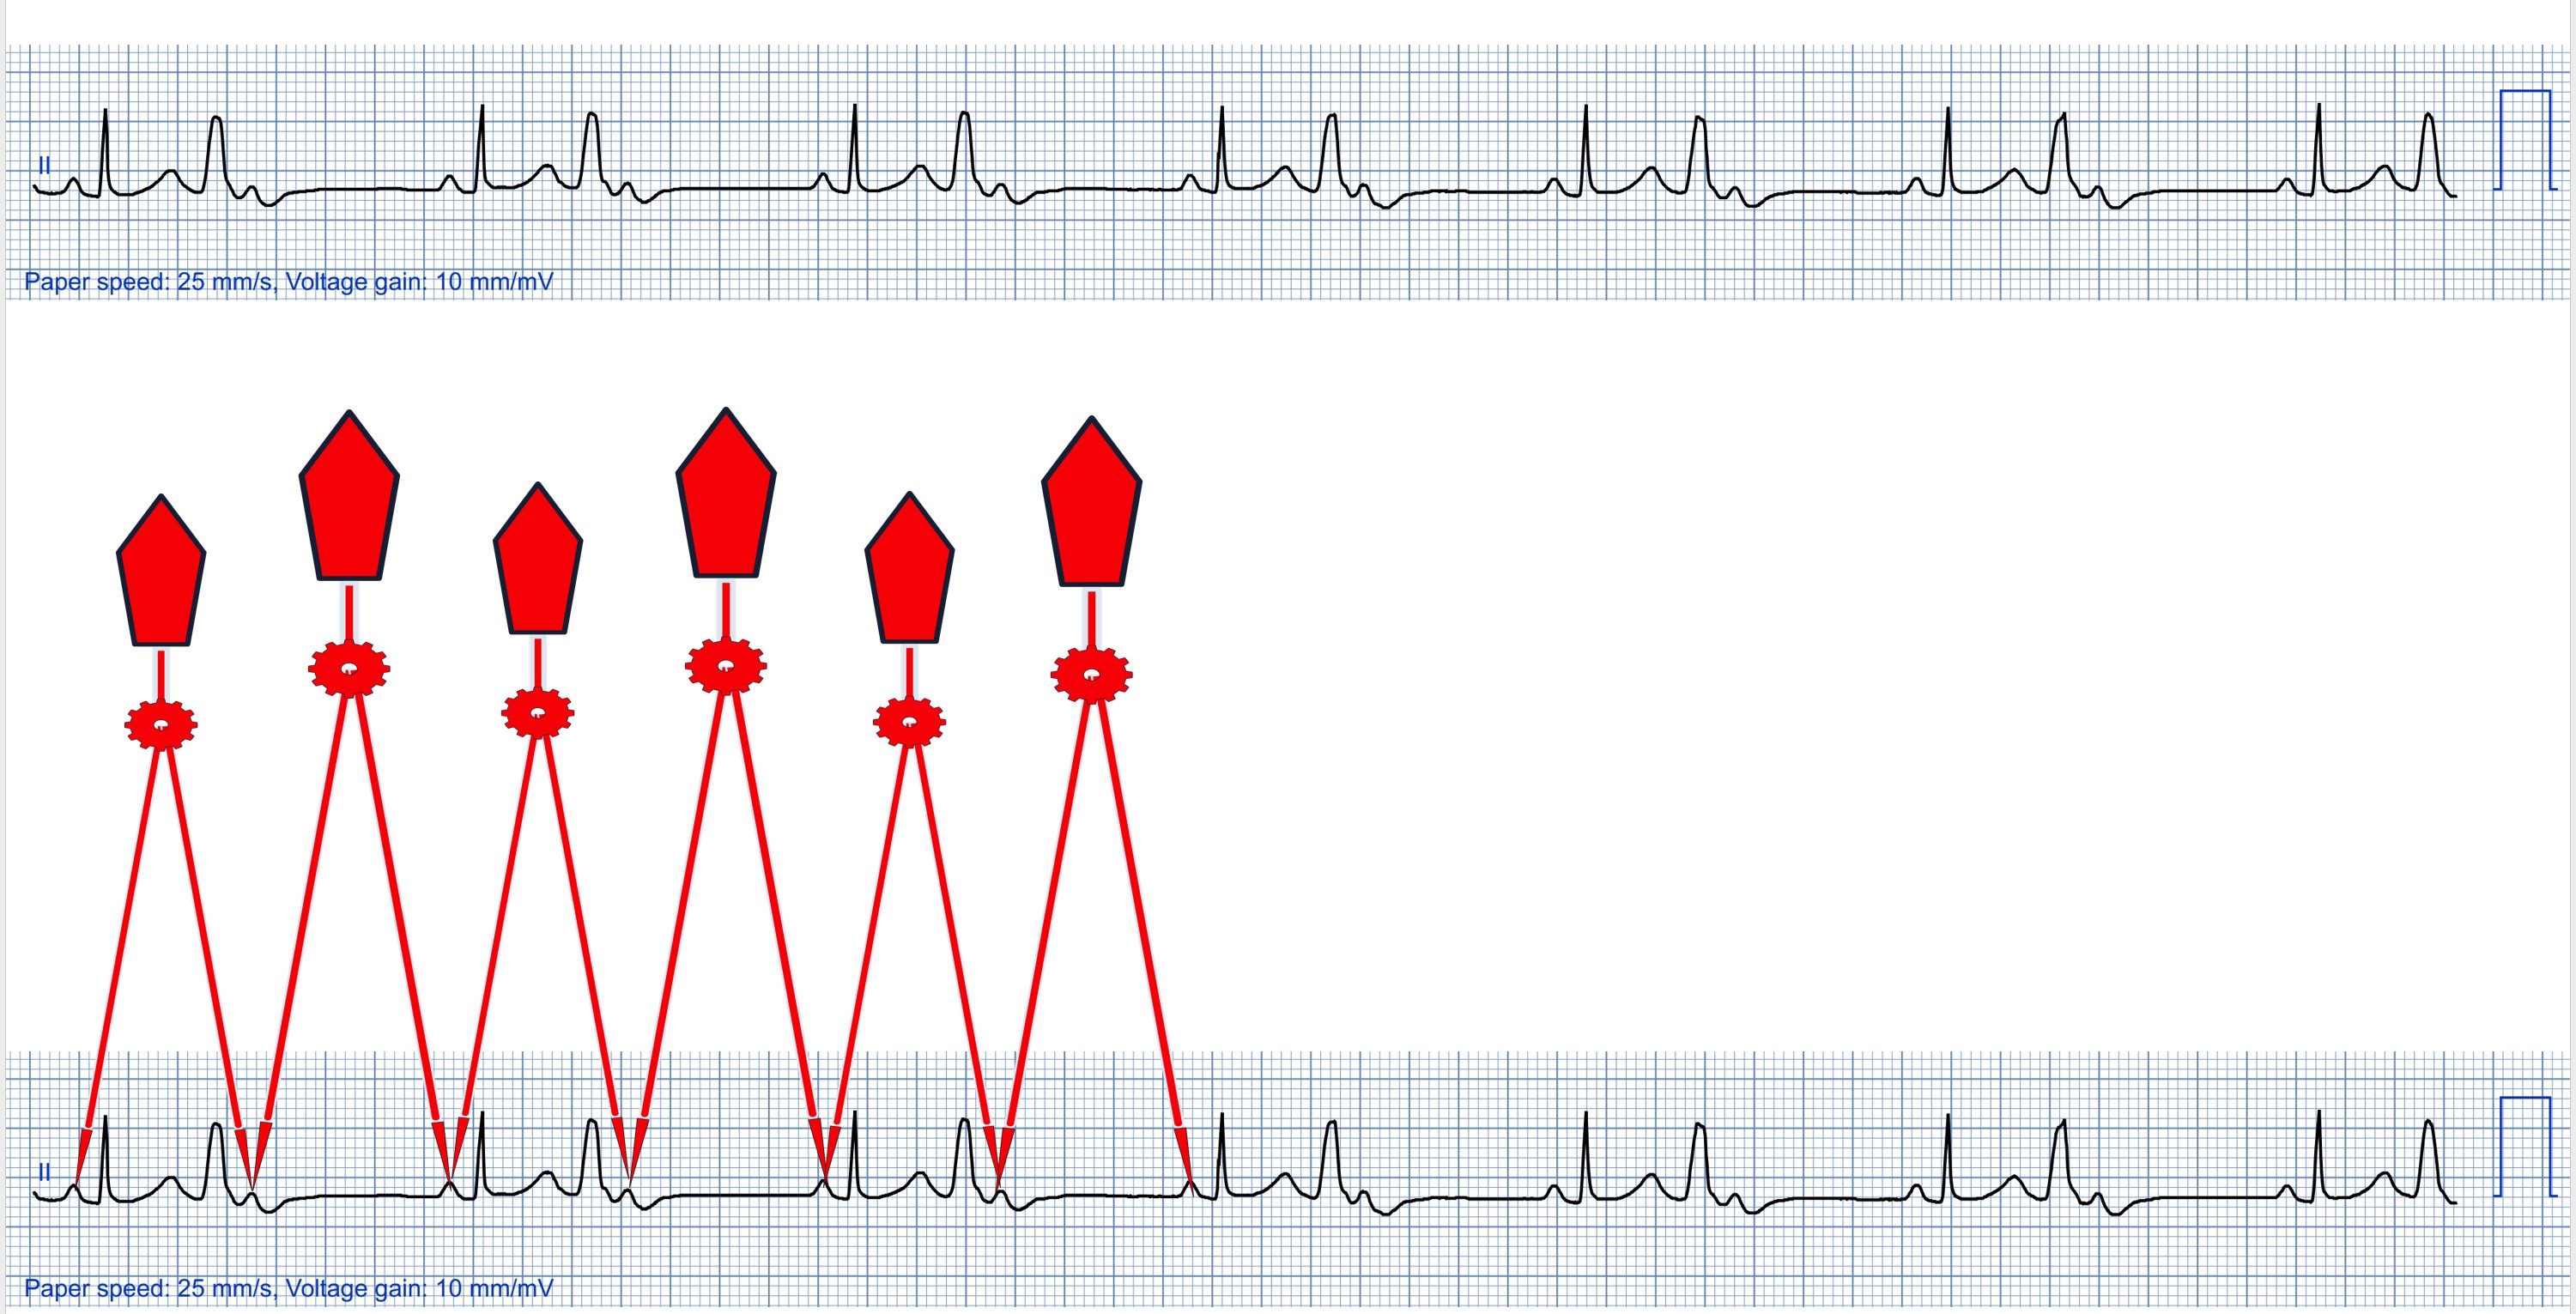
Sometimes you see an ECG and feel overwhelmed at first. This ECG rhythm strip is challenging at first glance. However, if you take a systematic approach to the analysis, it is usually possible to decipher the case.
The solution refers to the numbers in the second ECG:
Beats 1 and 3 are sinus
Beat 2 is a PVC
Beats 4 and 5 are a PVC couplet; the second one has managed to conduct retrogradely and produce a P wave, which resets the sinus node.
Beat 6 is a sinus P Wave with a junctional escape beat just after it (not conducted)
Beat 7 is a PVC

Dr A Röschl's picture

ATRIAL FIBRILLATION

Unfortunately, I can't remember who the author of this ECG is. Perhaps he/she will get in touch with me. However, the ECG is very nice (despite the less than optimal recording quality) and that's why I want to post it. I don't know the history.
In the first section of the ECG we see coarse fibrillation waves and QRS complexes with very different RR intervals, which is why this is atrial fibrillation. It is not atrial flutter because the fibrillation waves are of different size and polarity (depending on the lead) and the intervals between the atrial actions are irregular.

Dr A Röschl's picture

NONSUSTAINED VT

Extract from a Holter ECG, 2 continuous strips, recorded at 25 mm/s. At the top you can see a broad complex tachycardia without recognizable P waves, which ends spontaneously after 2 beats in the lower section. This is a ventricular tachycardia (VT). The very first beat in the 1st strip is most probably a fusion beat. After the end of the VT in the 2nd strip, a narrow QRS complex appears, here you can also recognize that atrial fibrillation is present.

Dr A Röschl's picture

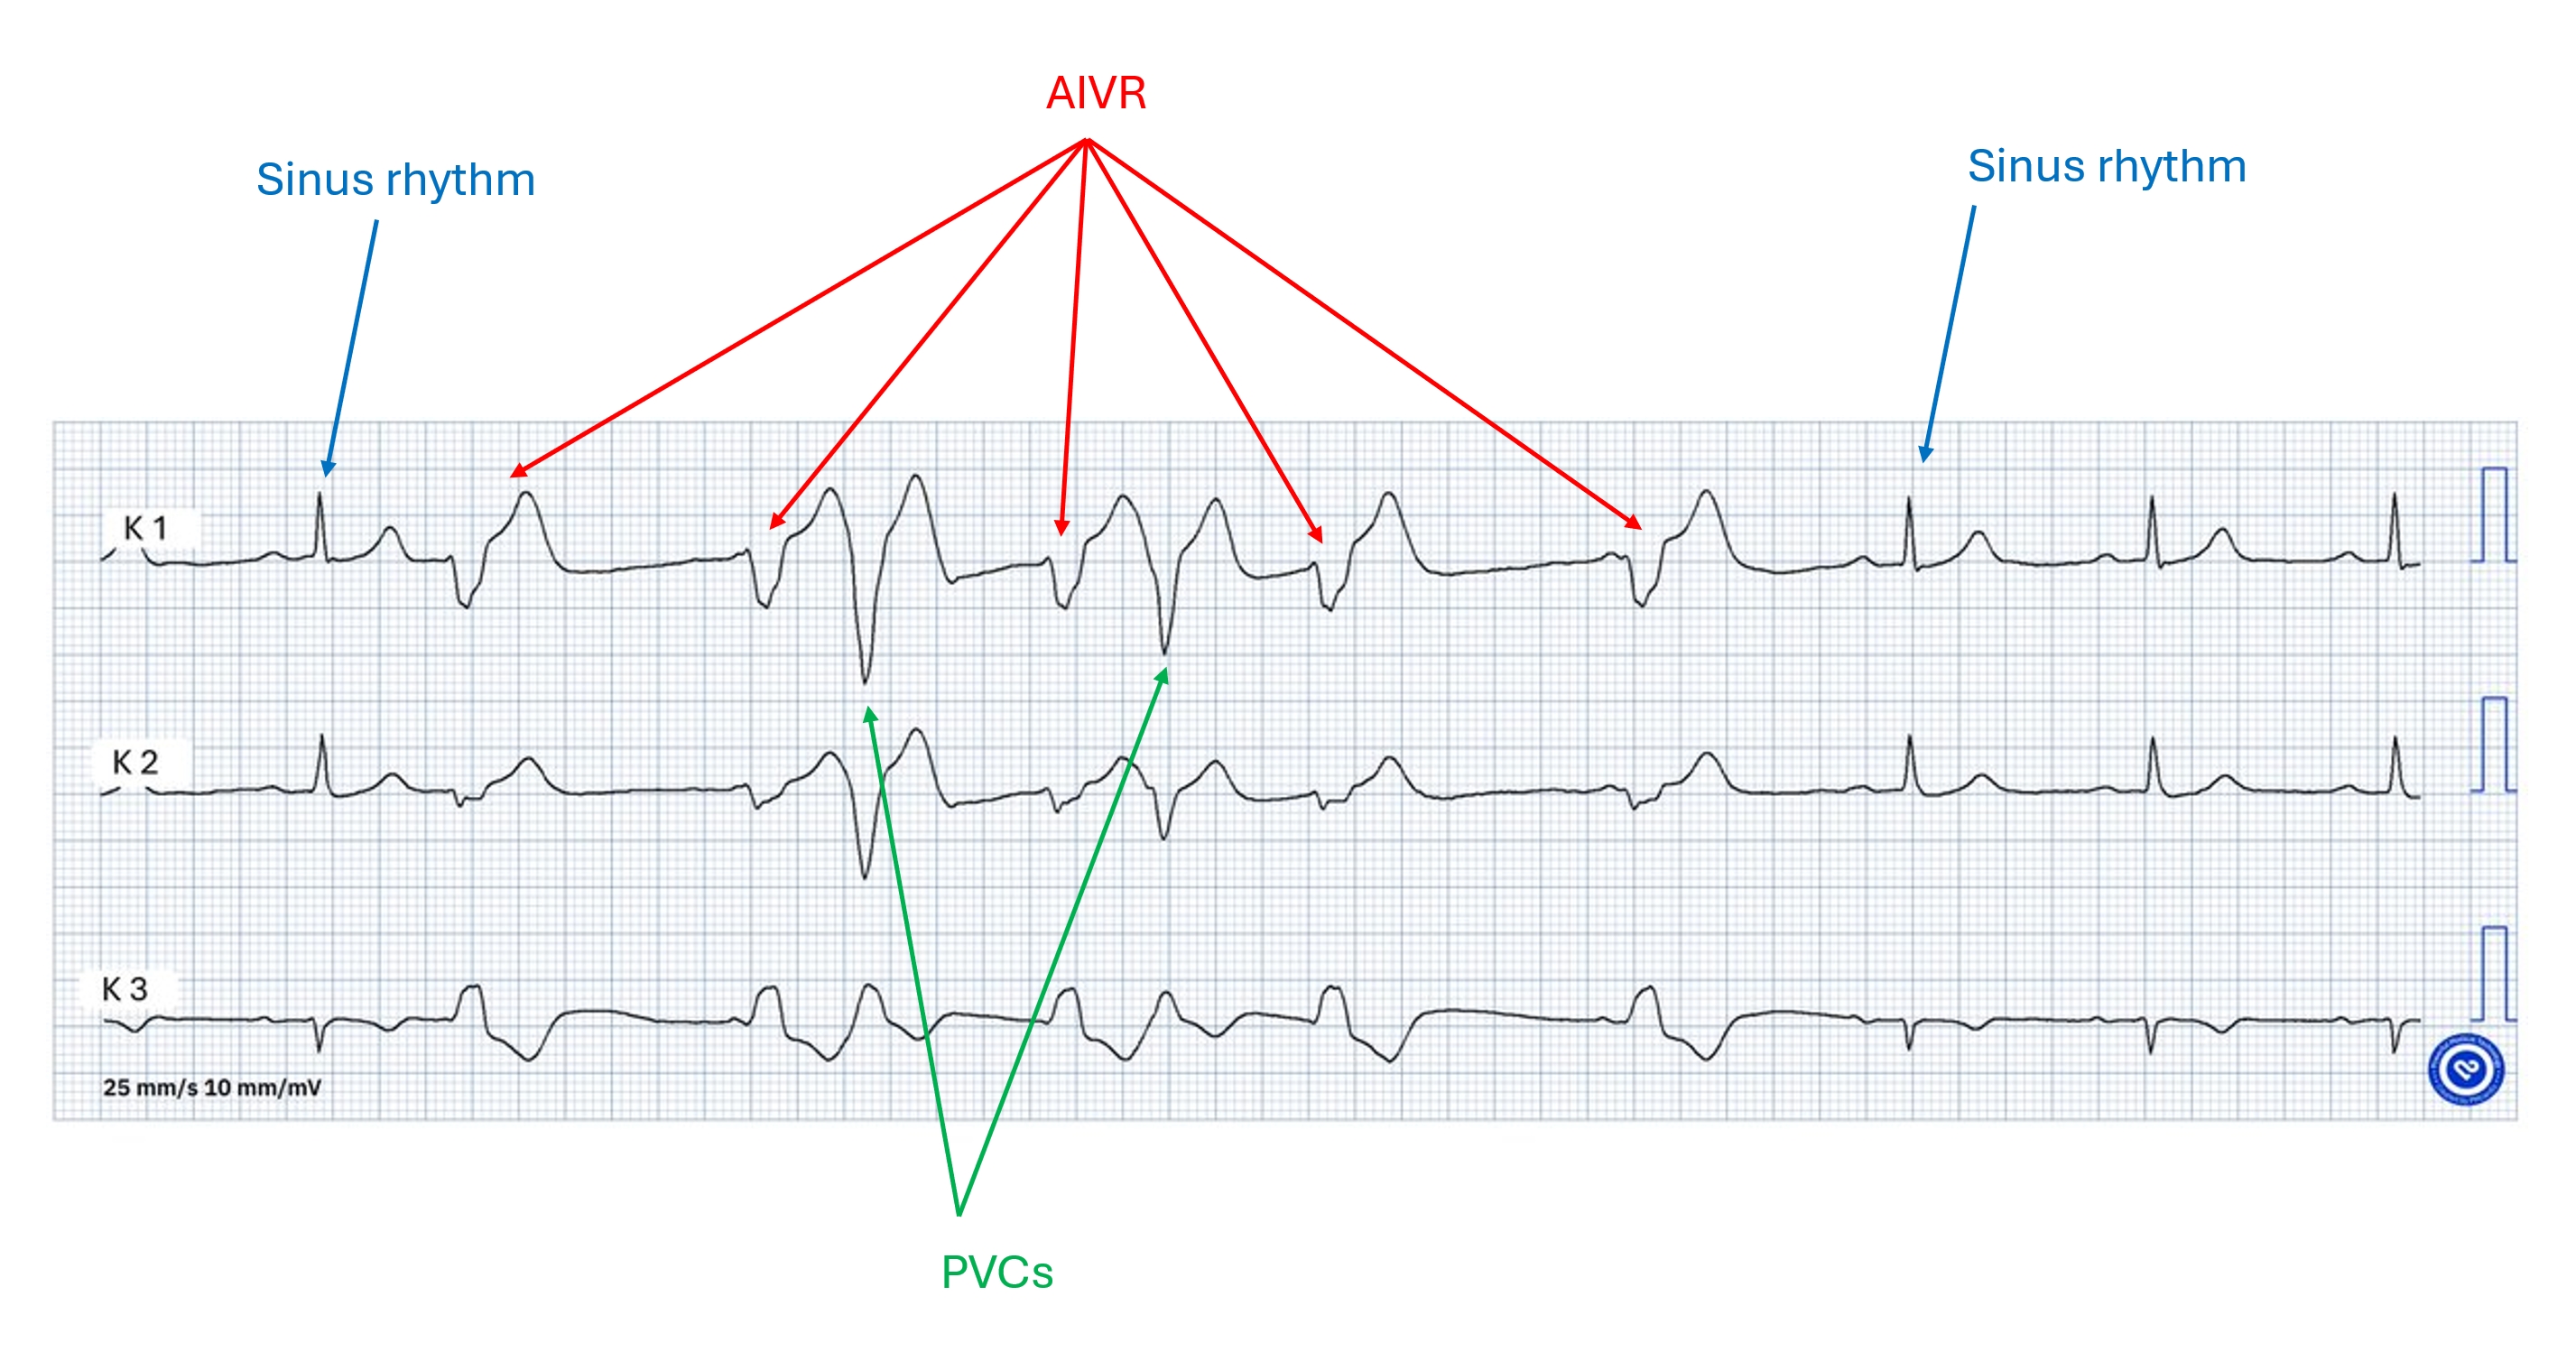
PVCS and MORE

Sometimes you see an ECG strip, look at it and then put it away again with the thought: I don't understand this. But if you take your time and analyze the ECG systematically, you will usually come to a good result. This is an example of such an ECG (certainly not the most difficult). The explanation is shown in the 2nd picture.

Dawn's picture

For Fans of Dr Jerry W Jones

“Jerry W. Jones, MD FACEP FAAEM is pleased to announce the move from LinkedIn to his ECG education website: https://medicusofhouston.com/ . Join him there for his popular twice weekly posts on ECG topics for beginners through advanced and announcements regarding his Masterclasses and book releases.” I want to thank all of you for your interest in my teaching and in electrocardiography. I hope to see you in one of my Masterclasses soon! And I hope to hear from you in my new location! Jerry W. Jones, MD FACEP FAAEM

Dr A Röschl's picture

Sick Sinus Syndrome

The ECG shows an example of a patient with bradycardia/tachycardia syndrome (also called sick sinus syndrome). Initially, a sinus rhythm with a heart rate of approx. 70 bpm is seen. This is followed by sinus arrest of just under 3000 ms, followed by a junctional escape beat (no preceding P wave, QRS remains narrow). After a further pause of just under 2000 ms, 2 sinus node beats follow, which merge into a sinus tachycardia or atrial tachycardia (heart rate approx. 120 bpm here).

Pages

All our content is FREE & COPYRIGHT FREE for non-commercial use

Please be courteous and leave any watermark or author attribution on content you reproduce.