Displaying 1 - 10 of 13
Dr A Röschl's picture

ECG OF A 3 YO BOY, IS IT NORMAL?

Here is the ECG of a 3-year-old boy. Is there cause for concern? The ECG shows a sinus rhythm with significant sinus arrhythmia. The heart rate increases with inspiration and decreases with expiration, which is called respiratory sinus arrhythmia. The QRS-axis is between 60 and 90 degrees, which is physiological at this age. The negative T-waves in V1-V3 (V4) are also age-appropriately normal. Therefore, there is no reason for concern; the ECG is considered normal for the child's age.

Dawn's picture

ECG Basics: Accelerated Junctional Rhythm Overriding Normal Sinus Rhythm

This strip shows a junctional rhythm at a rate of 110 beats per minute. The QRS complexes are slightly wide at .10 seconds (100 ms), and they are within the parameters for supraventricular rhythm. The term, "junctional tachycardia" could be used, also, but this is not likely a "reentrant" junctional tachycardia, which would be fast, regular, and have a sudden onset. That type of junctional tachycardia is a PSVT.   In this strip, we can see the underlying sinus rhythm in P waves that appear to pop up randomly.  However, if you march out the P waves, you will find that they are regular, at a rate of about 90 per minute.  The junctional rhythm has overrun the sinus rhythm.  Most of the P waves cannot conduct due to where they have landed - in the refractory period of the QRS.  The exception might be the P wave after the fifth QRS.  The sixth QRS might be conducted from that P wave.

When accelerated junctional rhythm is encountered, you should suspect DIGITALIS TOXICITY - the classic dysrhythmia associated with digitalis toxicity is accelerated junctional rhythm. Other causes in adults could be beta-agonist drugs such as adrenalin, cardiac infection, ischemia, or surgery.
 

Dawn's picture

Normal 12-Lead ECG

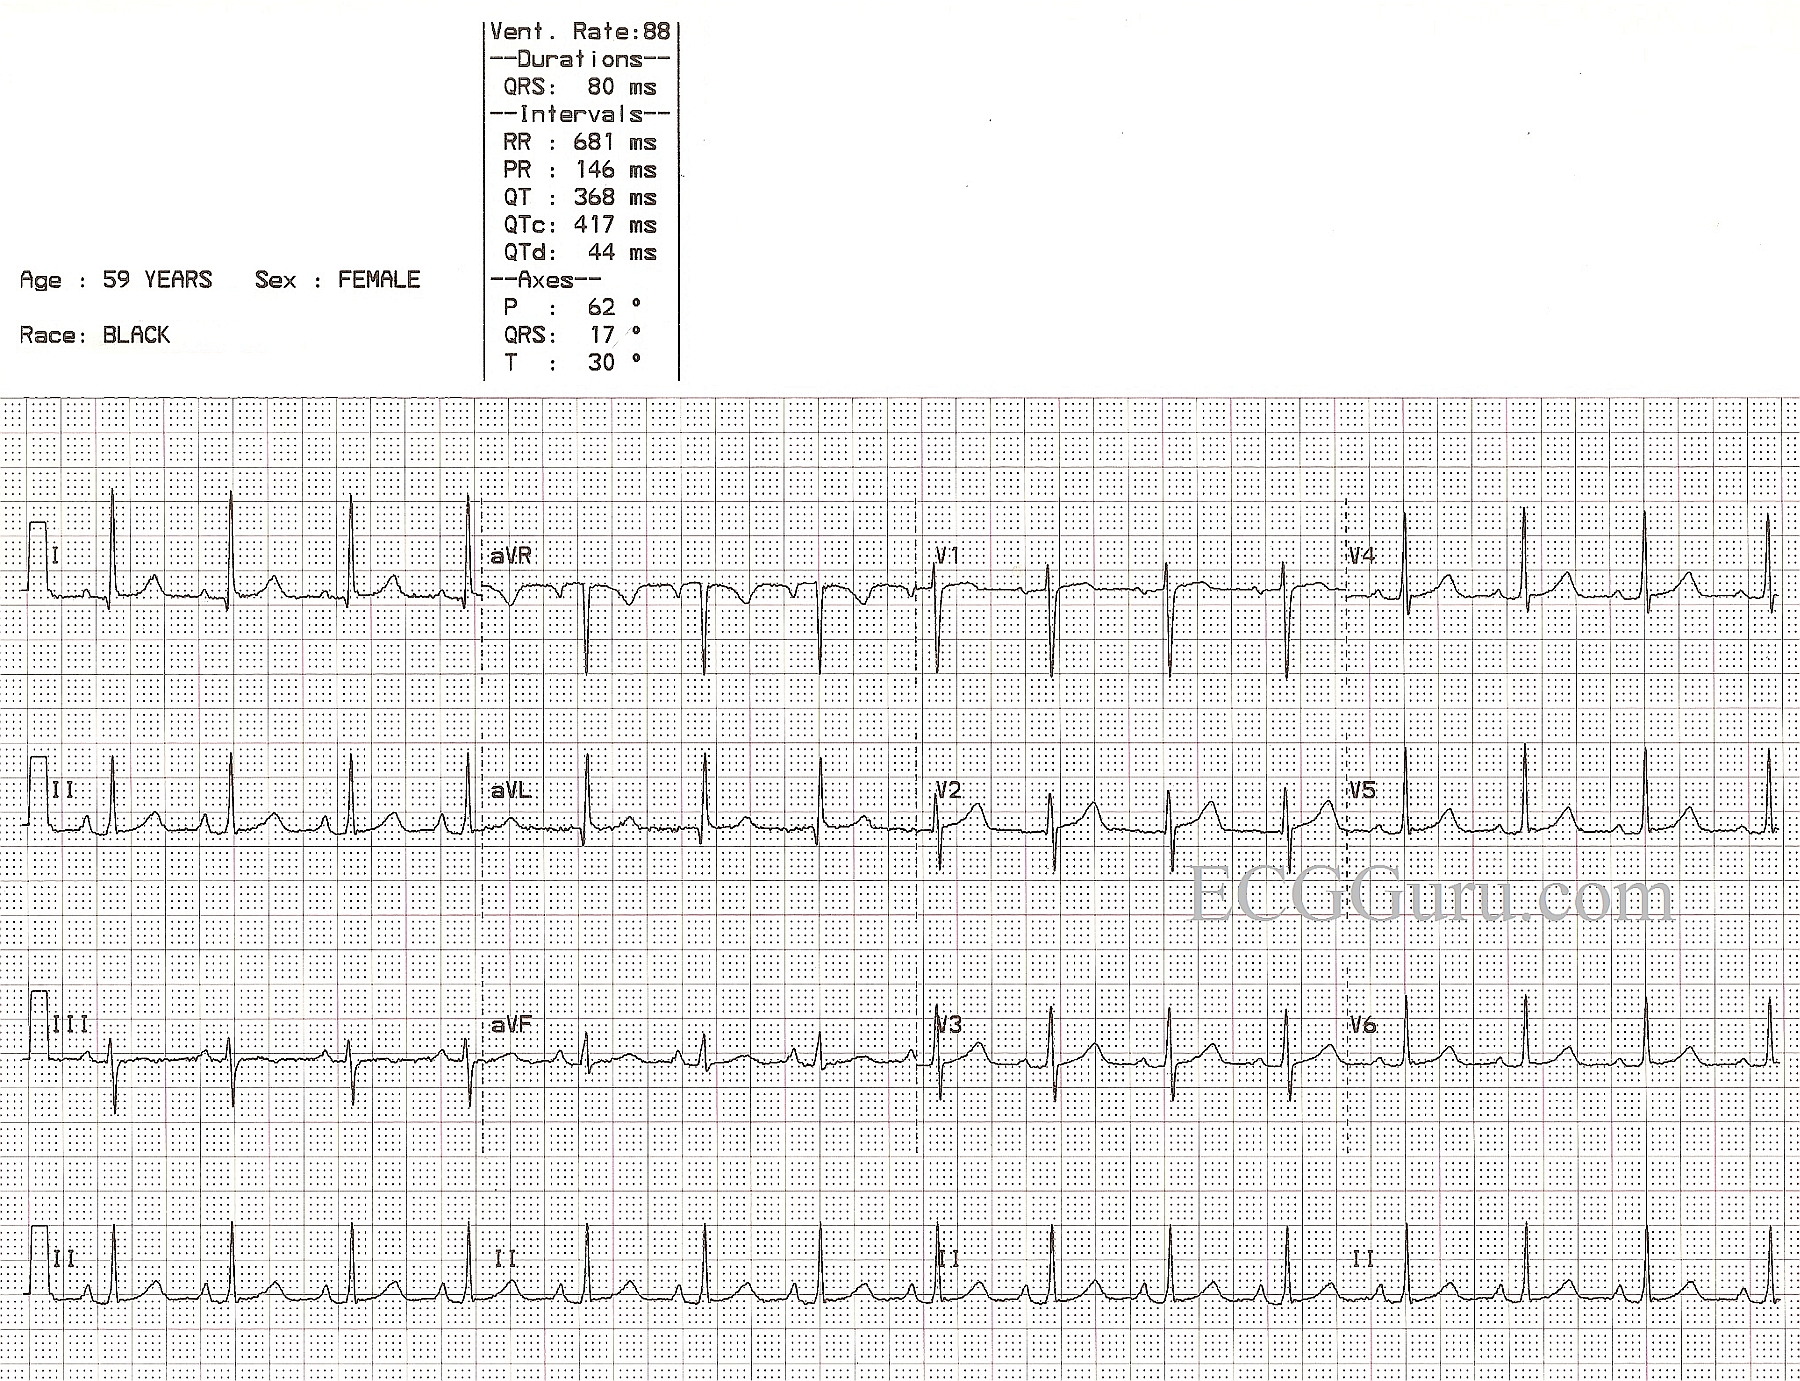
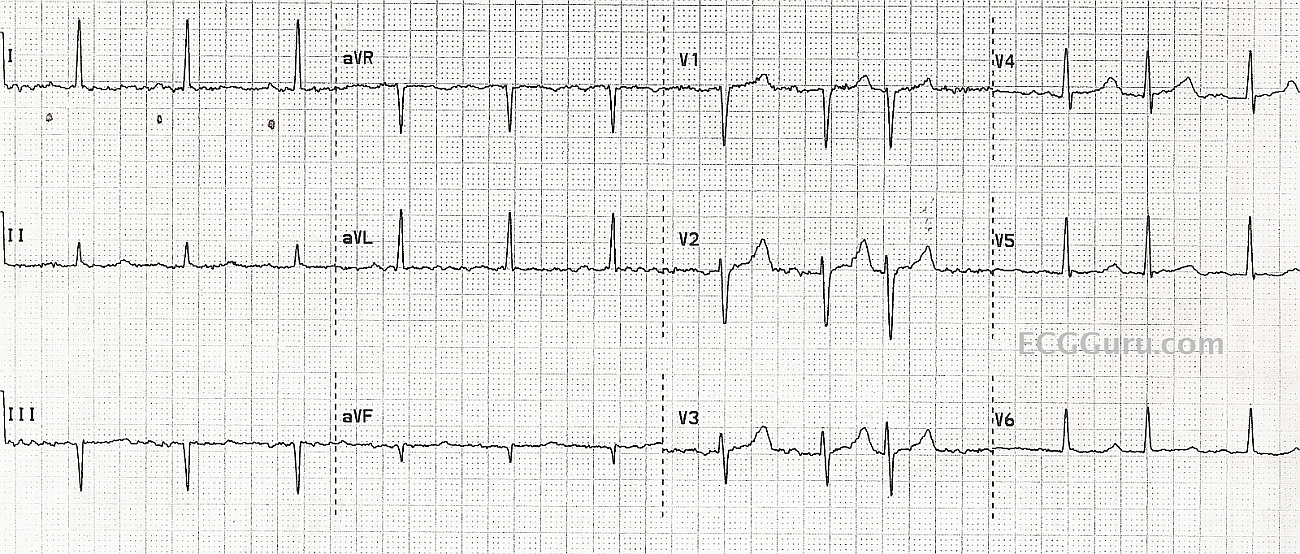
This ECG is nearly completely normal.  We say "nearly" because there are VERY subtle changes which may or may not be chronic.  Unfortunately, we know nothing about this patient's history or circumstances except age, gender, and race, and the fact that she was an Emergency Department patient.  If she presented with chest pain, the ECG might be viewed completely differently than if she presented with a fever.

So, first, let's look at what is within NORMAL range.  Most of these characteristics will be readily seen by your BASIC LEVEL students.  The rate and intervals are within normal ranges.  The rhythm is normal sinus rhythm.  There is good R wave progression in the precordial leads.  That is, V1 is primarily negatively-deflected and V6 is positive, with Leads V2 through V5 gradually becoming more and more positive.  The frontal plane axis is within normal range - Leads I and II are positive.  This would be a suitable ECG to use when introducing beginning students to the 12-lead ECG.

As for what is NOT NORMAL, there are several subtle characteristics.  First, the P waves are slightly tall and have a pointed appearance.  The P wave in V1 is biphasic.  This can represent P PULMONALE, a sign of right atrial strain.  This is often seen with pulmonary disease.  One might also expect to see a shift of the frontal plane axis to the right if there is right ventricular hypertrophy as a result of increased strain on the right heart, but here we see a subtle shift to the left.  The axis is still within normal limits, but at 17 degrees, it is closer to the left than the right.

The ST segments here are not perfect.  One could argue that there is VERY slight elevation in Leads I and aVL, and the shape of the ST in V1 is coved upward.   Lead III's ST segment is flat, and the T wave is inverted.  Without clinical corelation, it is impossible to determine the importance of these changes.  It is a good discussion to have with your more advanced students.

As said, it would be MUCH easier to ascribe meaning to these changes if we knew something of the patient's chief complaint, symptoms, and history.

Dawn's picture

Normal Sinus Rhythm With PACs Misdiagnosed As Atrial Fibrillation

This patient was diagnosed by the rescue crew as having atrial fibrillation, based on the fact that they thought the rhythm was irregular, and they could not see P waves.  They also noted a wavy baseline, and considered it to be fibrillatory waves.  In reality, the underlying rhythm is regular, with some PACs (regularly irregular). The P waves are small and hard to see in the baseline artifact.  We have marked the P waves in Lead I with small dots.  

It pays to look at multiple leads, reduce artifact as much as possible, and look at the strip for evidence of an underlying rhythm.  

It is not shown here, but the ECG machine is often able to show that the P waves are present by giving a PR interval and P wave axis in the diagnostics.

Dawn's picture

Early Repolarization

This ECG was obtained from a healthy 29-year-old man.  It shows "benign early repolarization".    It demonstrates the typical pattern of widespread ST elevation with a normal concave upward sloped ST segment.  There are also prominent U waves in V2 through V4, and T wave inversions in the inferior wall leads. He was not complaining of any symptoms and, in fact, donated this ECG as an example of known early repolarization pattern.  The other changes may represent normal variations for his age and gender. Early repolarization has long been thought to be a completely benign variant, and it is quite common in young people, especially athletic men.  But new research suggests a possible link to future serious arrhythmias. For a discussion of research on this topic from the Journal of the American College of Cardiology, see this link.  Research reported in the New England Journal of Medicine can be accessed at this link.

Dawn's picture

ECG Basics: Baseline Artifact

This rhythm strip shows normal sinus rhythm, slightly on the fast side of normal at 95 bpm.  The baseline undulates up and down with the movements of the patient's chest as she breathes.  One way to correct this problem on a monitor strip is to move the limb electrodes away from the chest and onto the limbs.

jer5150's picture

Jason's Blog: ECG Challenge for the months of July and August, 2014.

This is an ECG I performed a couple of years ago on an asymptomatic 83-year old man as an outpatient procedure. 

The computer interpreted this as:  "Marked sinus bradycardia [with] Frequent Premature ventricular complexes".  IS THE COMPUTER CORRECT?  Is there more than one plausible interpretation?  What is the differential diagnosis?

Dawn's picture

ECG Basics: Normal Sinus Rhythm

We try to remember to include some good old "Normal Sinus Rhythm" strips from time to time.  Teachers often have large collections of strange and unusual strips that their colleagues have saved for them.  But, then they find themselves resorting to electronic rhythm generators for samples of "normal".  Here is a strip from a healthy, 23-year-old woman showing NSR.  The rate is 65 bpm, QRS duration 76 ms, PRI 136 ms, QTc 410.  There are no abnormal ST segments or T wave changes.  There are very slight rate changes from beat to beat, and the P waves appear to change morphology a bit.  This can be due to the patient's breathing movements, and we would not delve too deeply into this in light of the fact that this is an ECG from an asymptomatic young ECG student.  Absolute precision would come from an generator, but rarely from a human being. This is a good strip to teach rate and interval determination.

jer5150's picture

Jason's Blog: ECG Challenge for the month of May, 2014.

Patient data:  54-year old man who recently underwent a major cardiac procedure.  At first glance, this ECG may not appear to be particularly unique but a closer inspection reveals something unusual going on here. 

Dawn's picture

ECG Basics: Normal Sinus Rhythm With ST Segment Elevation

This Lead II rhythm strip was taken from a 12-Lead ECG performed on a 66-year-old man who was having an acute inferior wall M.I.  The rhythm is normal sinus rhythm at 65 bpm.  The QRS complex is slightly wide at 112 ms (.11 seconds).  The patient did not have a bundle branch block pattern on his 12-lead ECG.  The PR interval is .17 seconds, and the P waves are widened and have a "double peak".  This can be a sign of left-sided heart failure, and is called P Mitrale.  Your students should be advised not to try to diagnose acute M.I. from a monitor strip, as ST segments can be inaccurate on some types of monitors.  However, any derangement of the ST segment on a monitor strip calls for an immediate 12-Lead ECG for confirmation.

Pages

All our content is FREE & COPYRIGHT FREE for non-commercial use

Please be courteous and leave any watermark or author attribution on content you reproduce.