This ECG is from a 46-year-old woman with diabetes mellitus. She presented to the Emergency Dept. with a complaint of weakness. Her BP was elevated at 186/102. Her blood glucose was 936 mg/dL (normal 70-105).
So, what does her ECG show?
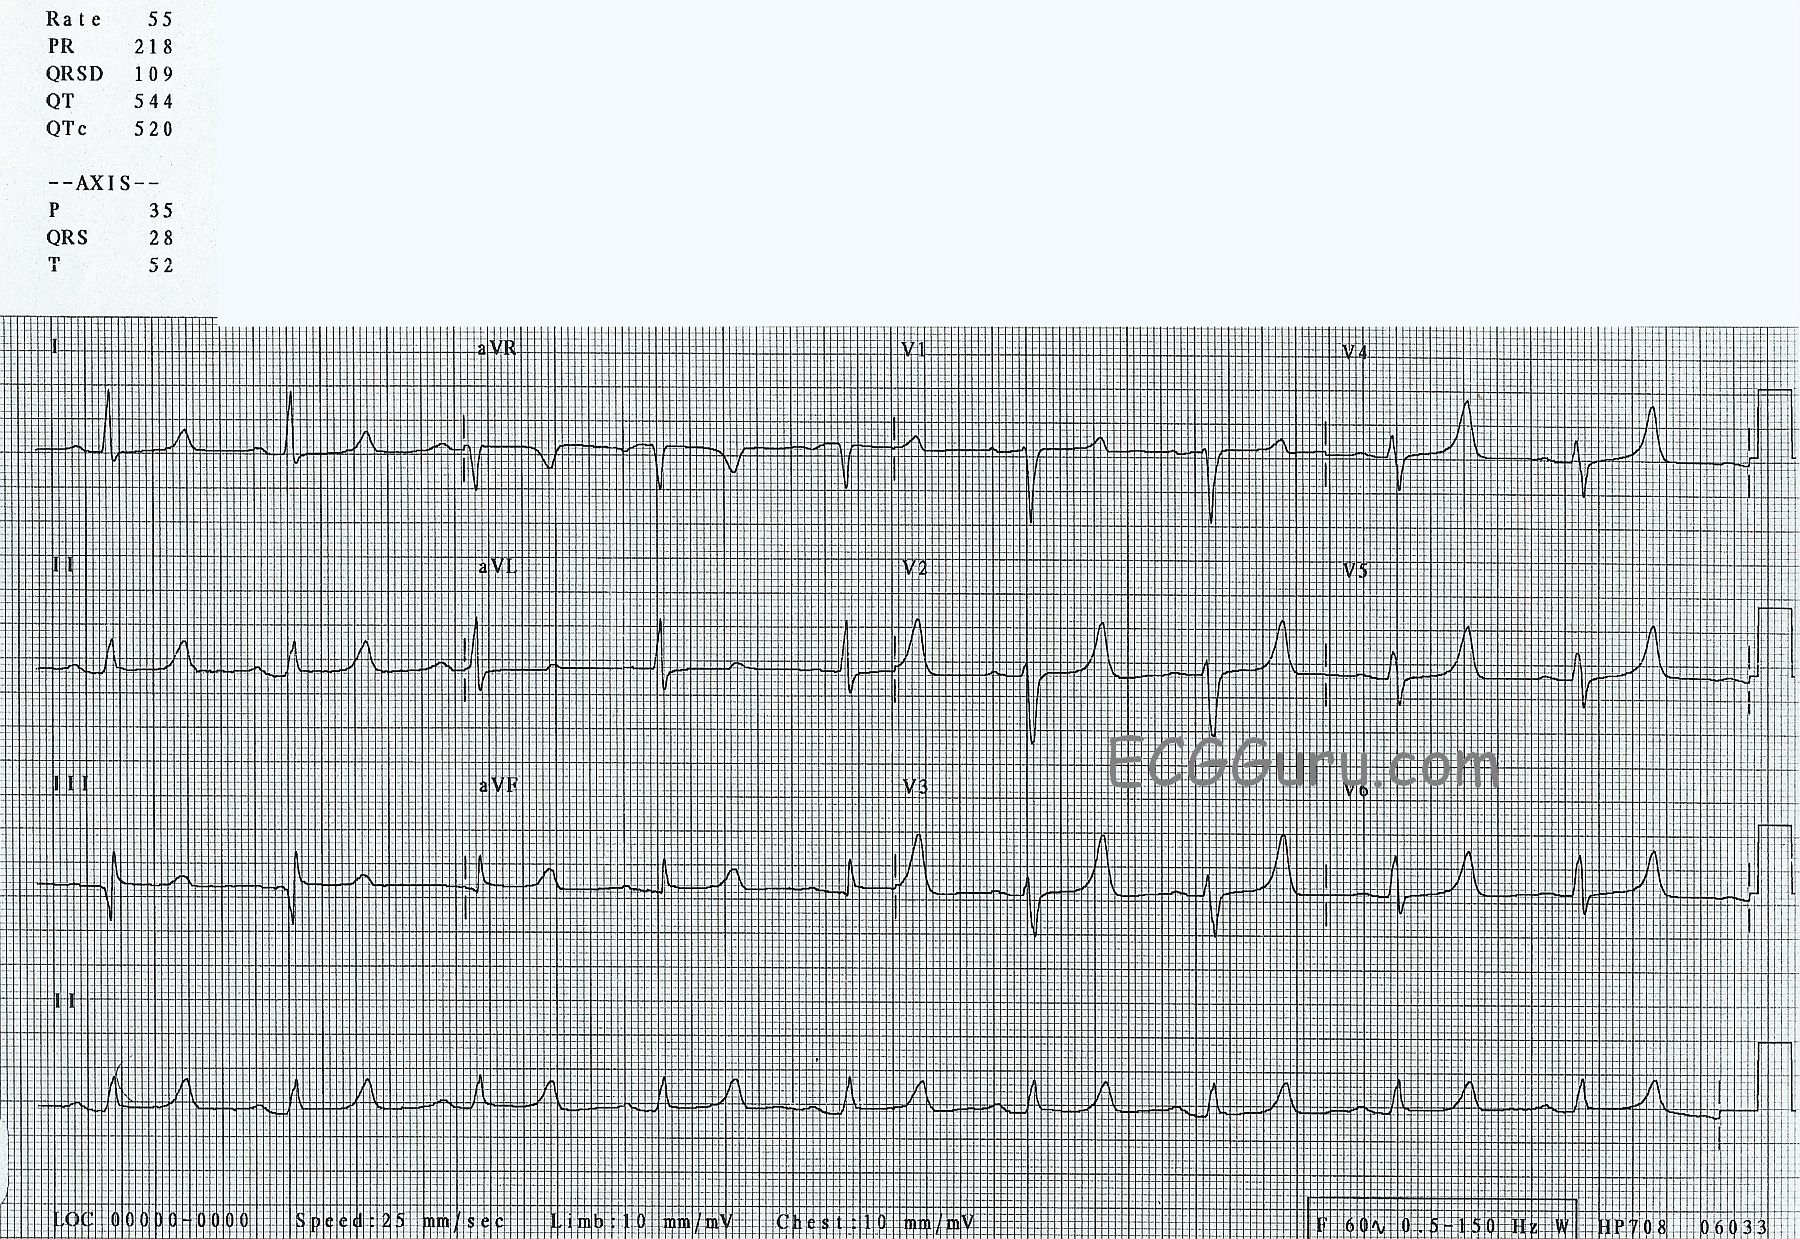
1) Sinus bradycardia at 55 bpm. The rhythm is regular, with no extrasystoles.
2) A slightly prolonged PR interval at 218 ms (.218 seconds). Normal is 120-200 ms.
3) A “wide side of normal” QRS duration at 109 ms. Normal is 70-100, but can be a little longer in normal individuals.
4) A prolonged QTc interval at 520 ms. Normal QTc is 460 ms or less in women. A helpful rule of thumb is that the QT should be less than half the preceding RR.
5) Normal P waves.
6) Normal axes of P, QRS, and T waves.
7) A large Q wave in Lead III which is not repeated in aVL. This can be inconsequential when confined to Lead III, or can be a pathological Q wave, especially if also seen in aVF.
8) Flat ST segments. Normal ST segments are convex upward, like a smile.
9) Tall, peaked T waves in precordial leads V2 through V6, and in Lead II.
What does it mean?
Unfortunately, we do not have complete labs for this patient, or any information about her outcome.
We know that patients who have uncontrolled diabetes are at risk for renal failure, so we should consider electrolyte imbalances when we see abnormalities in the ECG.