Displaying 1 - 10 of 11
Dawn's picture

Atrial Fibrillation With Aberrant Conduction in Adolescent Patient

The Patient:  This ECG was taken from a 14-year-old girl with a complaint of palpitations.  Her medical history is not known.

The ECG:  The rate is about 160 bpm, with an irregularly-irregular rhythm.  There are no P waves.  This is atrial fibrillation.  There are several different morphologies noted in the QRS complexes.  First, a narrow QRS with normal axis, as demonstrated in beats #5 and #7.  There are distinctly wide QRS complexes with a right bundle branch block pattern.  See beats #2, #3, and #19.  This represents aberrant conduction.  Atrial fib often displays aberrant conduction, especially when a beat follows closely after a long R-R cycle followed by a short R-R cycle. The refractory period is set by the preceding cycle.  So a lont R-R causes a longer refractory period.  The short R-R that follows finds itself in a relative refractory period - not refractory enough to prevent conduction altogether, but in this case, the right bundle branch has not yet recovered, so the impulse continues down the left bundle, bypassing the right bundle branch.  The right ventricle depolarizes late, causing a widening of the QRS.

There is a sliight variation seen in the aberrant beats, notably in #1 and #2.  This may represent varying amounts of aberrancy, where the pathways change slightly from beat to beat.  Atrial fibrillation is rare in children and adolescents, but can be caused by many factors, including stress, caffeine, endocrine disorders, obesity, and heart infections.  

This ECG was published by me on Facebook nearly a decade ago, and received some excellent comments from Dave Richley and Dr. Ken Grauer (two of our favorite Gurus).  I will reproduce them here to spare them re-writing their comments.

Dawn's picture

Rate-related Left Bundle Branch Block

The patient:  This ECG is from an 87-year-old man who was transported to the Emergency Department by paramedics. His chief complaint, as reported by caregivers, was lethargy, fever, and a declining mental status.  He appeared tired and slightly confused, and was normotensive.

The ECG:  There are a rhythm strip with two leads, II and III, and also a standard 12-lead ECG. The RHYTHM STRIP shows a tachycardiac rhythm that slows very slightly toward the end.  The rate is around 107 bpm, with an R to R interval of approximately 543 ms in the earlier, regular portion.  There are regular P waves present, all followed by QRS complexes.  Most of the QRS complexes are normal width, but the 2nd, 5th, and 8th are slightly wide at 130 ms, or .13 seconds.

These wider QRS complexes represent aberrant conduction with LBBB occurring intermittently.  Aberrant conduction often occurs due to a faster heart rate, but the only clue here is the intermittent conduction disturbance seems to disappear when the rate slows very slightly.  It is hard to determine mechanism of aberrant conduction when we have only a ten-second rhythm strip.

The 12-LEAD ECG  has essentially the same rate and rhythm, except all the beats in the first ¾ of the ECG are conducted aberrantly, in a LEFT BUNDLE BRANCH BLOCK pattern.  This indicates that the LBB is refractory at this time.  Beat No. 15 is premature (PAC).  The pause after the PAC allows the left bundle branch to repolarize, conducting one single beat normally.

Dawn's picture

Wide-complex Tachycardia: Ventricular Tachycardia

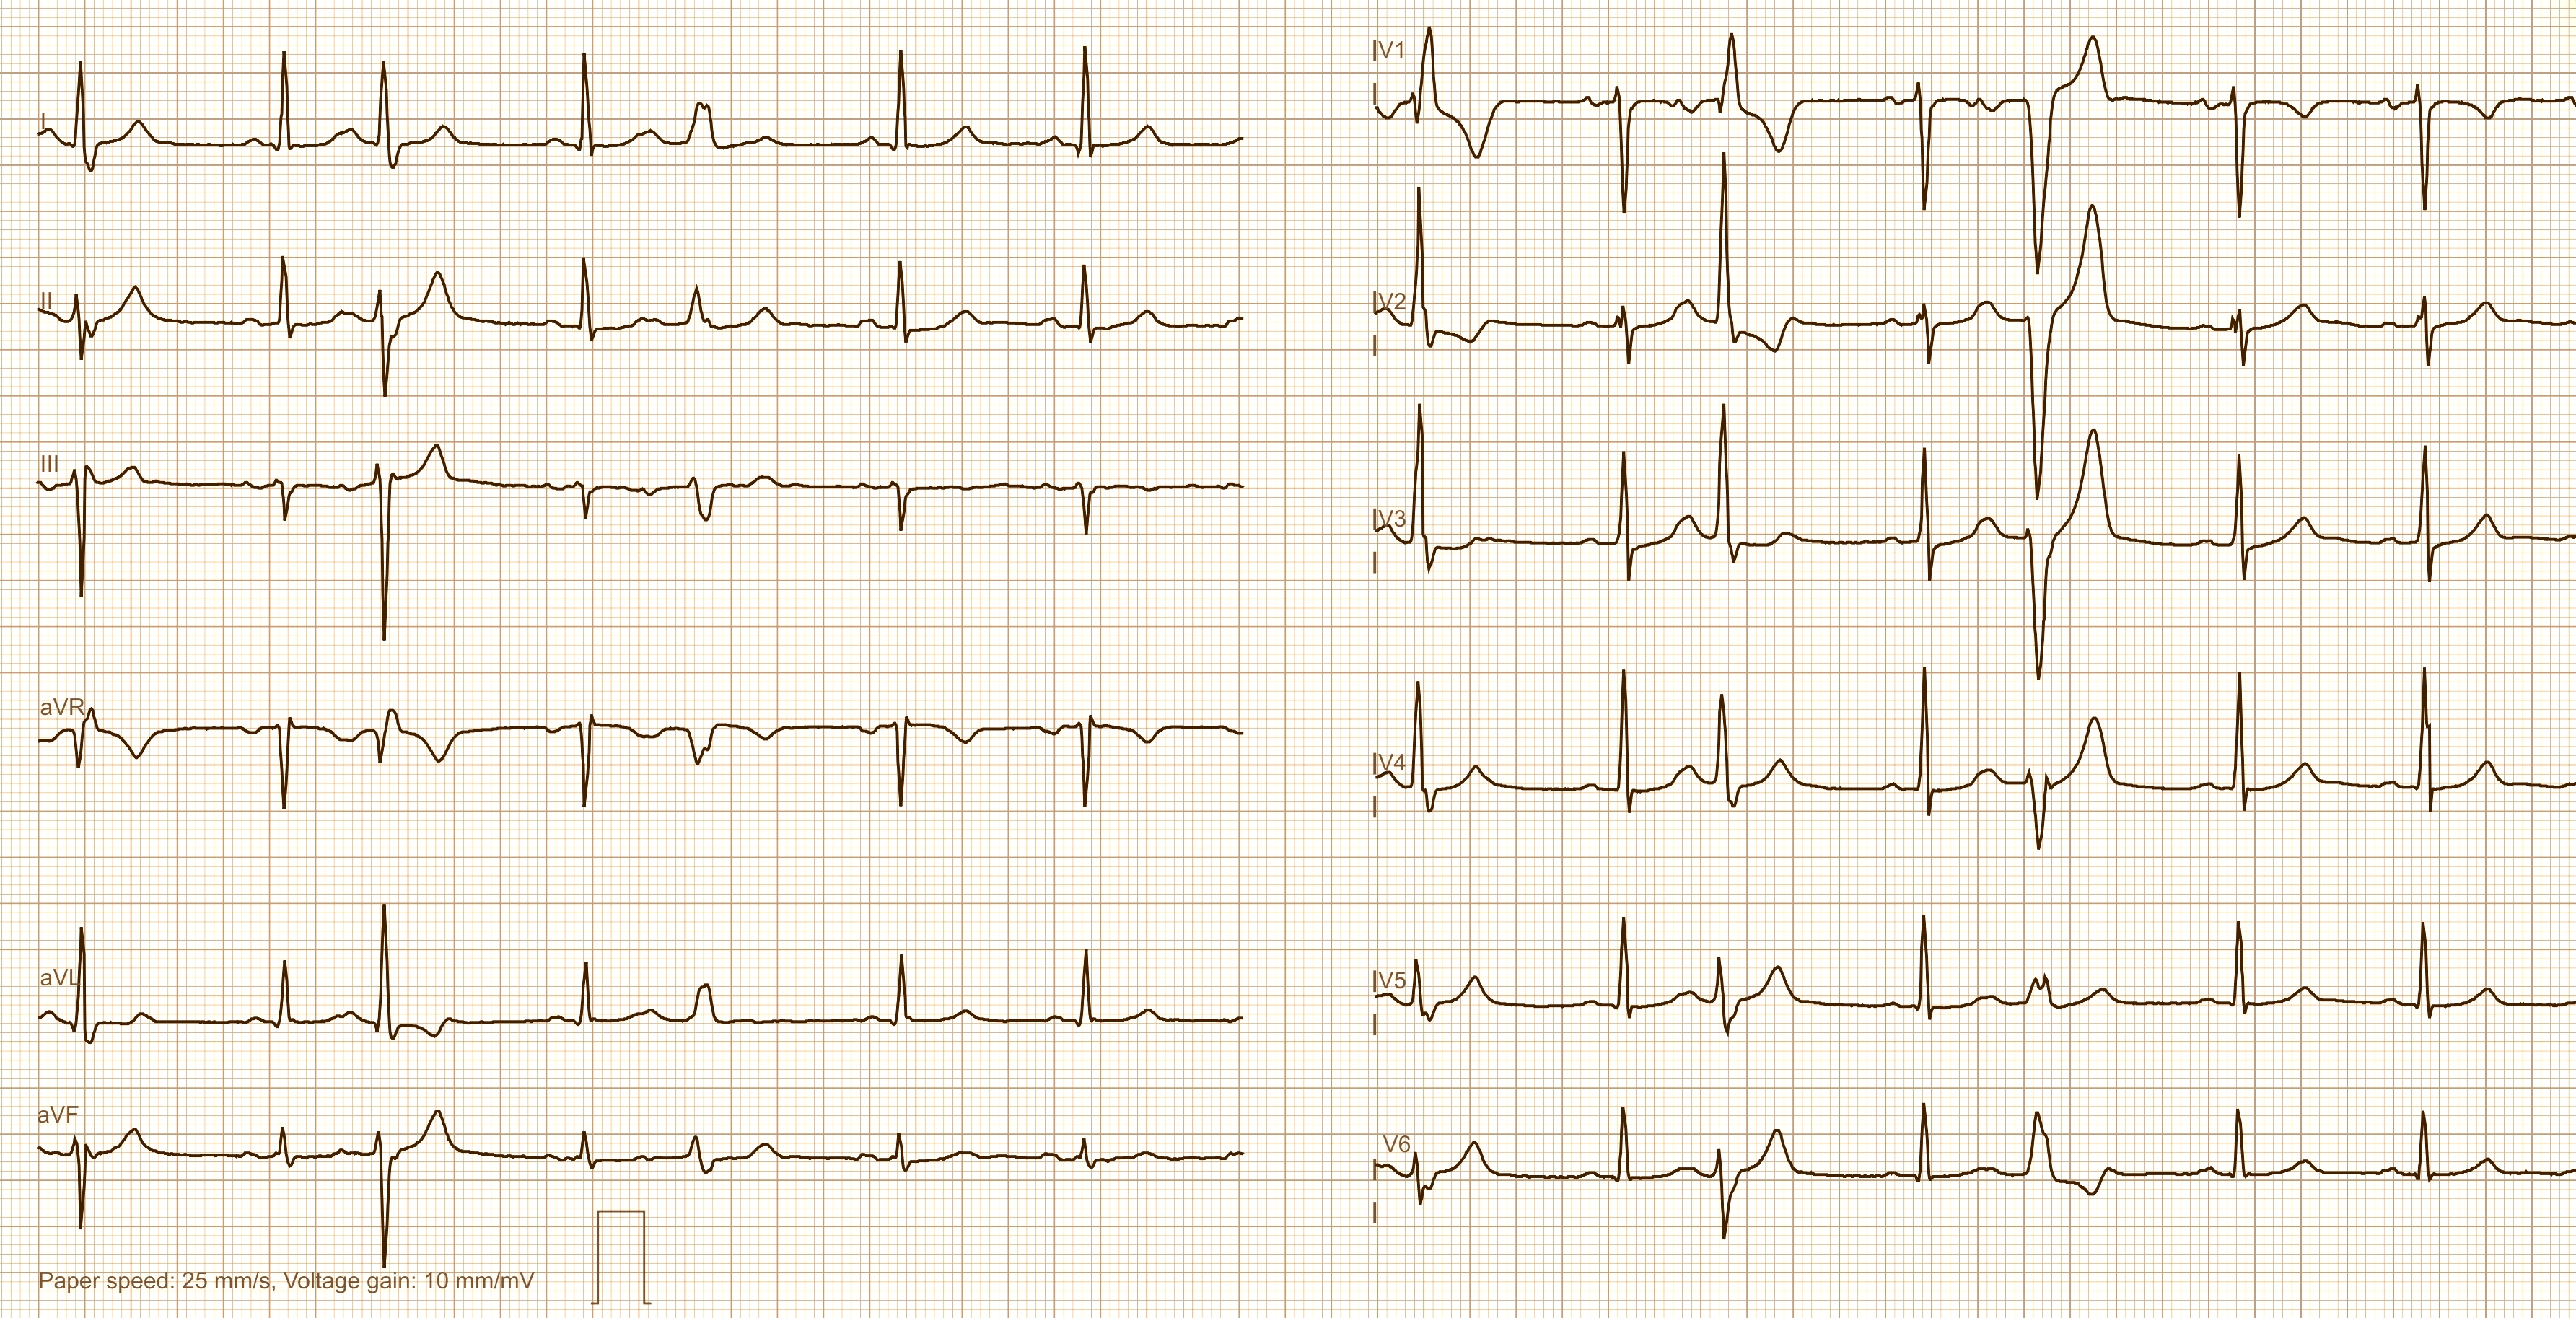
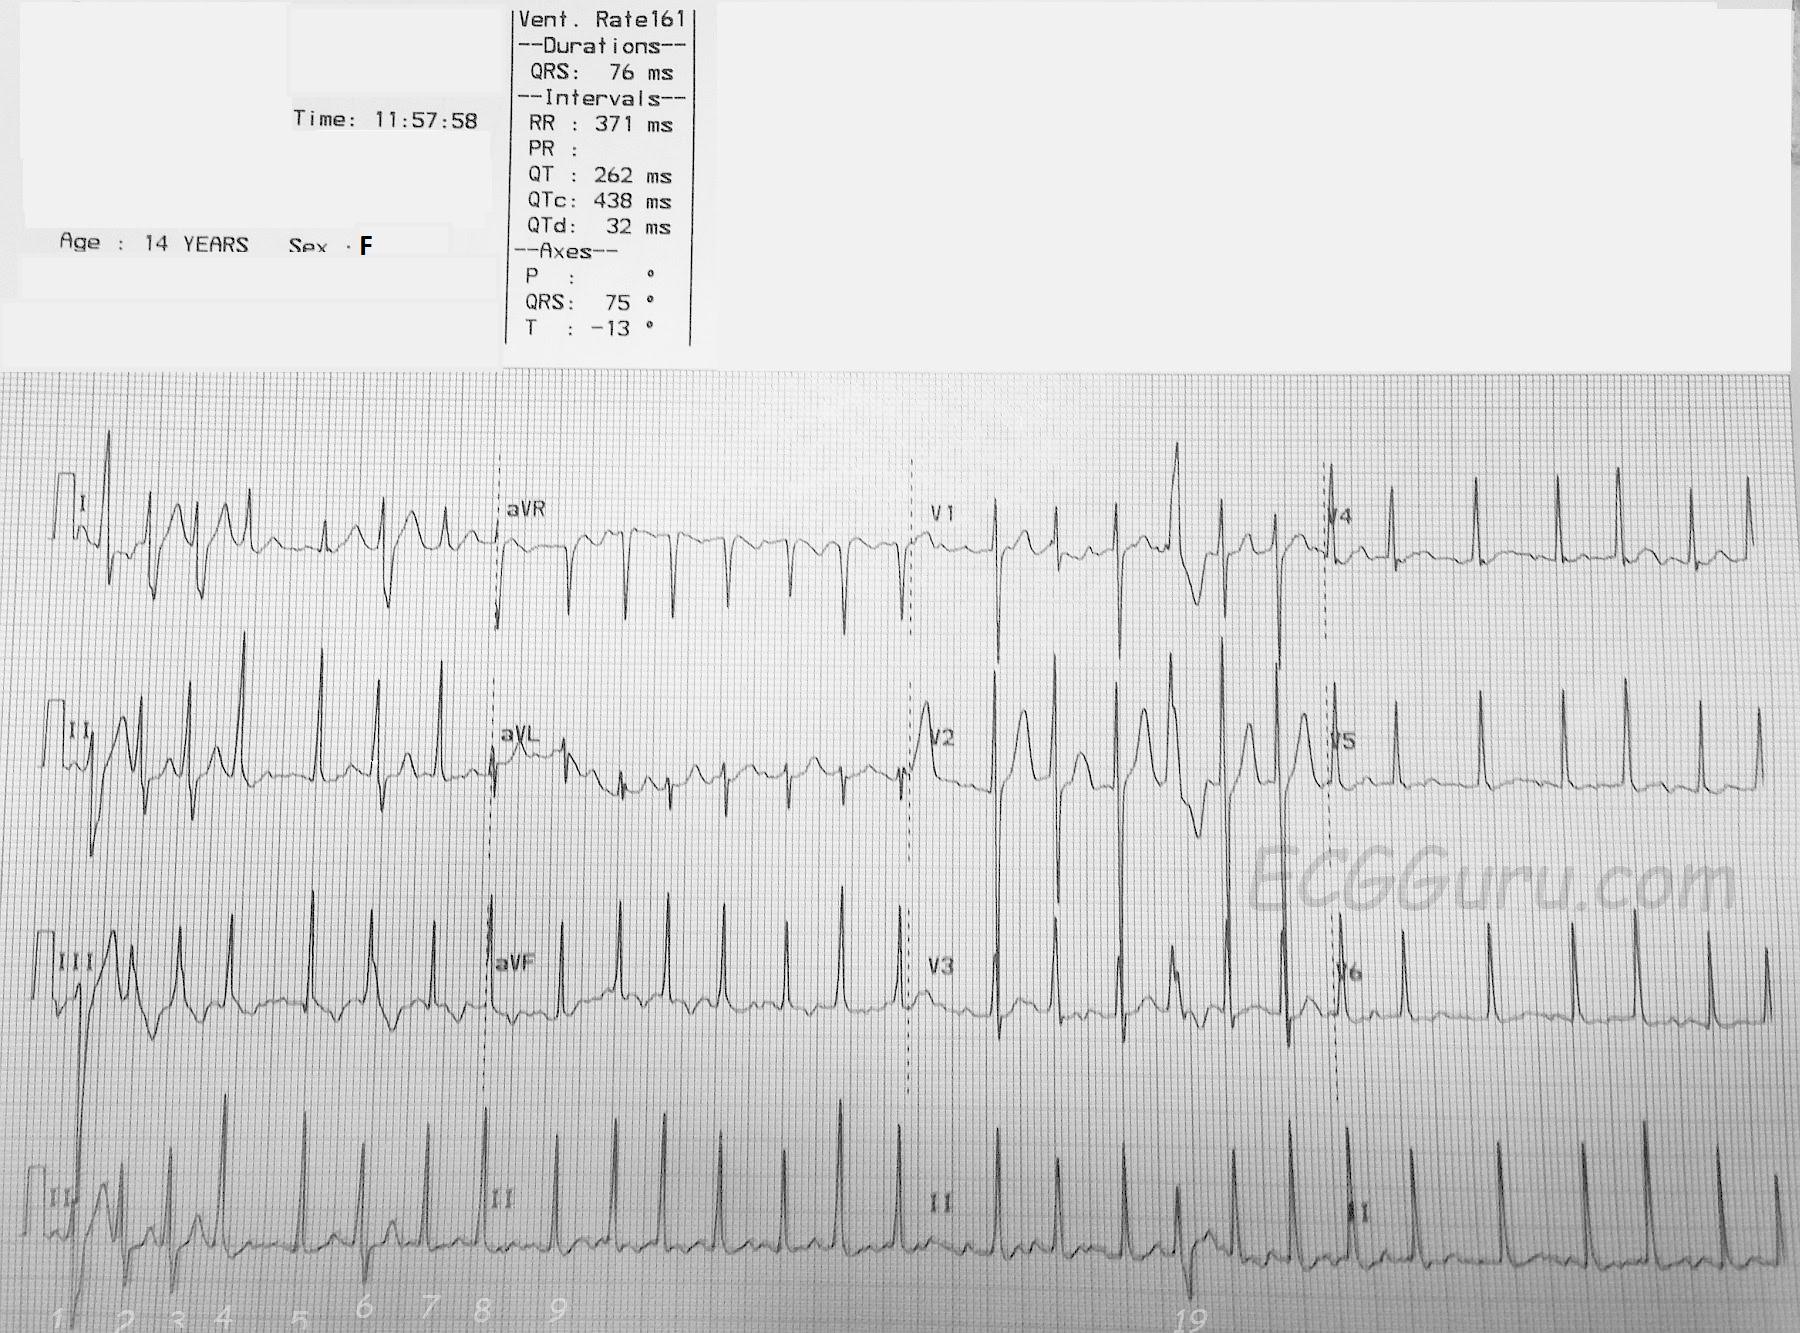
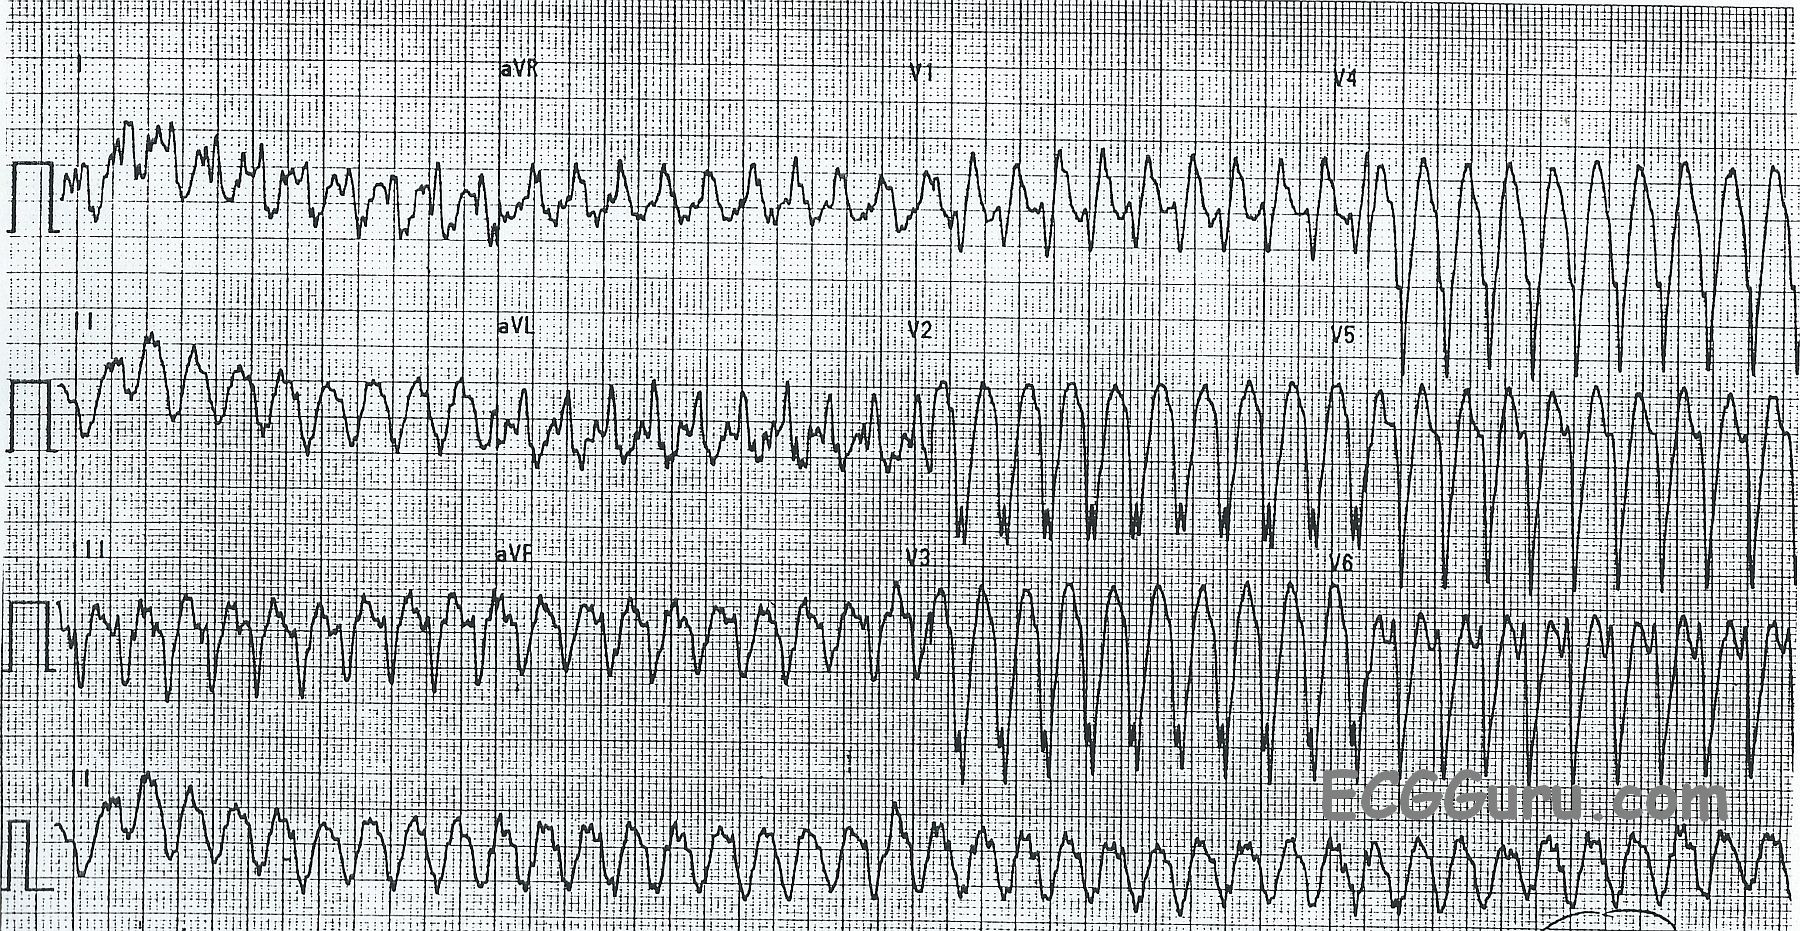
This ECG is from a man who was experiencing palpitations and light-headedness with near-syncope. On first look, you will see a wide-complex tachycardia (WTC) with a rate around 240 per minute.  It is difficult to assess for the presence of P waves because of the rate and the baseline artifact. 


The differential diagnosis of WCT includes ventricular tachycardia and supraventricular tachycardia with aberrant conduction, or interventricular conduction delay (IVCD). We should ALWAYS consider VENTRICULAR TACHYCARDIA first.  If the patient is an older adult with structural heart disease, WCT almost always proves to be VT. 

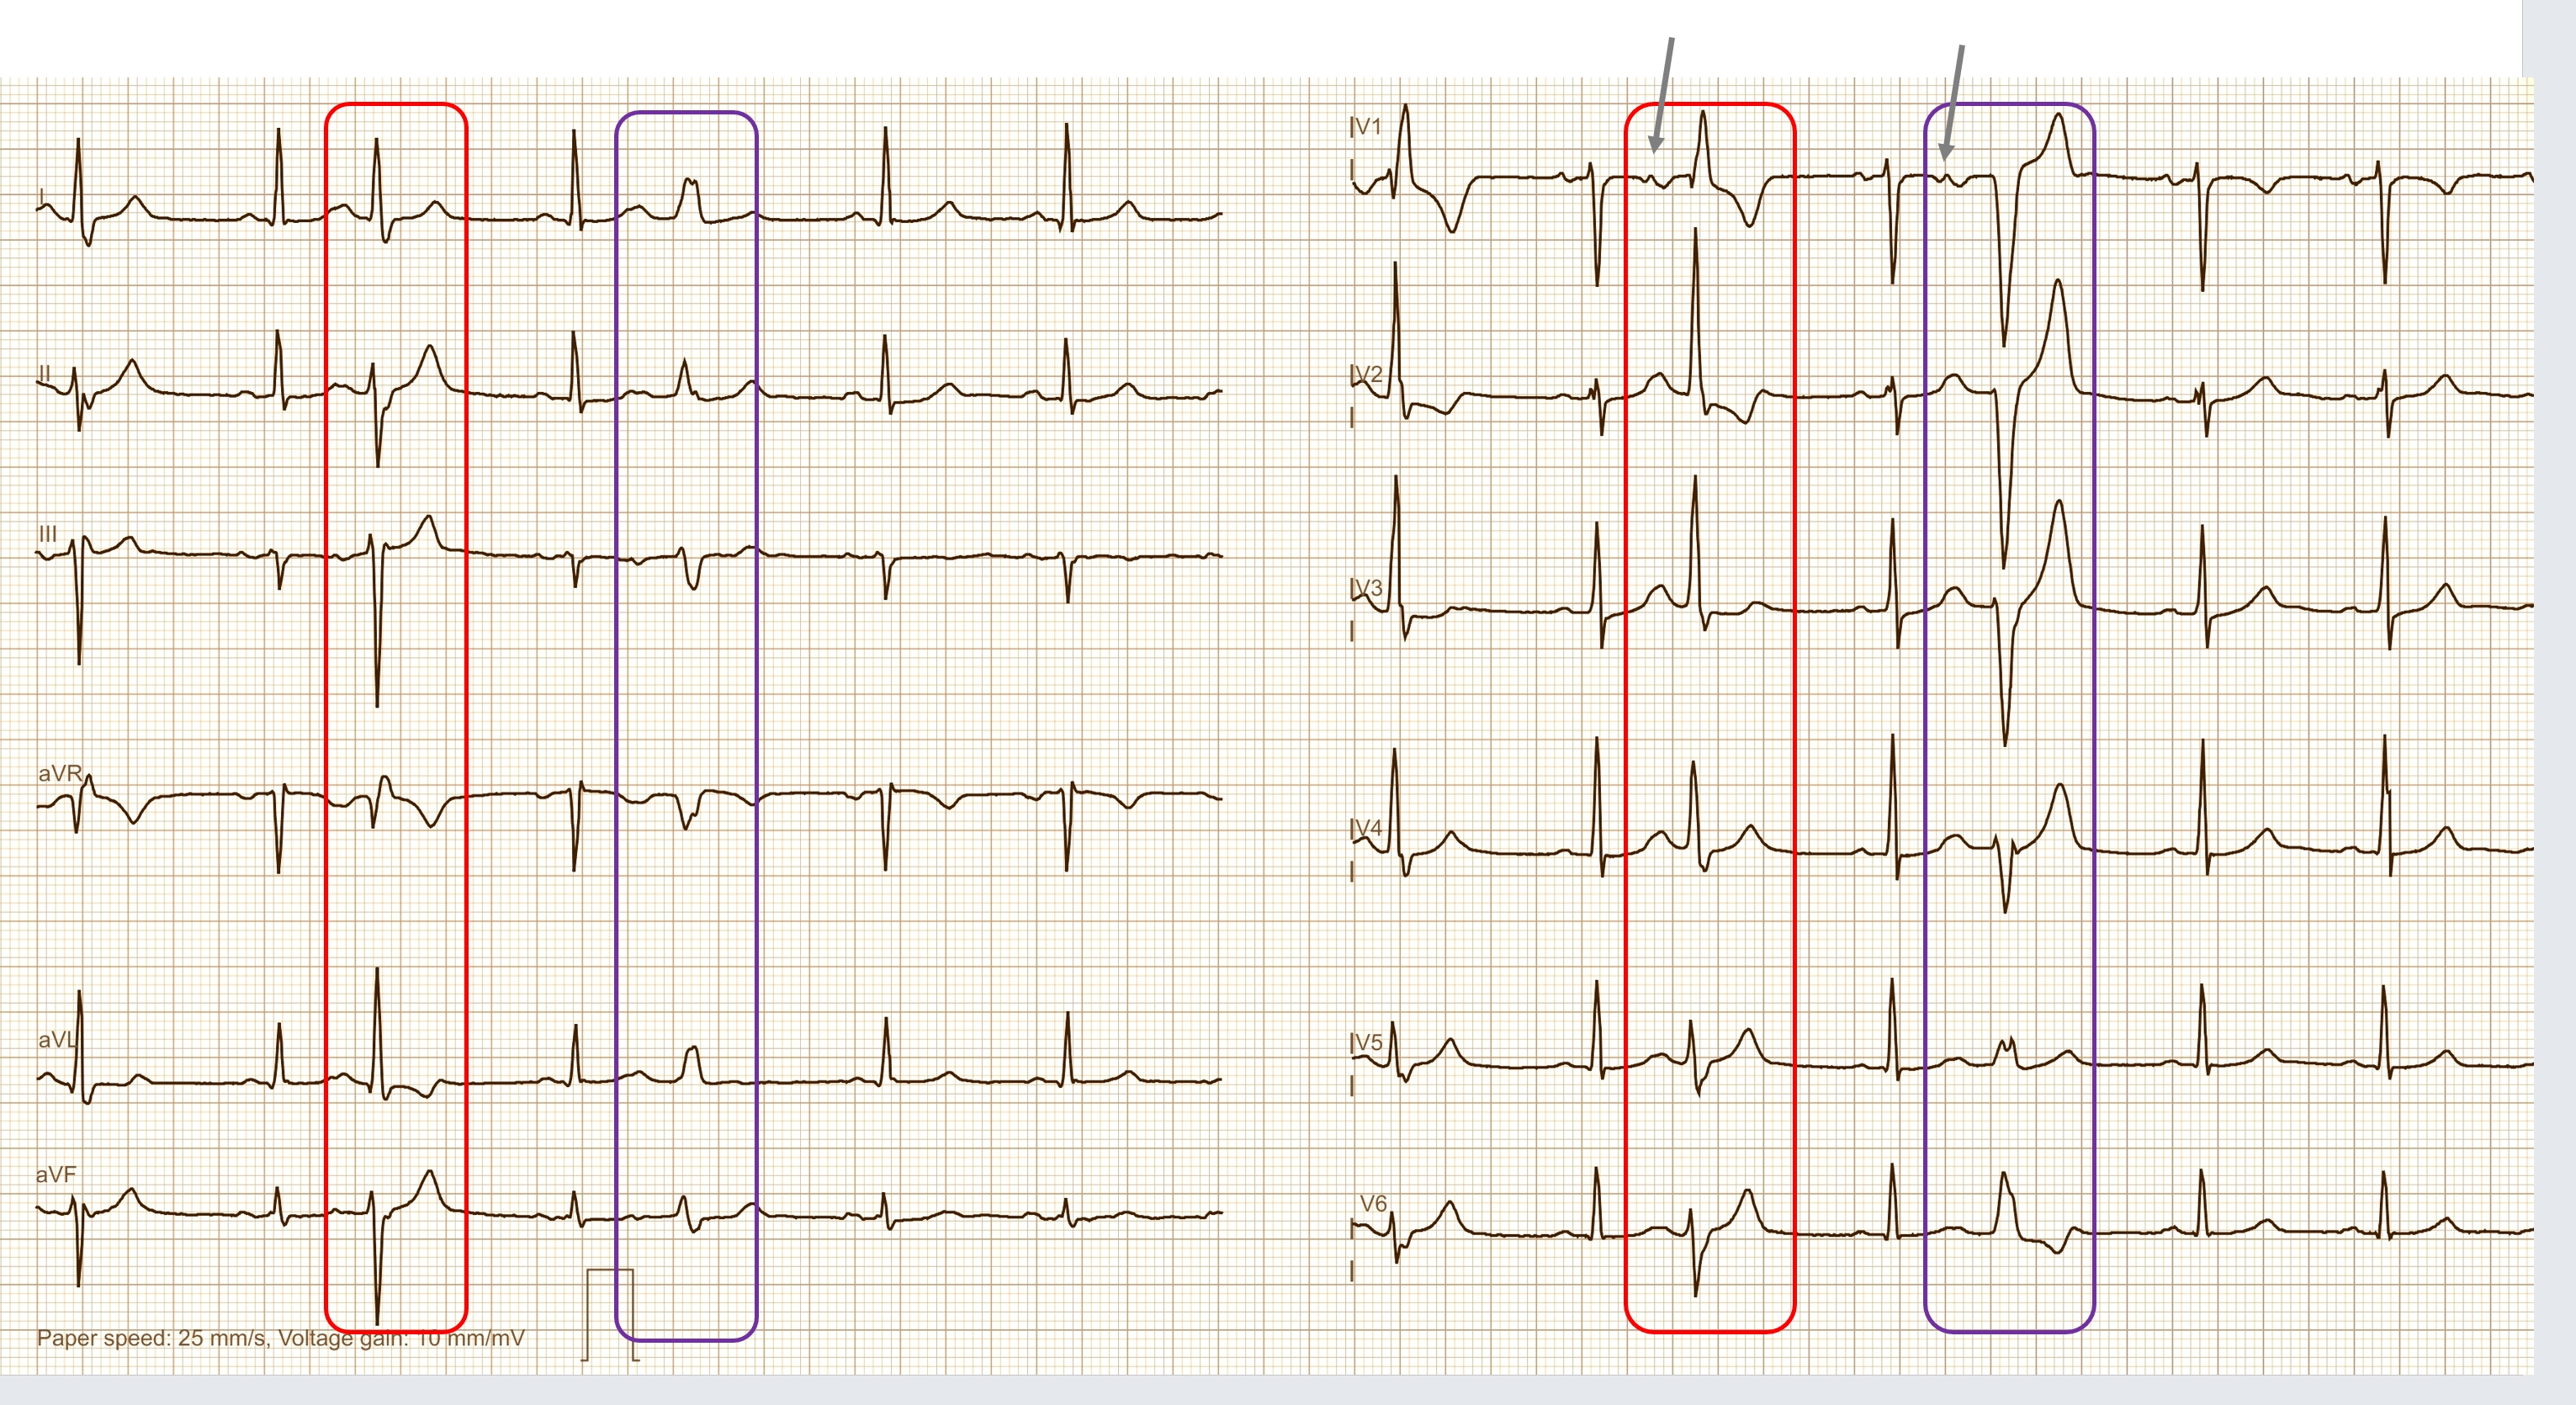
ABERRANT SVT?   In the setting of SVT with wide QRS, the most common aberrancy is right or left bundle branch block.  This ECG could be said to have a “RBBB” type pattern in V1, rSR’ and in Lead I and V6 with a wide S wave.  However, the other precordial leads do not have a RBBB pattern. 

VENTRICULAR TACHYCARDIA? There are some features of this ECG that favor the diagnosis of VENTRICULAR TACHYCARDIA (VT).  They include, but are not limited to:

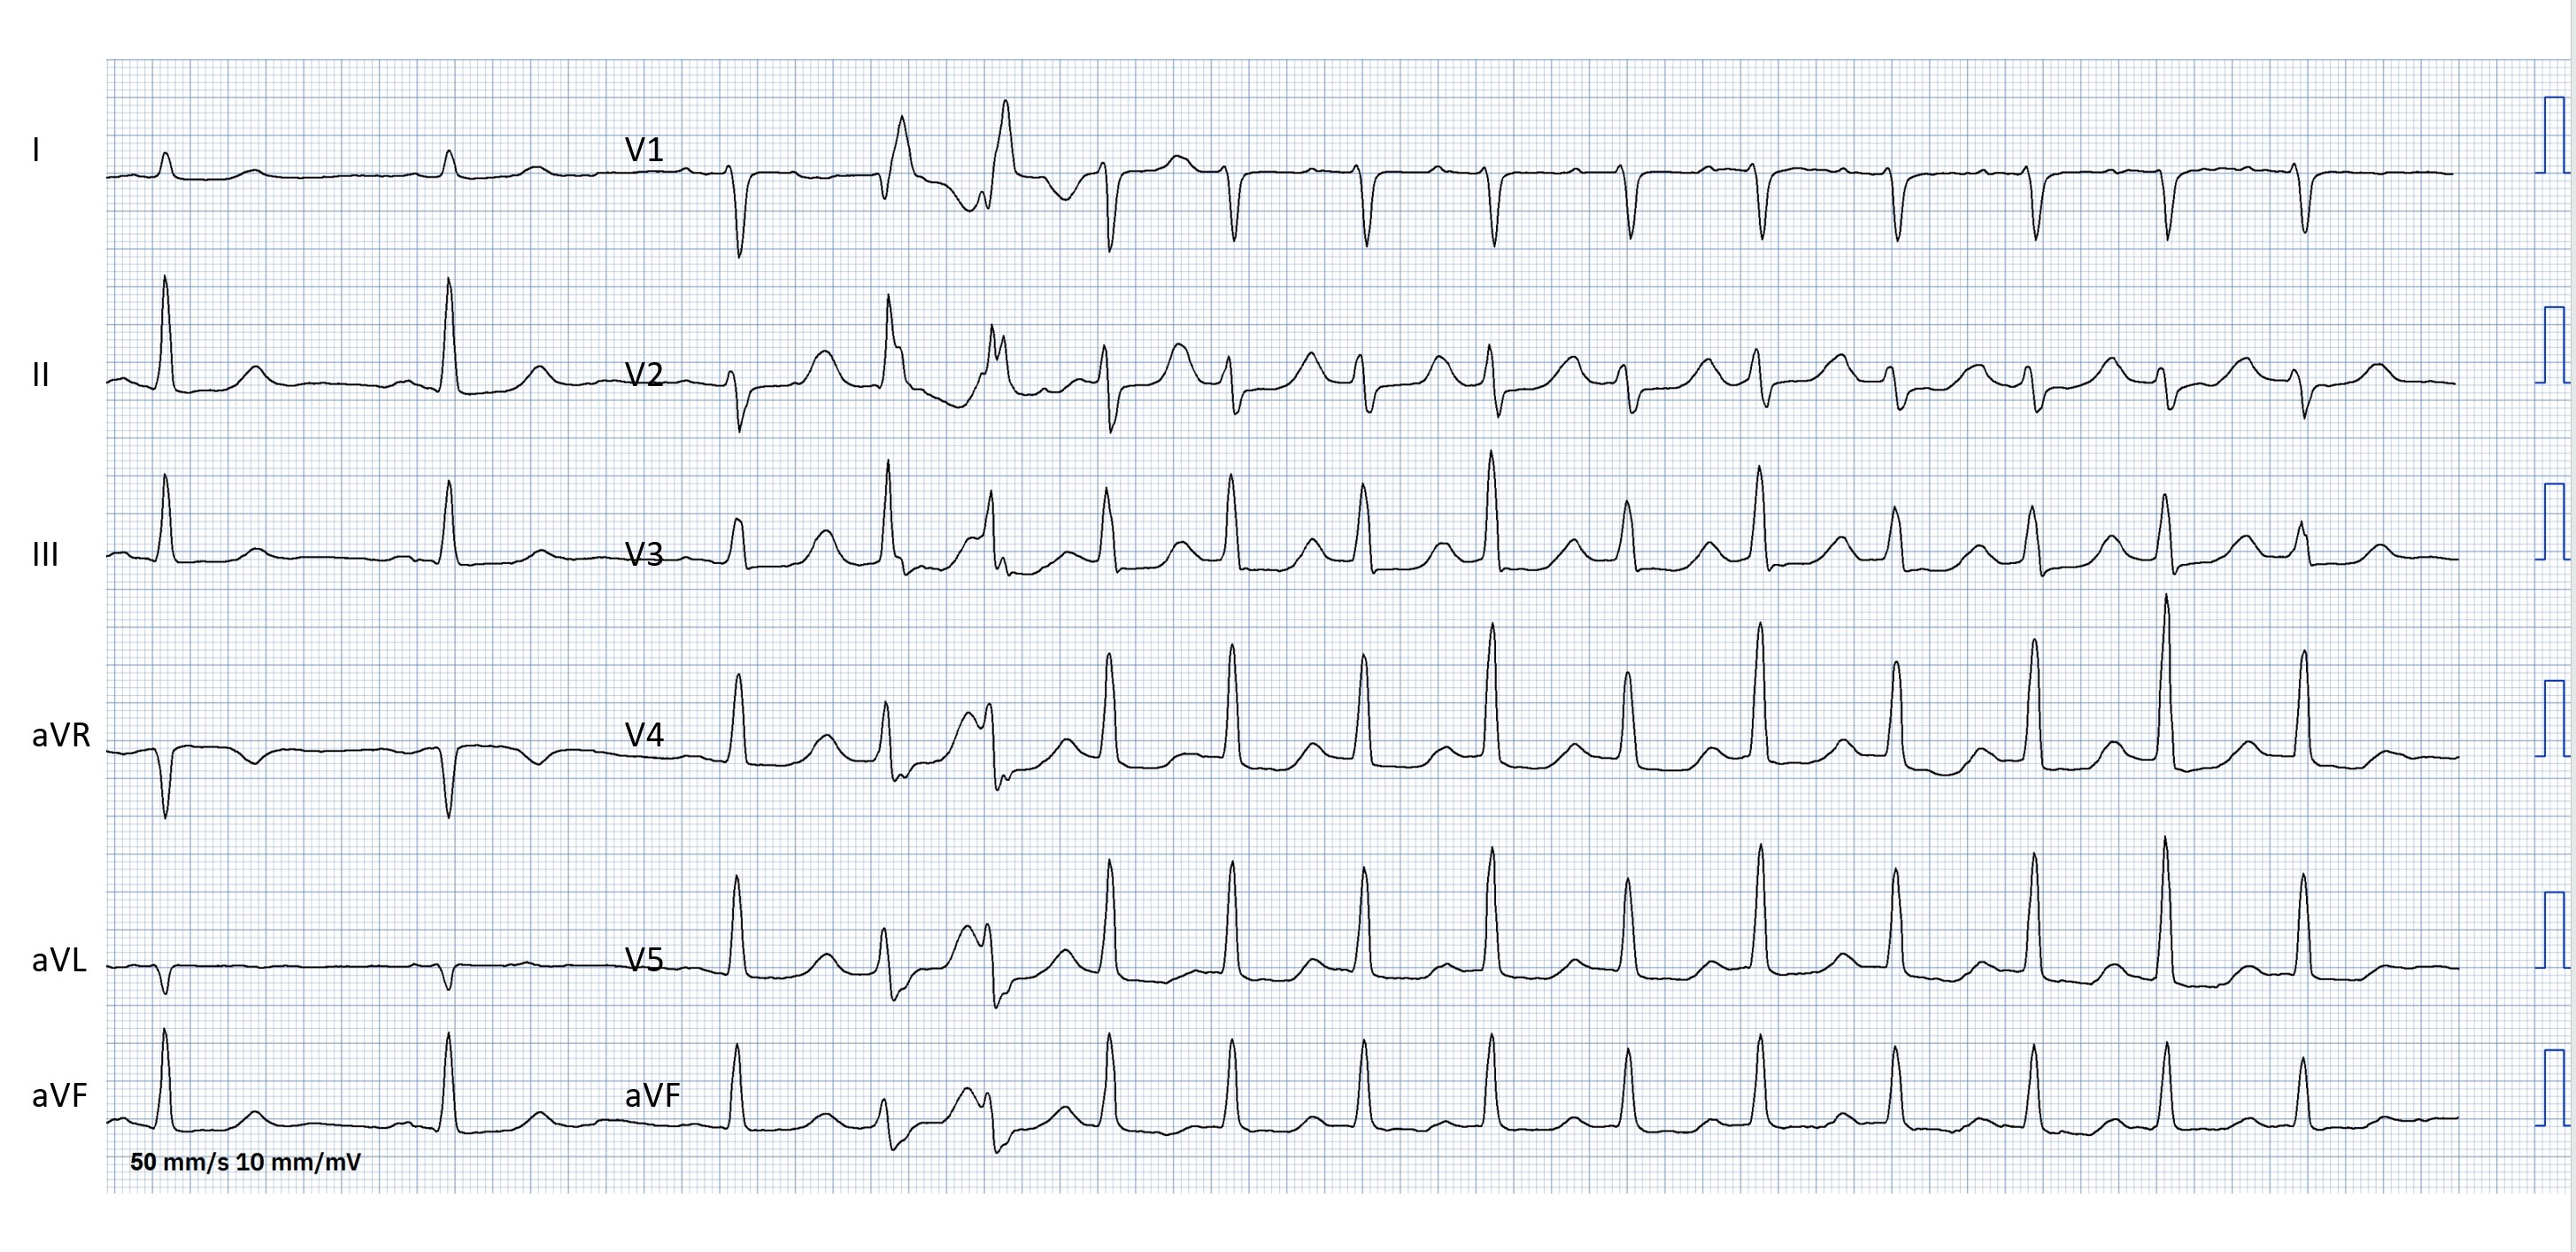
* Regular, wide QRS complexes, about .14 seconds in this ECG, but varies because of difficulty in measuring the beginning and end of the QRS in each lead.  The artifact obscures the exact points of beginning and ending. The QRS complexes, especially from V2 leftward, are very “ugly”, and don’t resemble patterns we would expect with bundle branch block.

* Horizontal plane axis extremely abnormal:  Leads II, III, and aVF are negative and aVR and aVL are positive.  The biphasic Lead I indicates a nearly vertical axis at around – 90 degrees.

* There is “almost” precordial concordance, but V1 is biphasic. 

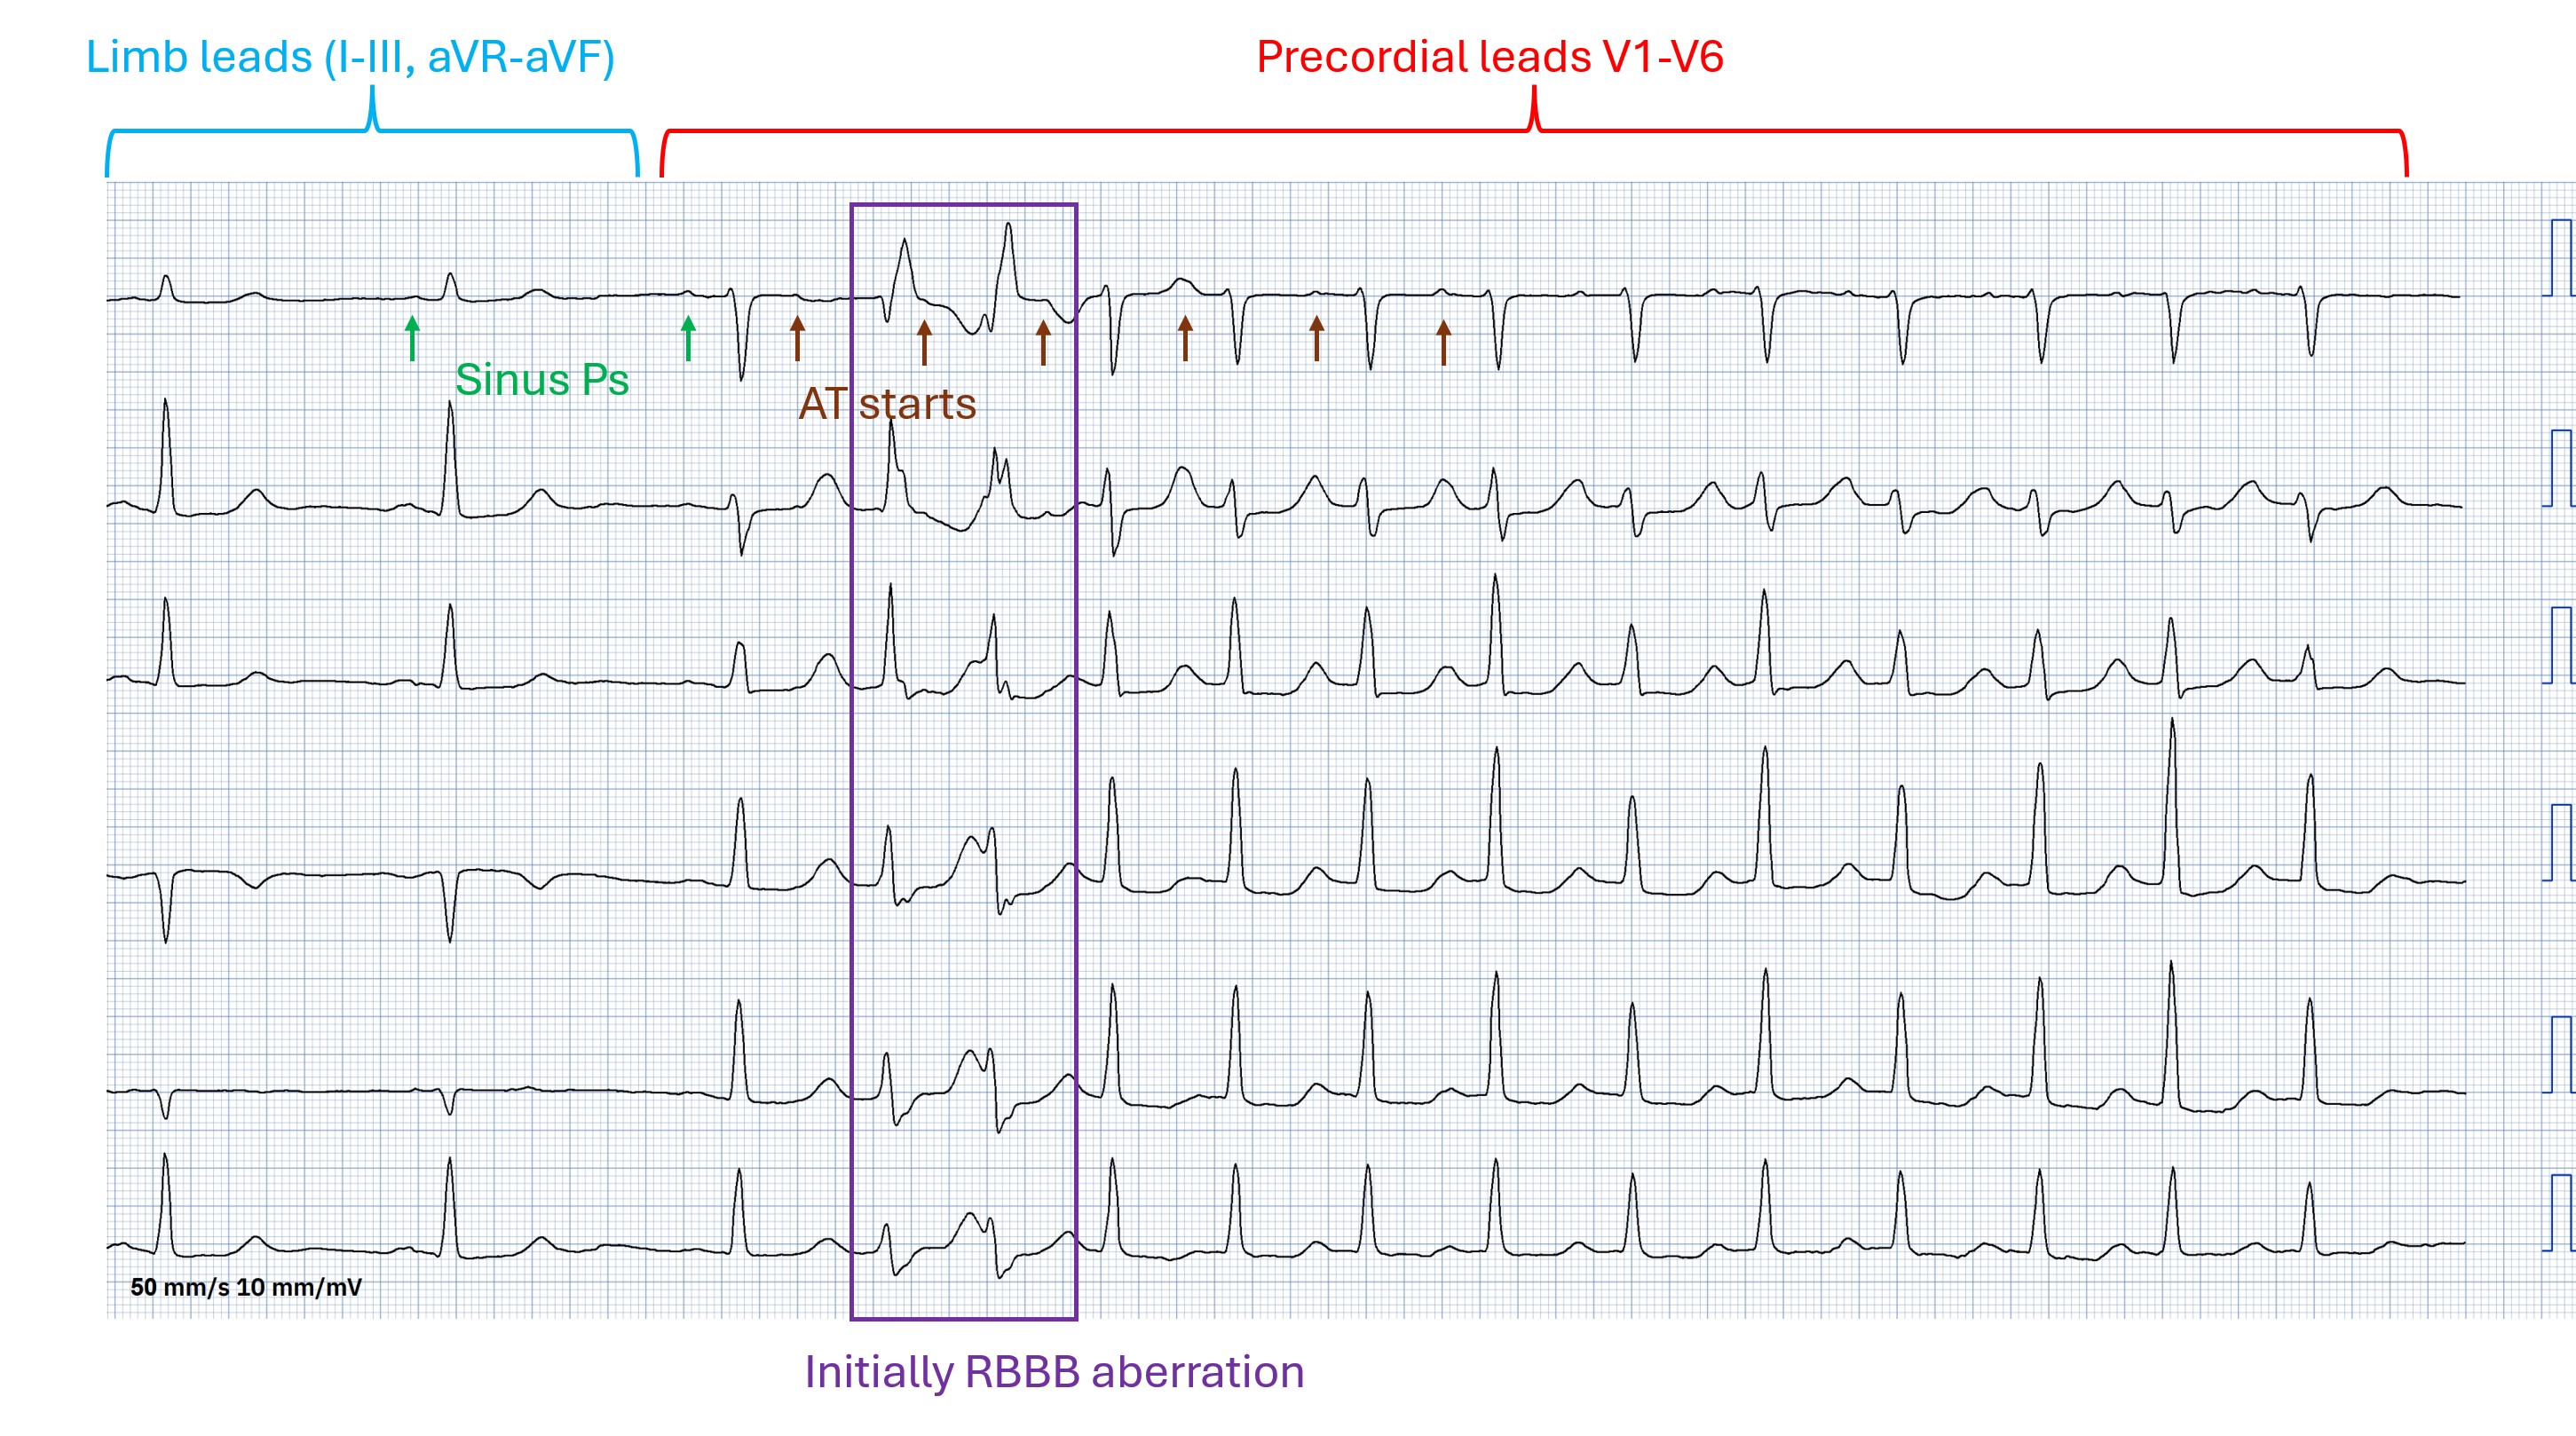
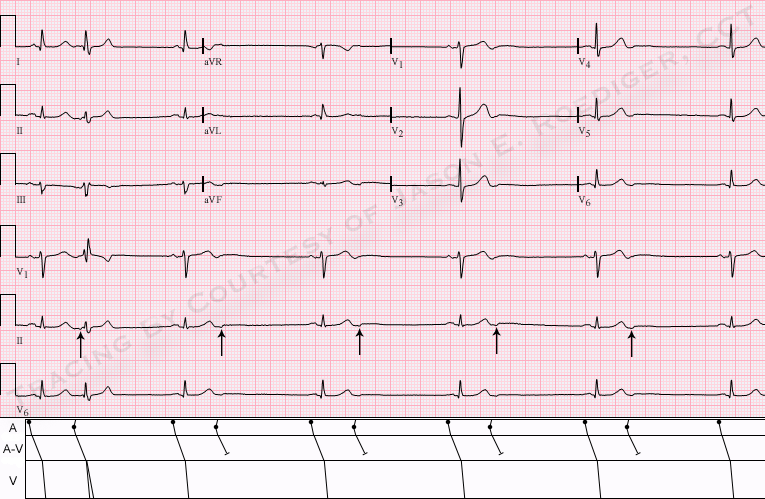
Unfortunately, we do not see capture beats or fusion beats, which would secure the diagnosis of VT. Disassociated P waves would also be a sure sign of VT, but the artifact in this ECG makes it impossible to say whether there are P waves. 

Dawn's picture

Bigeminal Rhythm With Aberrant Conduction

This ECG is a good example of sinus rhythm with aberrantly-conducted PACs.  The tracing was donated to the ECG Guru several years ago by Dr. Ahmed from Sanjiban Hospital in India.  We have no patient data for this tracing. 

The underlying rhythm here is normal sinus rhythm. Most of the parameters – rate, PR interval, and QRS duration – are normal.  The QTc interval, which is the QT interval corrected to a rate of 60 bpm, is prolonged at 568 ms.  We do not know the patient’s clinical condition or medications, so we cannot guess at the reason.  However, a prolonged QTc is associated with an increased risk of Torsades de pointes, a type of polymorphic ventricular tachycardia. 

The first three beats appear the same (Leads I, II, and III).  However, the first R-to-R interval is shorter than the second one.  This could be due to rate variation, a concealed sinus block, or a premature atrial contraction (PAC).   The P wave of the “early” beat, marked #1, looks slightly different from the other P waves in Lead II, but, because of the slow rate, there is no way to be sure without a longer rhythm strip.  After the possible PAC, the rhythm becomes coupled, probably atrial bigeminy, where every other beat is a PAC.  There are several mechanisms that cause grouped beating, but atrial ectopic bigeminy is the most common. Normally, PACs have different-looking P waves compared to the sinus beats.  In this ECG, the P waves are often buried in the preceding T waves, and are hard to evaluate. 

Dawn's picture

Anterior-Septal M.I. With Atrial Fibrillation

This is an interesting teaching ECG on many levels.  It is obtained from a man with chest pain. No other history or follow up is available. 

Acute M.I.     Most striking is probably the clearly-seen anterior-septal wall M.I.  There is ST segment elevation in Leads V1, V2, and V3, with ST depression in the low-lateral leads, V5 and V6.  There is also ST depression in the inferior Leads II, III, and aVF.  The ST elevations have a coved-upward (frown) shape in V1 and a straight shape in V2 and V3.  Both of these ST shapes are abnormal and reflect injury.  The depressions are presumed to be due to reciprocal changes, since there is no other ST-depression producing condition apparent.  There are abnormal Q waves in V1, which could herald the onset of pathological Q waves, a sign of necrosis, in the anterior-septal wall. 

Dawn's picture

ECG Basics: Atrial Flutter With 2:1 Conduction And An Aberrantly-conducted Beat

This strip was taken from a patient at rest.  It shows a regular tachycardia with a slightly-widened QRS complex at about .10 seconds duration.  It is somewhat difficult to evaluate the baseline for P waves or flutter waves.  We ALWAYS recommend multi-lead assessment for such evaluation.  The P waves (or flutter waves) here have a sharp point, and can be easily "marched out", with a rate of about 300 per minute.

Whenever the ventricular rate is near 150/min., we should always consider the possibility of atrial flutter with 2:1 conduction.  Since atrial flutter results in atrial depolarization at around 250 - 350 per minute, conducting every other P wave results in a rate of about 150.  It can masquerade as sinus tach, but a patient with sinus tach at such a fast rate would probably have an obvious cause for a rapid heart rate, such as hypovolemia, drug overdose, or exertion.  This rhythm could also be mistaken for atrial tachycardia or other forms of supraventricular tachycardia (SVT, PSVT, AVNRT, etc.).   Multiple leads can more easily uncover the flutter waves running continuously "behind" and "through" the QRS complexes.

There is one beat that is obviously different from the others.  This beat is about the same width as the other QRS complexes, but is opposite in direction.  This probably represents aberrant conduction, possibly a hemiblock that occurs only in this beat.  Careful measurement will show that this QRS is very slightly early, while the others are all very regular. The slight width of all the QRS complexes suggests that there is a conduction delay, which cannot be diagnosed on one strip with no patient history available.

There are other differential diagnoses, such as ventricular tachycardia with a captured sinus beat.  We welcome discussion of this interesting strip. 

jer5150's picture

Jason's Blog: ECG Challenge for the month of August, 2013.

Patient of unknown age and gender with a history of atrial fibrillation.  What's your interpretation?

Dawn's picture

Spontaneously Changing Conduction In Wide Complex Tachycardia

This ECG was donated to the ECG Guru by Dr. Arnel Carmona, one of our favorite Gurus.  You will not often see such a great example of this.  We are very grateful to Dr. Carmona for his contribution to learning. Dr. Carmona's new blog is EZG - ECG for beginners and enthusiasts.    

An adult patient was admitted due to palpitations.  What is this rhythm?This is a tachyarrhythmia that initially is regular wide complex (RBB morphology) and later became regular narrow complex at a rate of about 187 bpm. There is normalization of the QRS without a change in heart rate. In the latter part of the tracing (narrow complex), pseudo-r can be seen in V1. So, this is SVT with aberrancy with spontaneous normalization.

What is the cause of the intraventricular aberration during acceleration of heart rate? It could be due to failure of the refractory period to shorten or possible lengthening in response to acceleration. 

What is the cause of the normalization of the of the QRS? The normalization of intraventricular conduction could be due to the gradual shortening of bundle branch refractory period in response to the tachycardia. 

Dawn's picture

Normal Sinus Rhythm With Aberrantly-Conducted PACs

This is a normal 12-Lead ECG with two PACs that are aberrantly conducted in a right bundle branch block pattern. (Sixth and ninth beats). In the PACs, the QRS is slightly wider than the normal beats.  The aberrantly-conducted beats have an rsR' pattern in V1, and a wide little S wave in aVL. No PACs are seen in Lead I to demonstrate the wide S wave.  This represents a right bundle branch block pattern, which is a common form of aberrancy, and is rate-related.  That is, the PAC occurs early in the cycle, catching the right bundle branch is a refractory state and unable to depolarize.  Slower beats are easily acommodated by the right bundle branch.

Dawn's picture

PACs With Left Anterior Fascicular Block Aberrancy

A good example of aberrantly conducted premature beats (PACs or possibly PJCs) that are conducted with a left anterior fascicular block.  The underlying rhythm is sinus at about 80/min.  The timing of the premature beats is best seen in the Lead II rhythm strip at the bottom, as this ECG machine does not print the 12 leads in an uninterrupted manner.  You will see interruptions each time the leads change.

The first beat on the ECG is one of the premature beats.  You can observe the left axis deviation without pathological Q waves.  Lead I shows the premature beats with an Rs pattern, and Leads II and III have rS.  The early beats have caught the anterior fascicle of the left bundle branch refractory from the preceding beat.  It recovers for the normally-timed sinus beats.

Pages

All our content is FREE & COPYRIGHT FREE for non-commercial use

Please be courteous and leave any watermark or author attribution on content you reproduce.