This ECG is from a 59-year-old man who was a patient in the Emergency Department with mild chest pain. He had a history of coronary artery disease. We have no other information about his medical history, medications, or outcome.
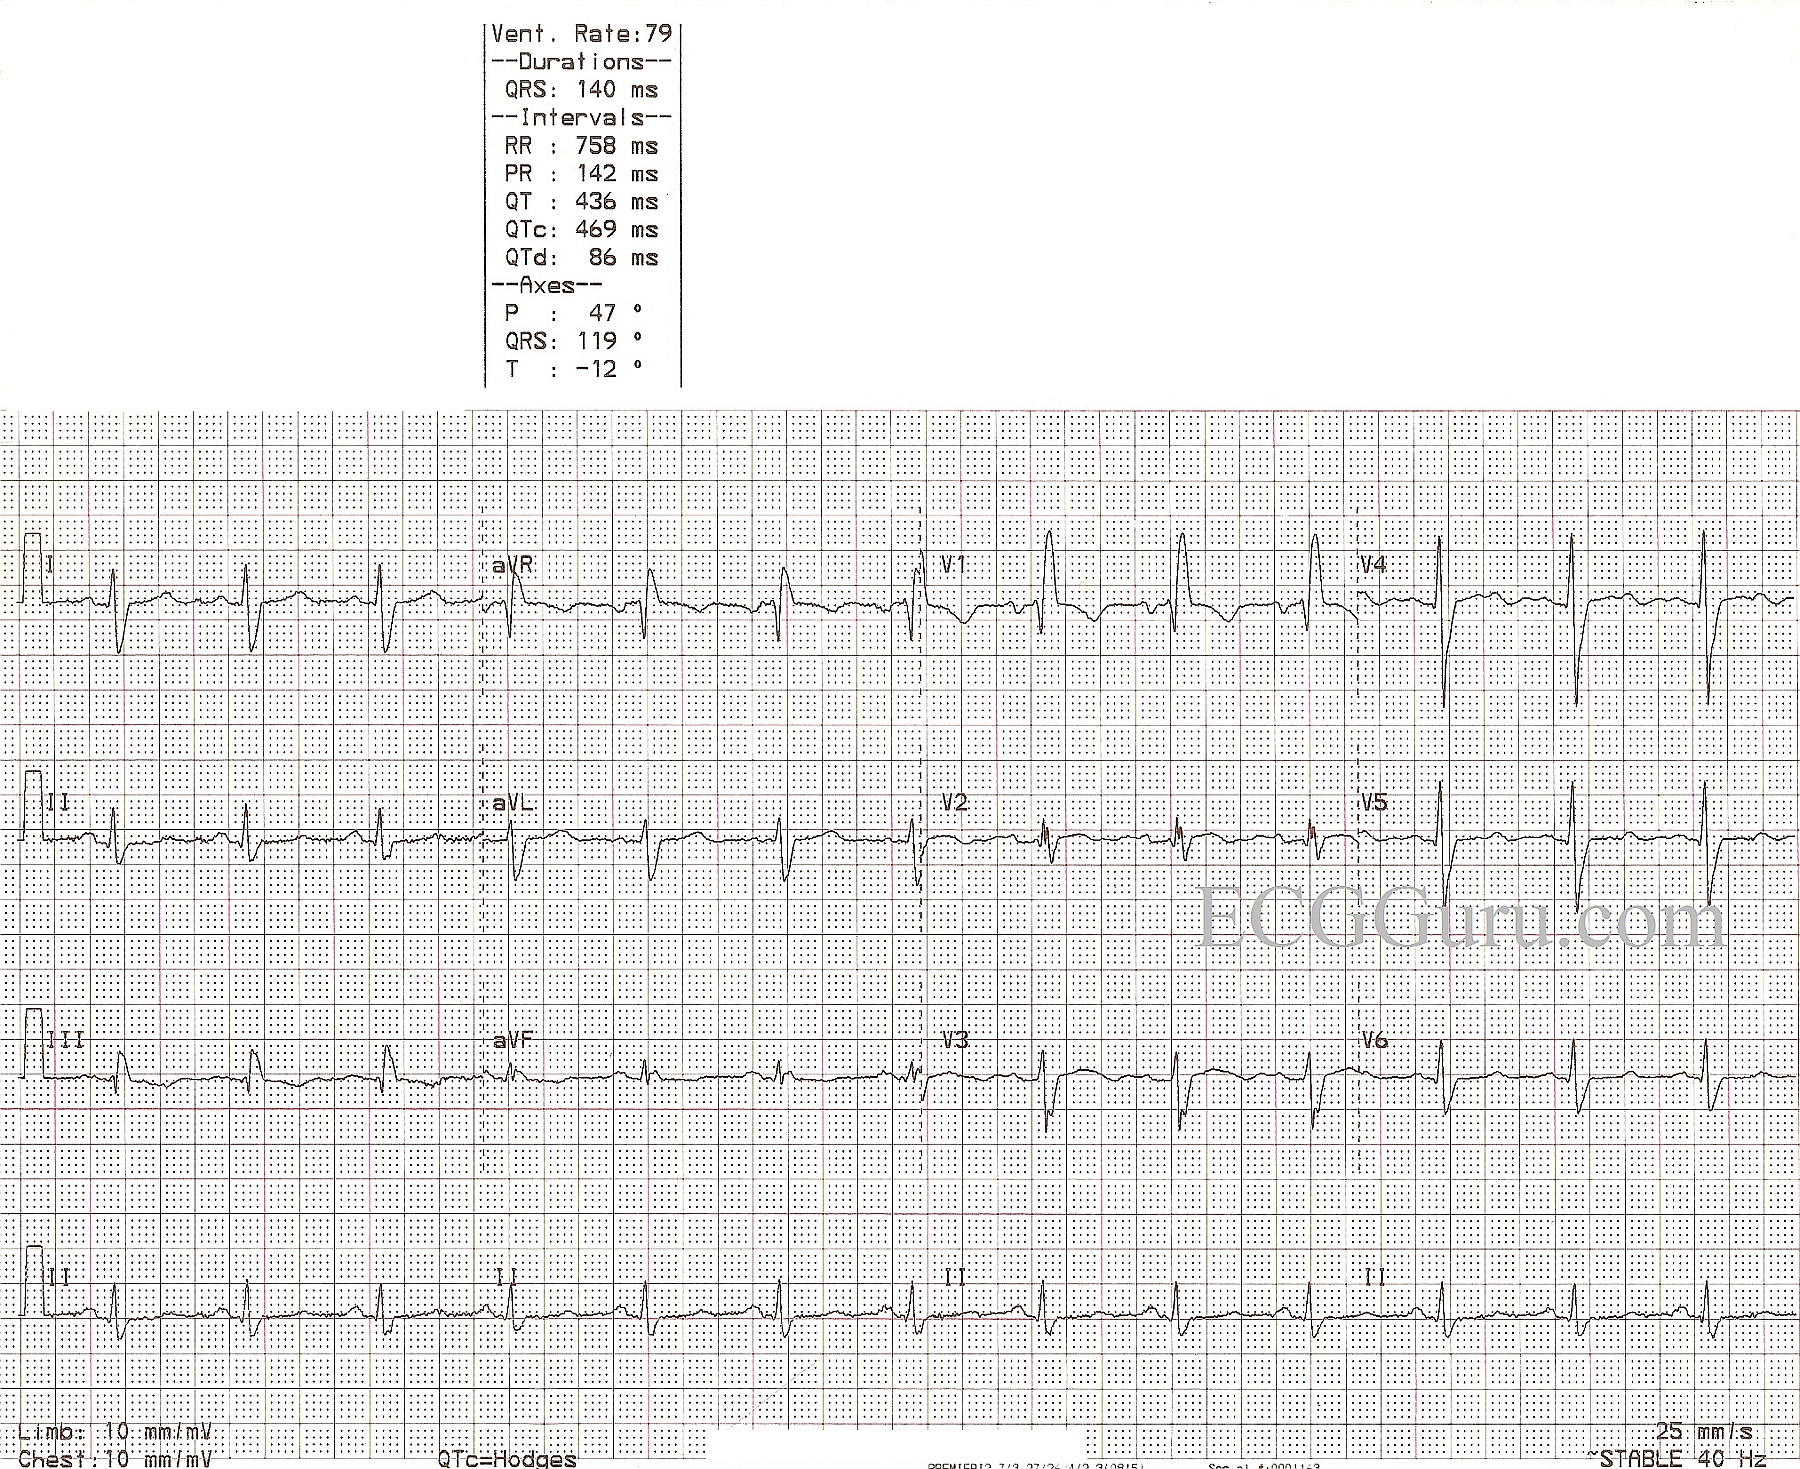
The ECG shows normal sinus rhythm and right bundle branch block. The ECG criteria for right bundle branch block are: 1) QRS wide at 120 ms or more (.12 sec. or more). 2) Supraventricular rhythm. 3) Terminal waves indicating that the right ventricle is depolarizing late. Because the right bundle branch is blocked, the left ventricle depolarizes first. The QRS begins in a normal fashion. The depolarization wave cannot access the right ventricle via the bundle branch, so it travels cell-to-cell across the right ventricle, causing a conduction delay. This delay in depolarizing the right ventricle is seen on the ECG as a separate, terminal wave on the QRS. In V1, it is seen as an R' wave, making the QRS have an rSR' pattern in most cases. In Leads I and V6, there will be a wide, slurred S wave, causing an Rs pattern. The frontal plane axis can be difficult to determine, as the first part of the QRS is from the left ventricle and the second part is from the right ventricle.
The causes of right bundle branch block are many. The website, Life In the Fastlane has a good quick reference.
This patient has a slightly prolonged QTc interval at 469 ms, for which we do not know the reason, lacking clinical information. The QT interval measures the total time it takes to depolarize and repolarize the myocardium, and it is measured from the beginning of the QRS to the end of the T wave. The QT interval lengthens naturally in slow rates, and shortens with faster rates. The QTc has been mathematically corrected to a rate of 60/min. A good rule of thumb is the QT interval should be less than half the RR interval of the preceding beat. A long QT interval (>500 ms) has been associated with increased risk of torsades de pointes.