Displaying 1 - 5 of 5
Dawn's picture

Marked Bradycardia With Bifascicular Block

The Patient:    This ECG was taken from an elderly woman. Unfortunately, we do not know any details about the case.  That acknowledged, there are many interesting aspects to this ECG.

The ECG:  The first thing we notice is the severe bradycardia – almost certain to be symptomatic.  The rate is 32 bpm and the rhythm is regular.  There are no P waves.  This is a junctional rhythm, slightly slower than expected from junctional escape.

The QRS shows the presence of right bundle branch block.  Each QRS on the ECG starts as a narrow complex, but then adds an “extra” wave onto the end – the delay caused by the right ventricle depolarizing late.  The terminal delay is very noticeable in V1 as an R’ wave, and in Leads I and V6 as a small, wide s wave.  There is right axis deviation, so the diagnosis of bifascicular block (RBBB and left posterior fascicular block) can be made.

V2 through V6 show fragmentation of the QRS complexes and a loss of voltage and R wave progression.  This points to anterior wall M.I. We can’t know the age of the M.I. without clinical correlation, but the ST segments in those leads are very flat, with uniformly symmetrical inverted T waves all the way to V6.  All of these signs indicate recent injury.  An anterior M.I. can cause the bifascicular block we are seeing, since the bundle branches begin in the septum.

Dawn's picture

Right Bundle Branch Block and More

The Patient:    These tracings are taken from a 75-year-old man who became weak while playing golf on a very hot day.  He was pale and diaphoretic.  He was hypotensive, but we do not know his BP reading. He denies chest pain or discomfort. The patient reported a history of lung cancer and hypertension. We have no other history, and unfortunately, no follow-up information.

ECG Number 1:           The first ECG shows the standard 12 leads.  The rhythm is sinus with frequent appearances of PAC couplets.  The sinus rate varies slightly from about 76 bpm to 68 bpm, tending to slow a bit after the premature atrial contractions.  There is a right bundle branch block, and the QRS duration is about .12 seconds (120 ms). The PR interval is slightly log at 223 ms.  We do not know what medications the patient is on, and we do not have an older ECG for comparison.

There are some interesting, if subtle, changes worth mentioning.  The QRS complexes in most leads are fragmented.  That is, they have notching in the terminal S or R waves that is not due to the bundle branch block. This can be a sign of scarring, and can also be considered an equivalent to a pathological Q wave.  Speaking of pathological Q waves, they are seen in the inferior leads, II, III, and aVF.  There are also prominent, though not large Q waves in V4 through V6, leads which normally do not have them. All this points to scarring and possibly long-term coronary artery disease, with possible old M.I.  In addition, the ST segments are not entirely normal.  There is ST depression in the inferior and low lateral leads, a little ST elevation in aVL.  Also, the SHAPES of the ST segments tend to be straight throughout the ECG, instead of the usual curved (concave up) appearance.

Dawn's picture

Tachycardia In An Unresponsive Patient

 The Patient     This ECG was obtained from a 28-year-old woman who was found in her home, unresponsive.  She was hypotensive at 99/35.  No one was available to provide information about past medical history or the onset of this event.

Before you read my comments, pause to look at the ECG and see what YOU think.  We would welcome comments below from all our members!

The ECG     This ECG is quite challenging, as it illustrates the helpfulness of ECG changes in patient diagnosis, and also points out how important clinical correlation is when the ECG suggests multiple different problems. Forgive me in advance, but there is a lot to say about this ECG.

The heart rate is 148 bpm, and the rhythm is regular, although not perfectly. P waves are not seen, even though the ECG machine gives a P wave axis and PR interval measurement. The rate is fast enough to bury the P waves in the preceding T waves, especially if there is first-degree AV block. Differential dx: sinus tachycardia, PSVT, atrial flutter. The very slight irregularity points more towards sinus tachycardia.  The rate of nearly 150 suggests atrial flutter with 2:1 conduction, but the only lead that looks remotely like it has flutter waves is V2. The lack of an onset or offset of the rhythm makes it difficult to diagnose PSVT with any certainty.

Dawn's picture

Bifascicular Block With First-degree AVB

The Patient  This ECG was obtained from an 80-year-old man with a past medical history of hypertension, diabetes, chronic obstructive pulmonary disease, hyperlipidemia, chronic kidney disease, and heart failure with preserved ejection fraction (HFpEF).


He presented to the hospital with a complaint of shortness of breath, and was determined to have an exacerbation of his COPD in the setting of a viral infection.  He was treated with breathing treatments and steroids, and was discharged home in improved condition.

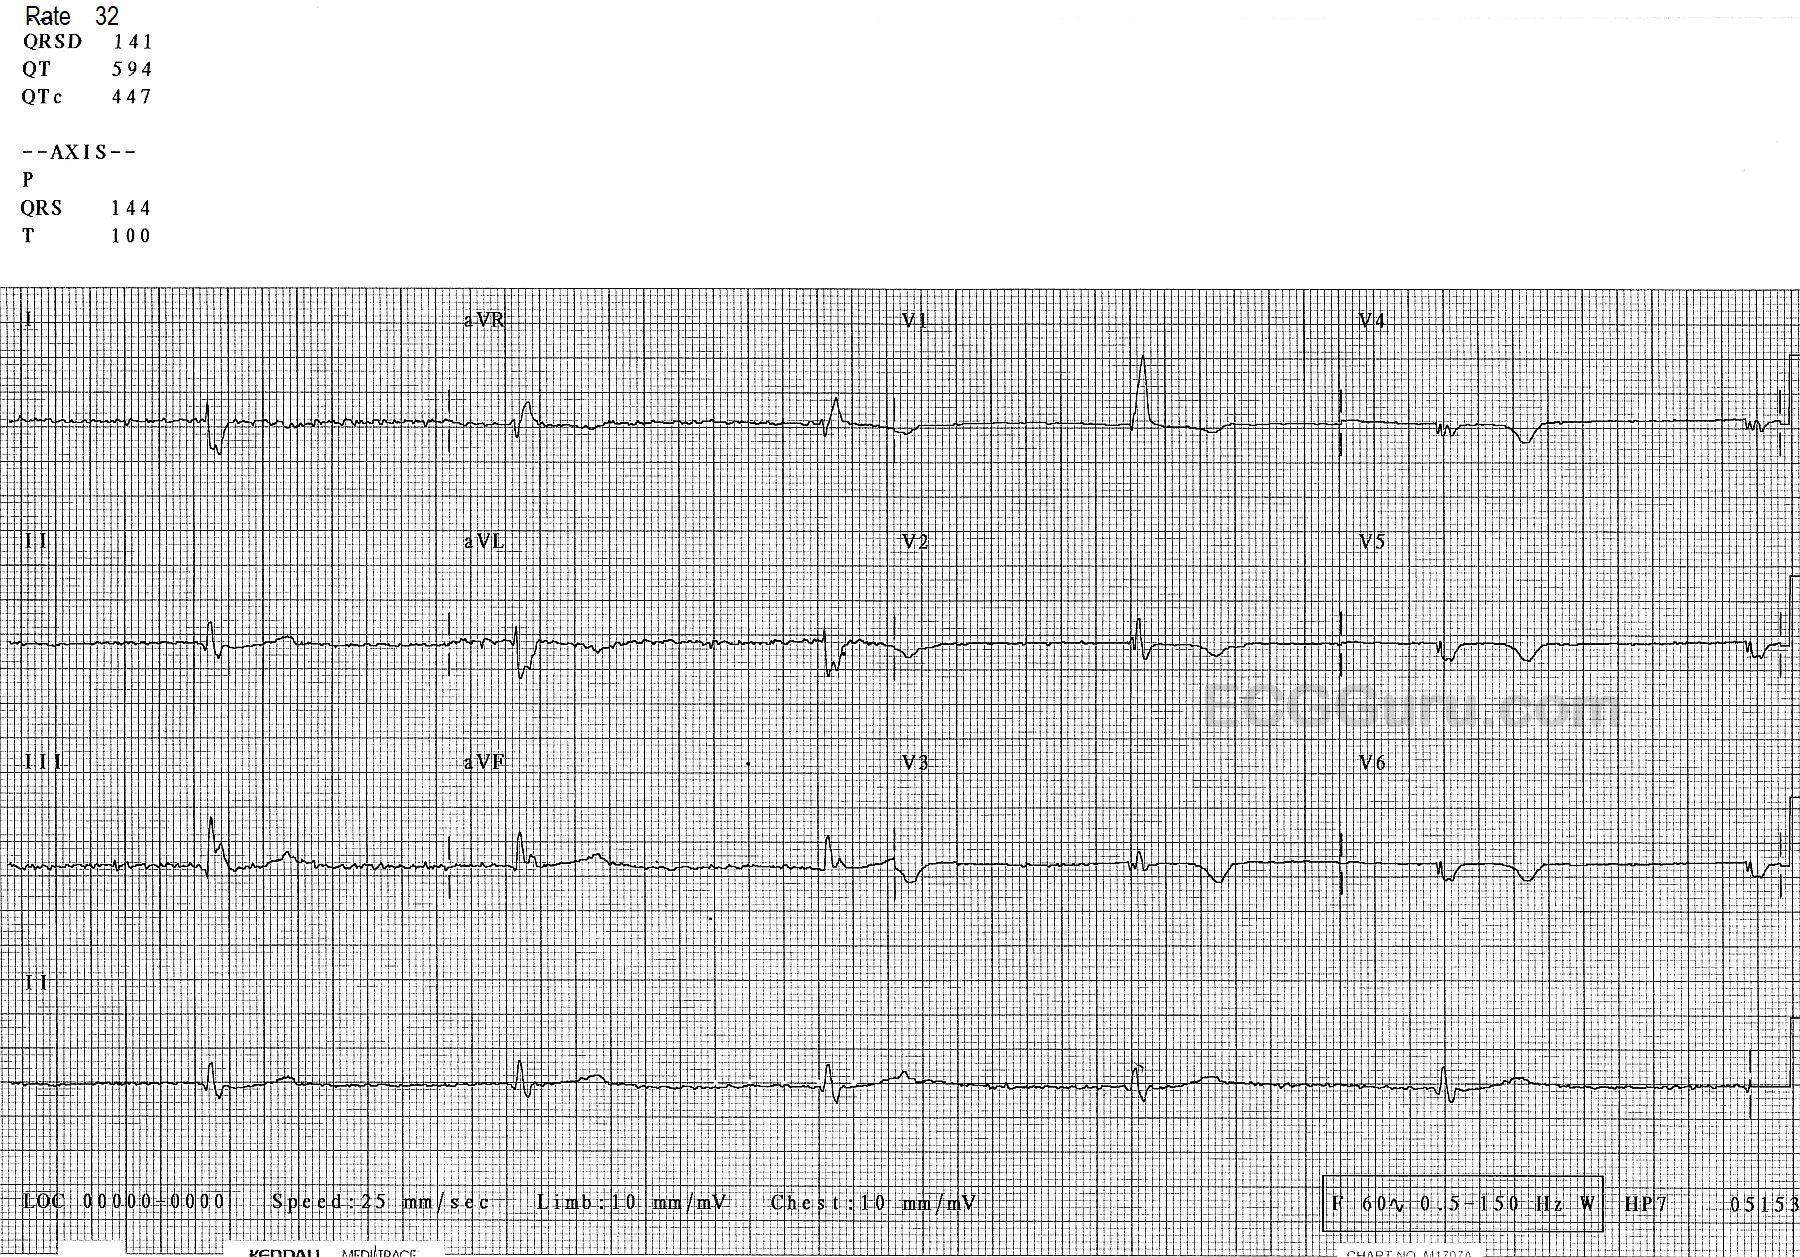
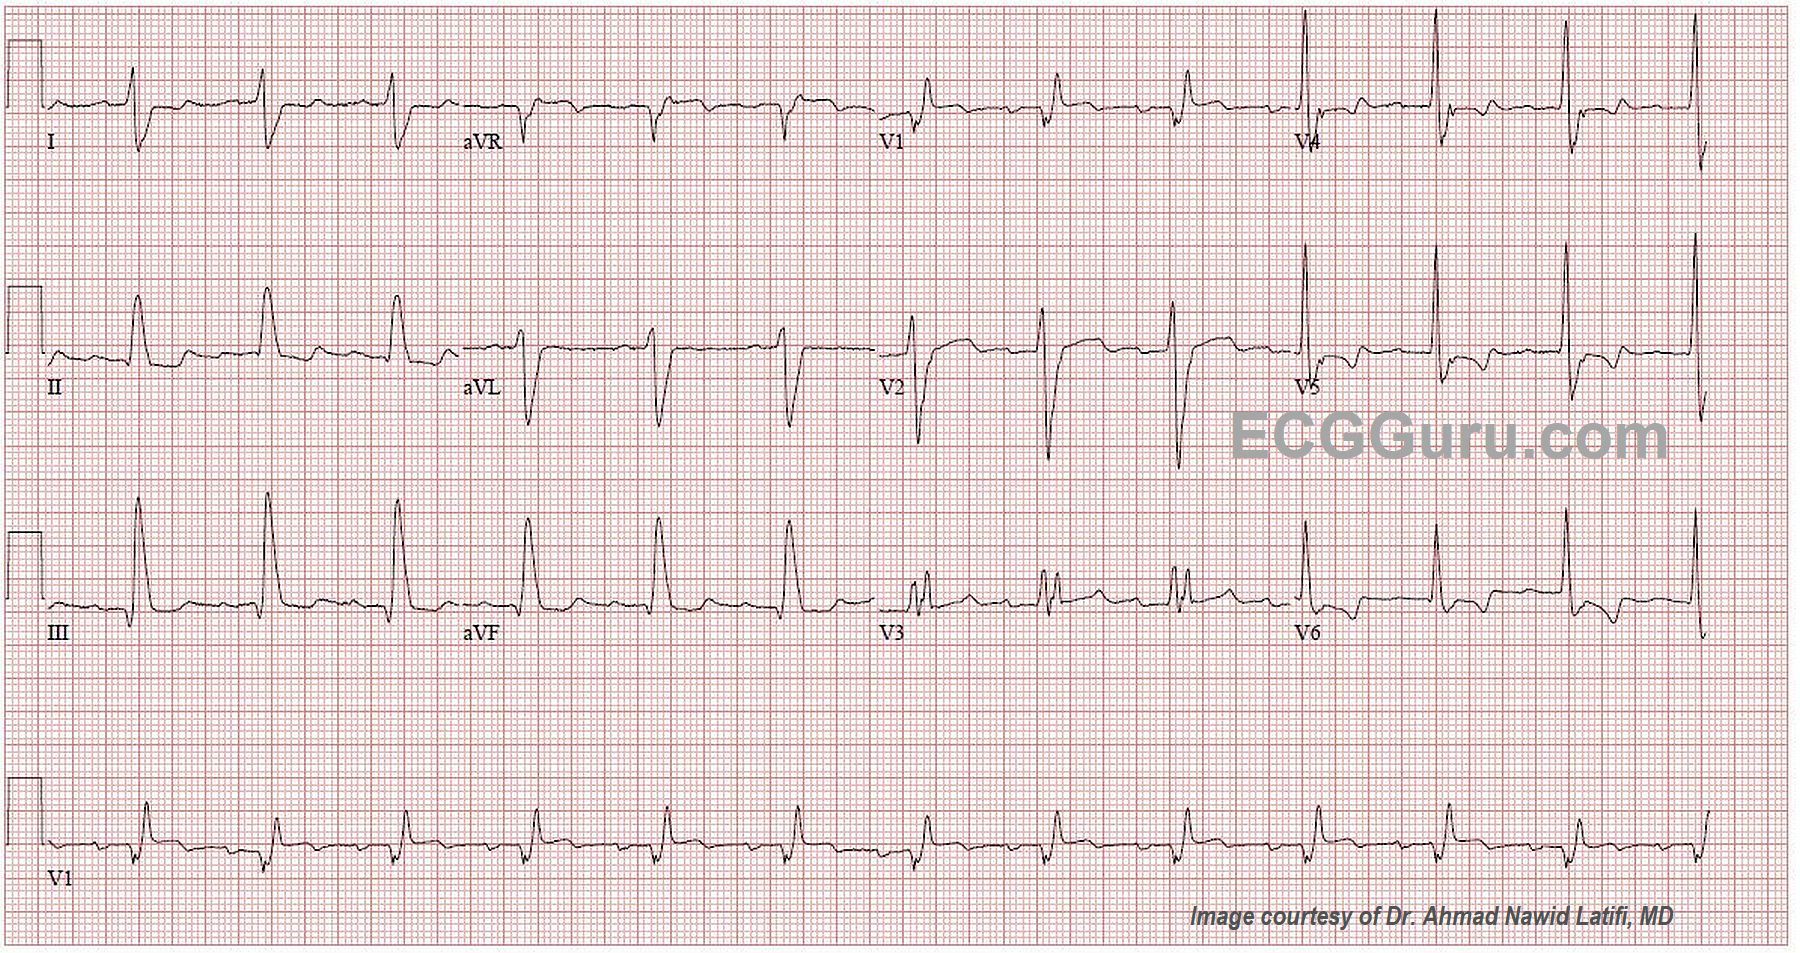
The ECG   There is a sinus rhythm at 80 bpm.  The QRS complex is wide at .18 seconds (180 ms). The PR interval is slightly prolonged at .24 seconds (240 ms), which is first-degree AV block. There is right bundle branch block (QR in V1 and rS in Leads I and V6 with a wide QRS).  There is also a left posterior fascicular block (also called hemiblock), recognized by the right axis deviation (III is taller than aVF ).  This is bi-fascicular block, which can be chronic or acute.  There is very slight ST elevation with flattening in V1 and possibly V2.  In RBBB, “normal” T waves are directed opposite the terminal wave of the QRS.  V3 should, then, have inverted T waves. So, the upright T wave in this patient could be considered to be equivalent to an inversion in a normal ECG.  V4 through V6 have biphasic T waves, which is not normal for RBBB.  Because we do not have an old ECG, we don’t know which, if any, of these changes are chronic.  With this patient’s past medical history, it is possible for any of them to be pre-existing.

I will admit that, when I first saw this ECG, the V1 rhythm strip at the bottom looked as though there were regular P waves at a rate of about 220-240, with one buried in each QRS and one in each T wave. In scrutinizing all the other leads, I cannot find evidence for an underlying atrial tachycardia or atrial flutter, so it is probably a coincidence that the P and T “march out” with the assumption of a hidden P wave in the QRS.

jer5150's picture

Jason's Blog: ECG Challenge for the month of June, 2013.

Unfortunately, I have no available clinical data on this patient.  Merely looking for an interpretation of the ECG in it's raw form.

All our content is FREE & COPYRIGHT FREE for non-commercial use

Please be courteous and leave any watermark or author attribution on content you reproduce.