This is an interesting case for your students who want to delve into dysrhythmias with an eye on detail. It is also a good teaching case for discussing treatment options when the diagnosis may be uncertain or controversial. I will start the discussion by admitting that I am not an expert of electrophysiology or complex dysrhythmias. My approach has always been more clinical - how is this rhythm affecting the patient and what are the chances it will deteriorate? I hope some of our dysrhythmia Gurus will delve into the rhythm and maybe even provide laddergrams.
The patient: This is a man in his seventies who complains of light-headedness for several days, and feeling worse today, prompting an emergency call. He offers no cardiac history. BP 116/62 and 116/58. Blood glucose 220 mg/dL. Physical exam unremarkable.
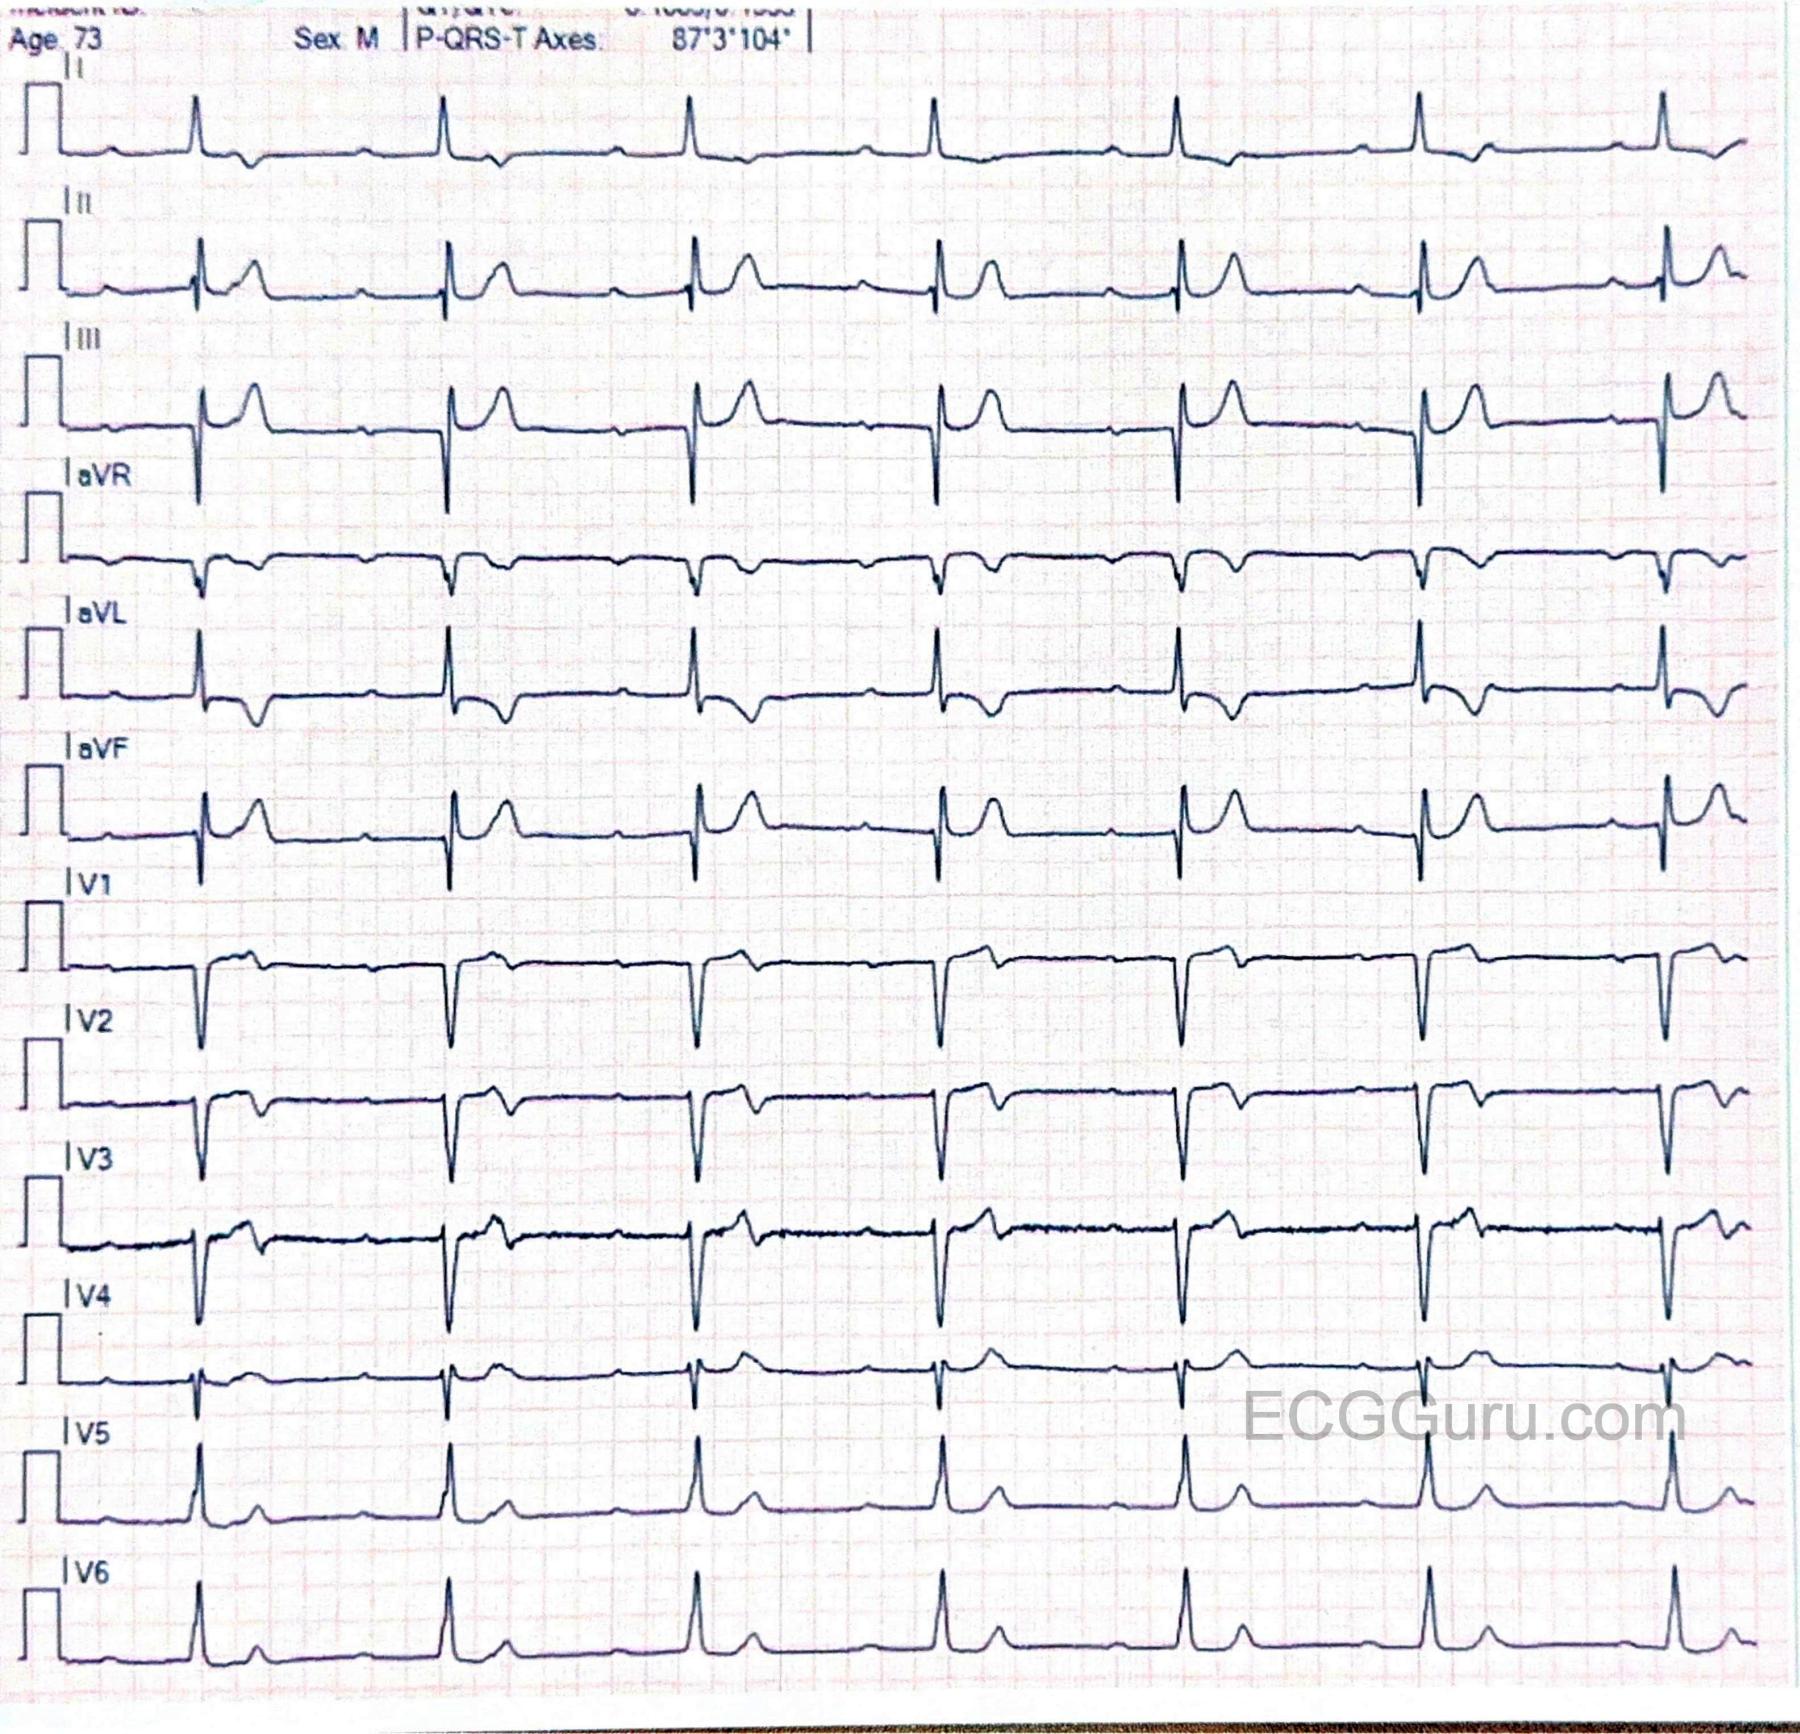
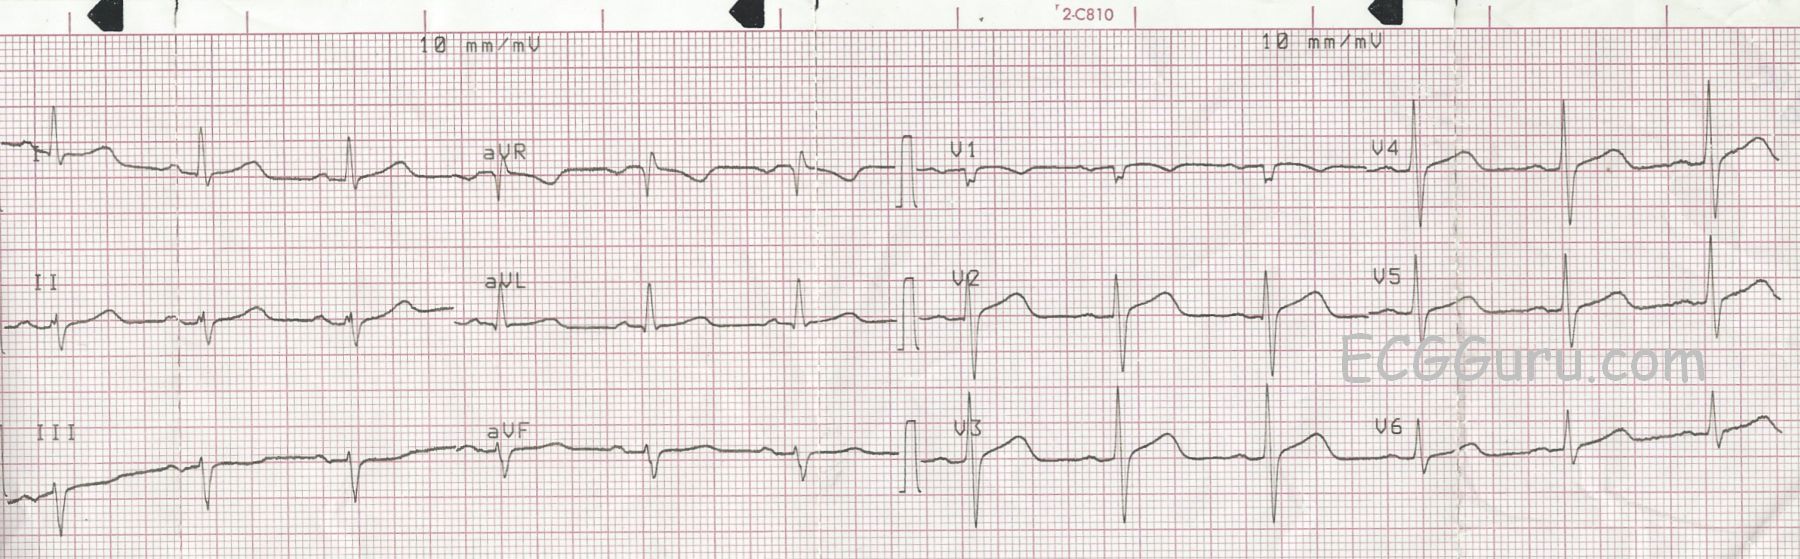
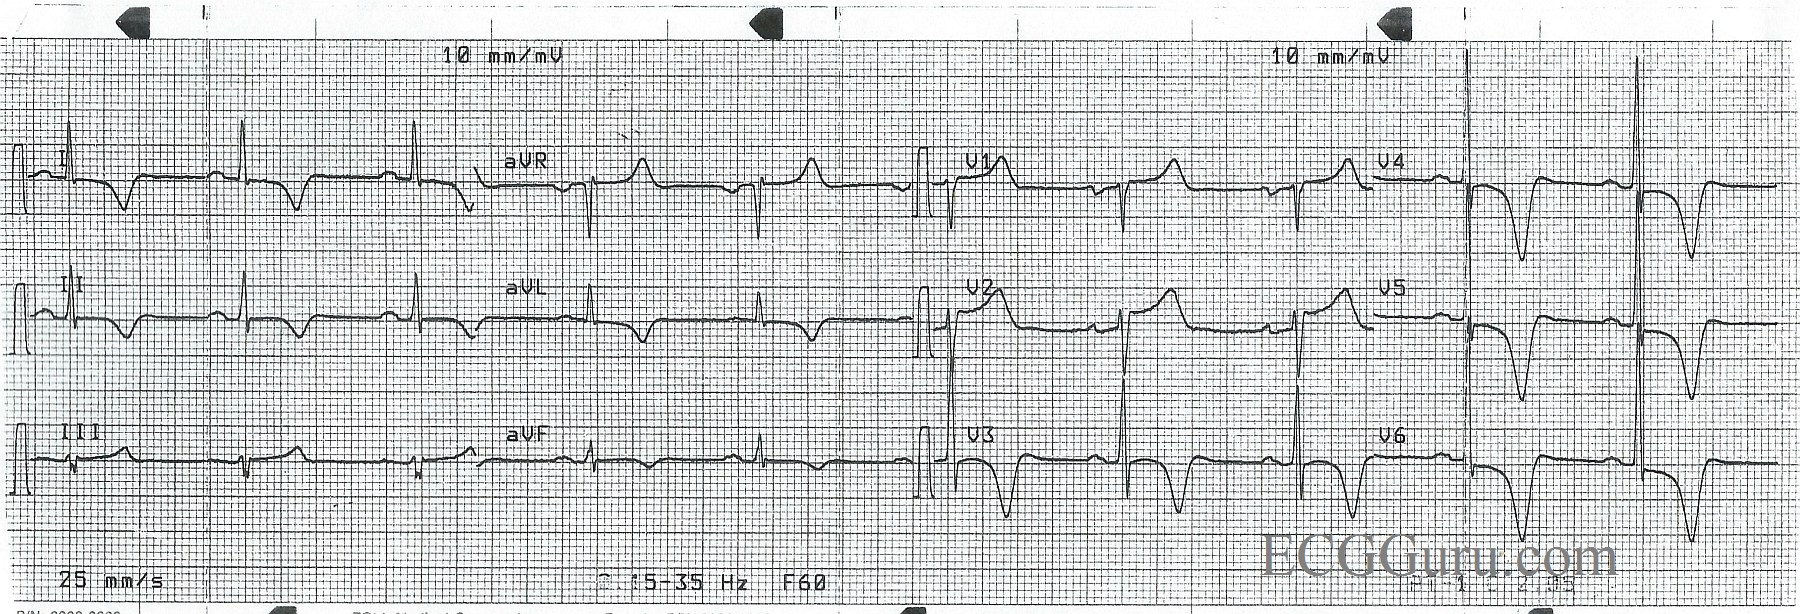
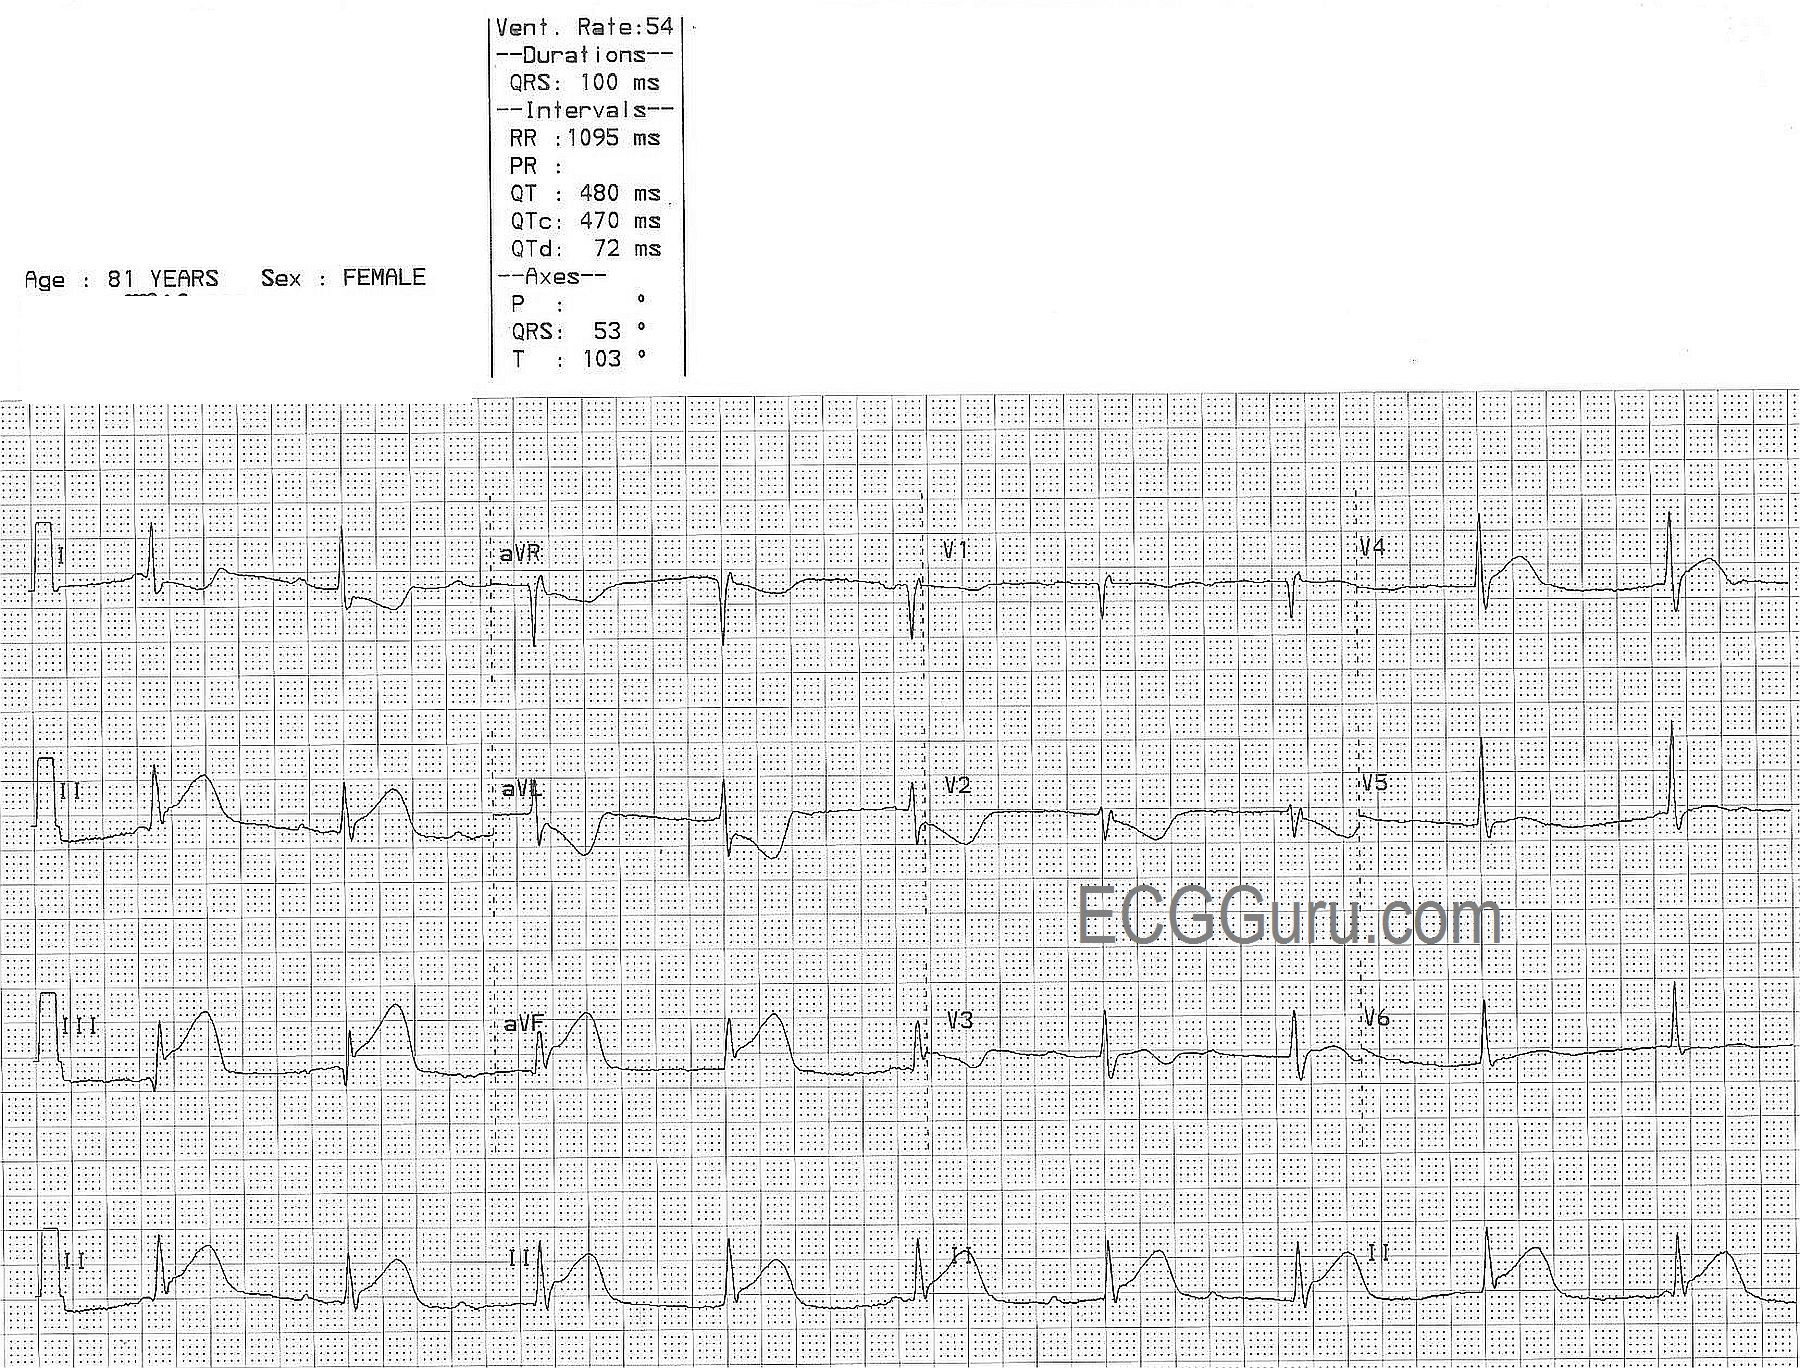
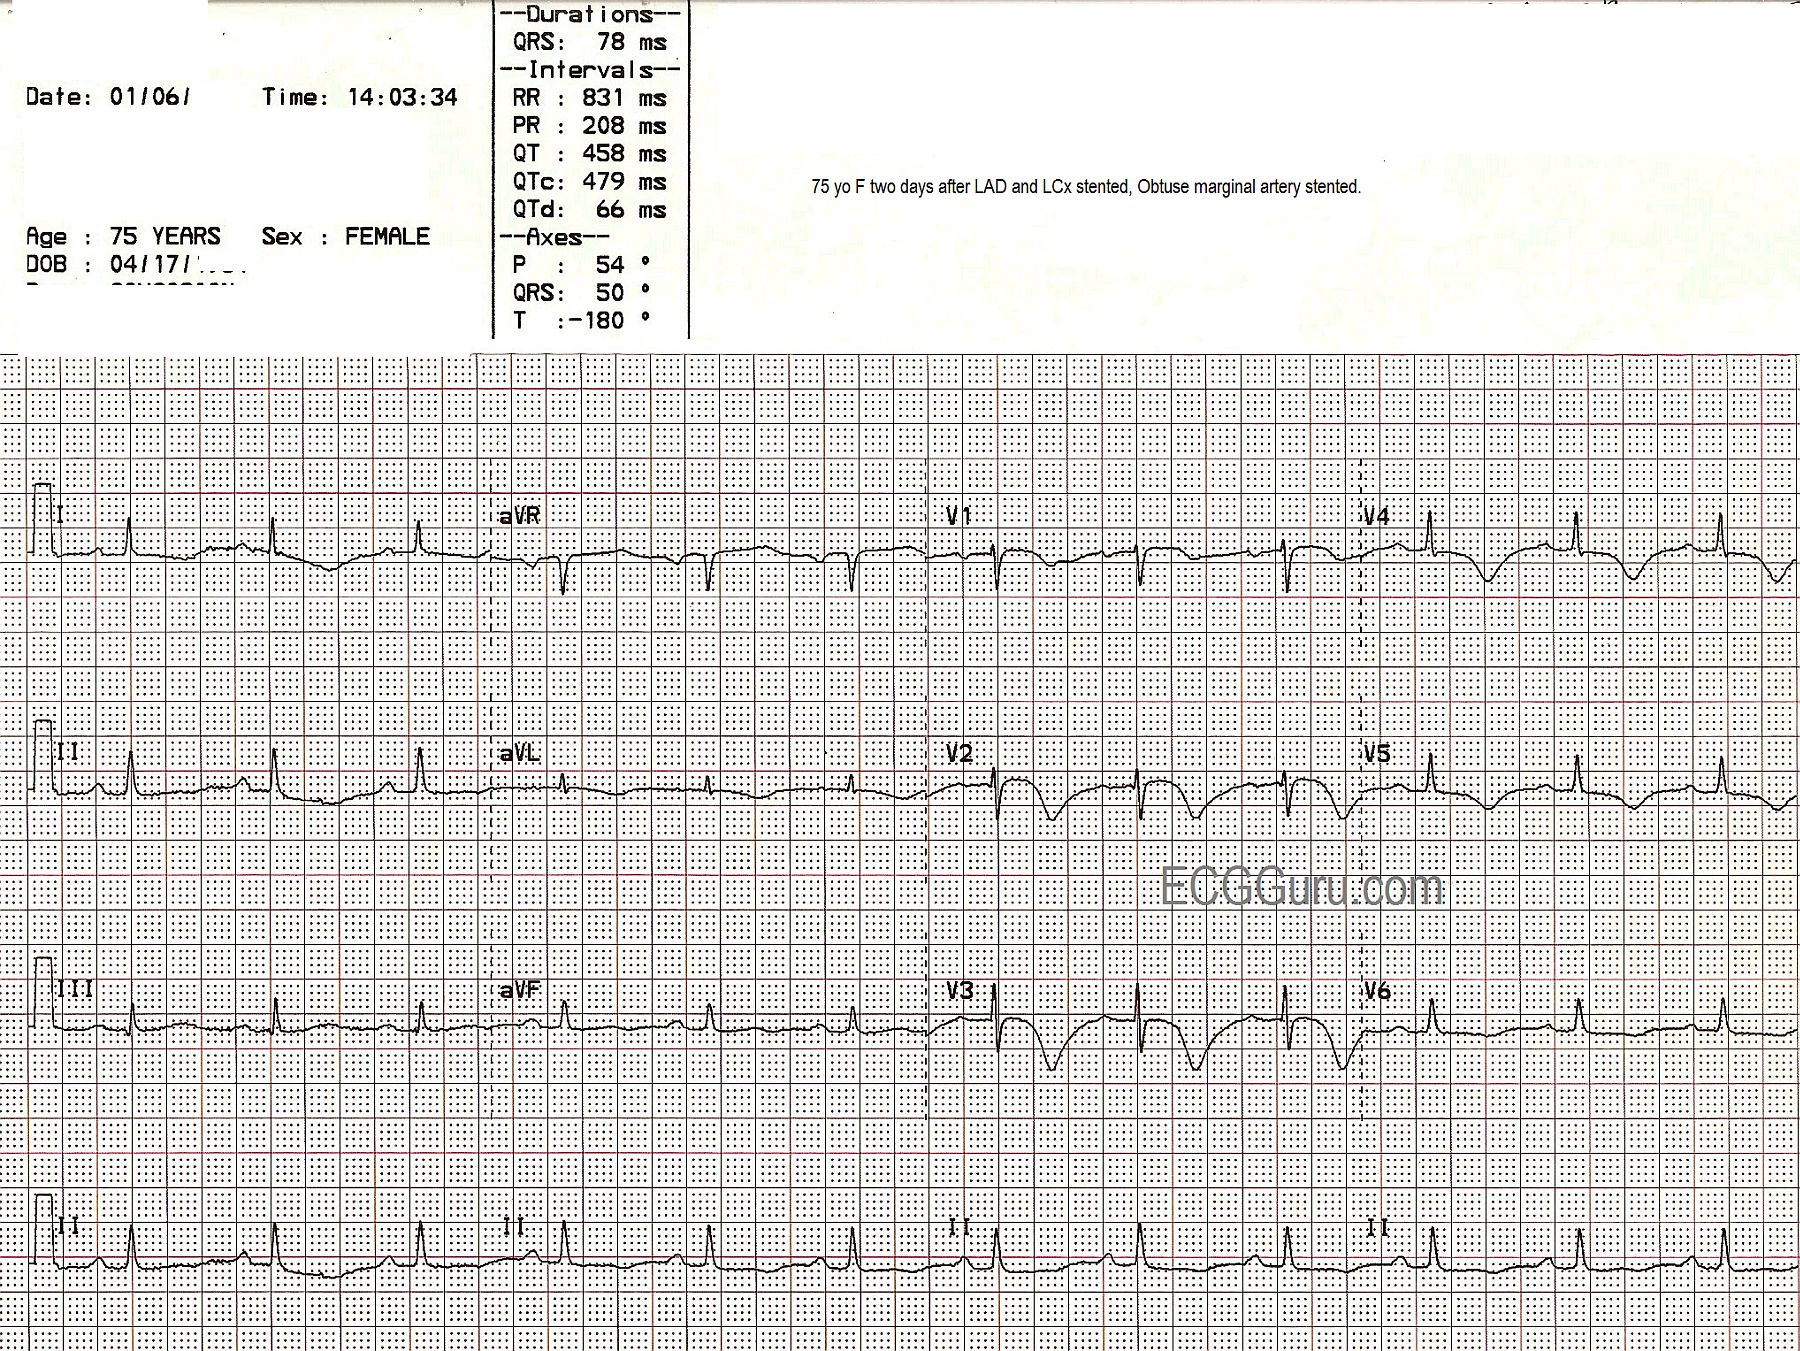
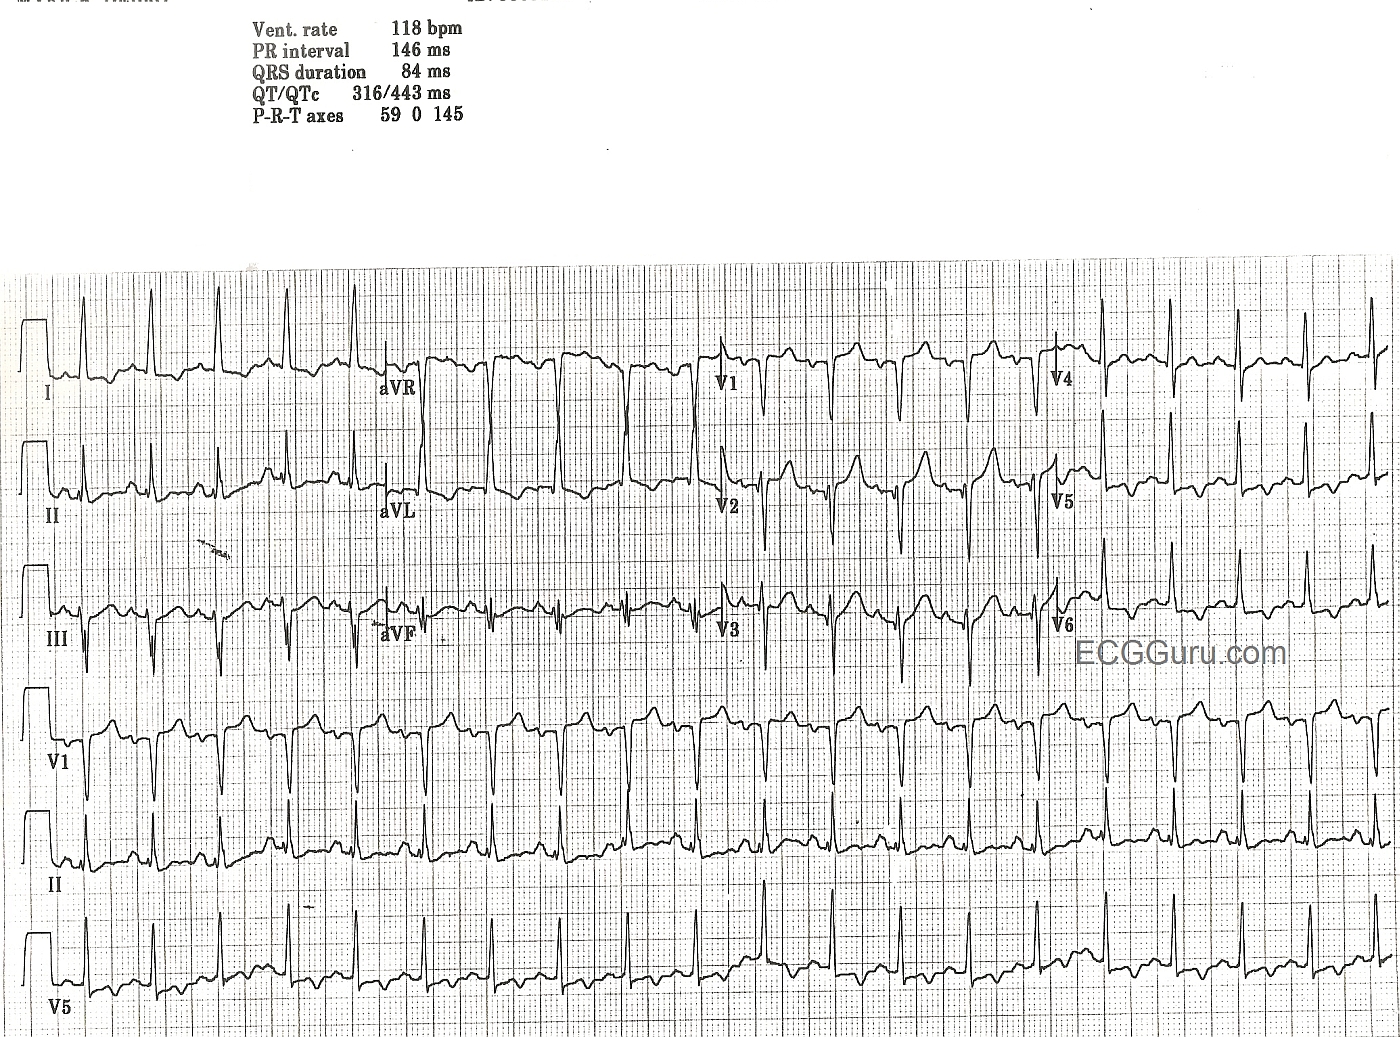
12-Lead ECG : I will admit that, on first quick glance, I thought I was looking at a 2:1 AV block. But on closer inspection, I noted that the "PR intervals" varied, becoming shorter as the strip progressed. Another 12-lead on the same patient showed even more pronounced variations. The atrial rate is about 76 bpm (measured with a digital caliper). The atrial rhythm is fairly regular (allowing for slight variations in sinus rhythm). The ventricular rate is around 39 bpm, almost exactly half that of the atrial rate. This rhythm is also regular. Because of the PRI interval changes, I believe this is complete AVB with an escape rhythm that is just about half the atrial rate. If that is correct, the ventricular rhythm originates in the AV junction, because the QRS complexes are narrow, and the rate is very near 40 bpm. The frontal plane axis is slightly leftward, within normal range, and the R wave progression in the chest leads shows a late transition, with patholoogical Q waves in V1. There are also Q waves in III and aVF.
There are ST and T wave changes in Leads I, aVL, V1, V2, and V3. I do not know if this patient has a history of cardiac disease or a recent complaint of chest pain, but T wave inversion and some biphasic T waves makes me think of reperfusion changes, reflecting a recent M.I. The ST segments in leads with T wave changes are also uncomfortably straight. We do not have followup on this patient's hospital course or treatment.
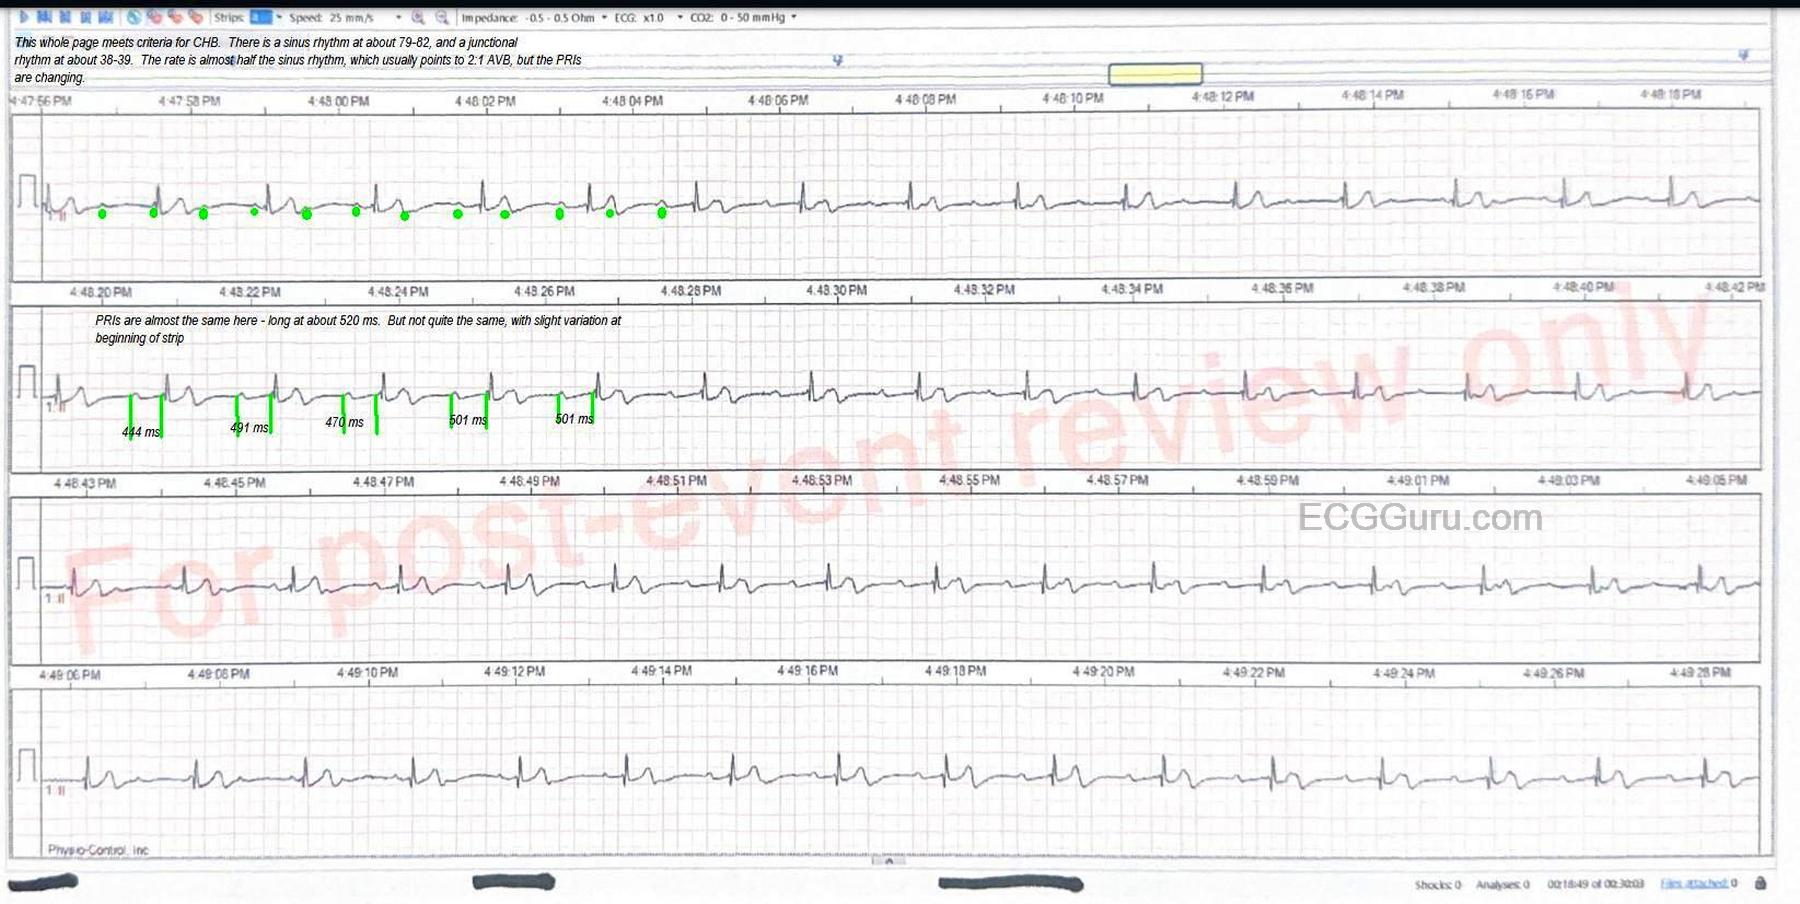
I have included a rhythm strip with some markup for those who would like to really get into the mechanism of this rhythm. For myself, as a retired ER RN and paramedic, I think of the clinical ramifications of such a rhythm.
1) Is this rhythm the result of OMI? This would demand further investigation, probably with a temporary transvenous pacemaker as a safeguard measure.