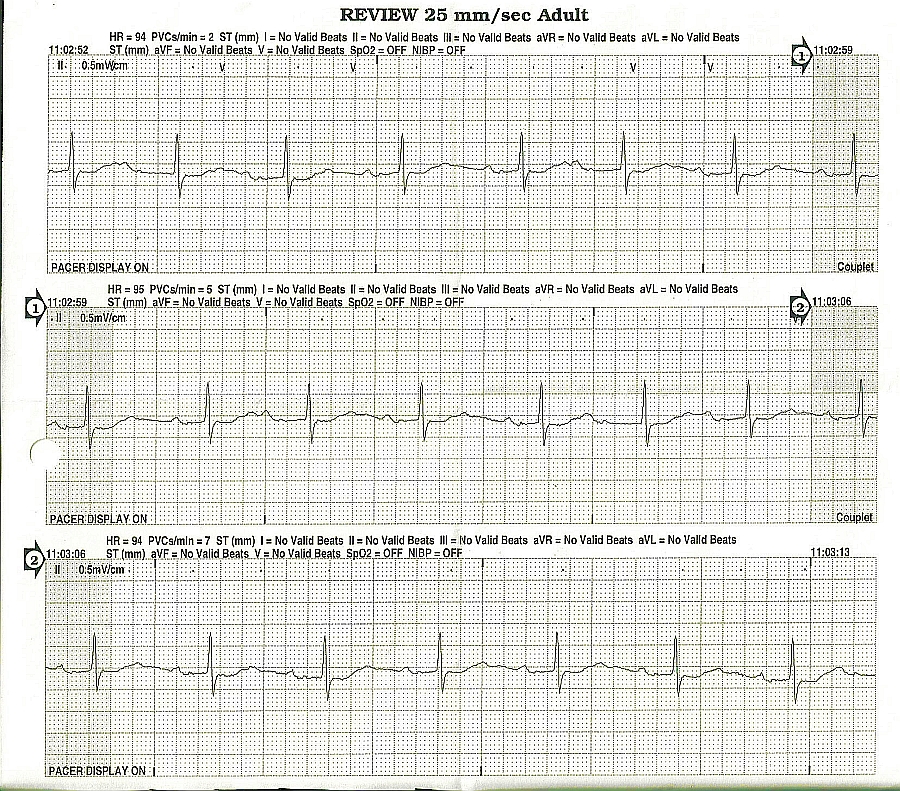
QUESTION: How do you explain the changing PR intervals in the following series of Strips, and is the mechanism related to Wenckebach conduction?
Our expert today is our very own Jason Roediger, who is an ECG Guru blogger, and frequent contributer to the Ask the Expert page. His blog, ECG Challenges, offers you a chance to try your skills and get feedback from Jason. He has a special interest in complex arrhythmias, and is adept at constructing laddergrams that help clarify the mechanisms involved in the rhythms. His bio can be found on the "About Us" page, or on his previous contributions to this page.

Strips courtesy of R.O. from California, USA.
ANSWER:
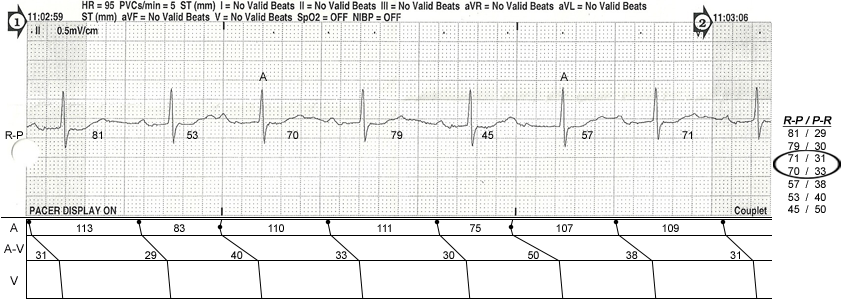
I opted to only construct a laddergram for the middle rhythm tracing rather that for all 3. The bottom strip didn't deserve one since it is only showing sinus rhythm with no ectopy. The top 2 are more-or-less identical in content. However, the middle one was of slightly better diagnostic quality.
This is a classic representation of "R-P/P-R reciprocity". There is a near-linear relationship between the P-R (or P'-R) intervals and their associated R-P (or R-P') intervals. Along the right margin of the tracing, I have compiled a list of the longest R-P interval at the top which is associated with the shortest P-R interval (i.e., 81 / 29). Conversely, at the bottom of the list, the shorted R-P interval is associated with the longest P-R (i.e., 45 / 50). The two lines that I've circled are the only inconsistancy in the logic but are well within an acceptable margin of error.

This patient definitely has AV nodal disease and at a faster atrial rate, they would undoubtedly develop Type I AV block (Wenckebach periodicity) and start "dropping" beats. Whenever you encounter longer P'-R intervals on the APBs, you always have to consider the possibility that conduction jumped over from the fast pathway to the slow pathway which is the initiating mechanism seen in AVNRT. I think that all of the atrial impulses are conducting via the fast pathway (FP) here but the FP is exhibiting varying conduction delays depending on how short or long the preceding R-P interval is. As I've illustrated in the laddergram, you can see that the amount of time it takes for the sinus node to recover after an APB is essentially equal to the basic sinus cycle (e.g., 110 = 111). Dr. Charles Fisch graphically charted R-P/P-R relationships in his book "Electrocardiography of Clinical Arrhythmias" on pages 28 and 29. If you were to chart the R-P and P-R intervals on a graph, they would form a diagonal line that is about 45-degrees. If you don't have Dr. Fisch's book in your personal library, you should really buy a copy. I refer to it all the time!