Displaying 61 - 70 of 83
Dawn's picture

Teaching Series 1113: ECG 1 of 6 - Acute Anterior Wall M.I.

This is the first of six ECGs donated to the ECG Guru by our friend, Jenda Enis Štros. 

The patient is a man in his 60's with chest pain.  This is a pre-hospital ECG showing ST elevation across the anterior wall, beginning in V2.  Though the upwardly-concave shape "smile" appears rather benign, the amount of j-point elevation in these five related leads - in a man with chest pain - does not favor a diagnosis of early repolarization. The diagnosis is STEMI, and the cath lab is activated.

Links to the entire series of six ECGs:  

http://www.ecgguru.com/ecg/teaching-series-1113-ecg-1-6-acute-anterior-wall-mi

http://www.ecgguru.com/ecg/teaching-series-1113-ecg-2-6-acute-anterior-wall-mi

http://www.ecgguru.com/ecg/teaching-series-1113-ecg-3-6-acute-anterior-wall-mi

http://www.ecgguru.com/ecg/teaching-series-1113-ecg-4-6-acute-anterior-wall-mi

http://www.ecgguru.com/ecg/teaching-series-1113-ecg-5-6-acute-anterior-wall-mi


http://www.ecgguru.com/ecg/teaching-series-1113-ecg-6-6-acute-anterior-wall-mi


Dawn's picture

Teaching Series 112213 Inferior-posterior Wall M.I. With Right Ventricular M.I.

This series of ECGs was taken during ambulance transport of a 67 year old man with chest pain.  Earlier the same week, this man had been discharged from the hospital after having a cardiac cath, angioplasty, and stents. He was discharged the next day.  The patient stated that, until that hospital admission, he was healthy, athletic, and had no significant medical history.  He is currently taking a statin, atenolol, and "one of the new blood thinners" - he didn't know the name.

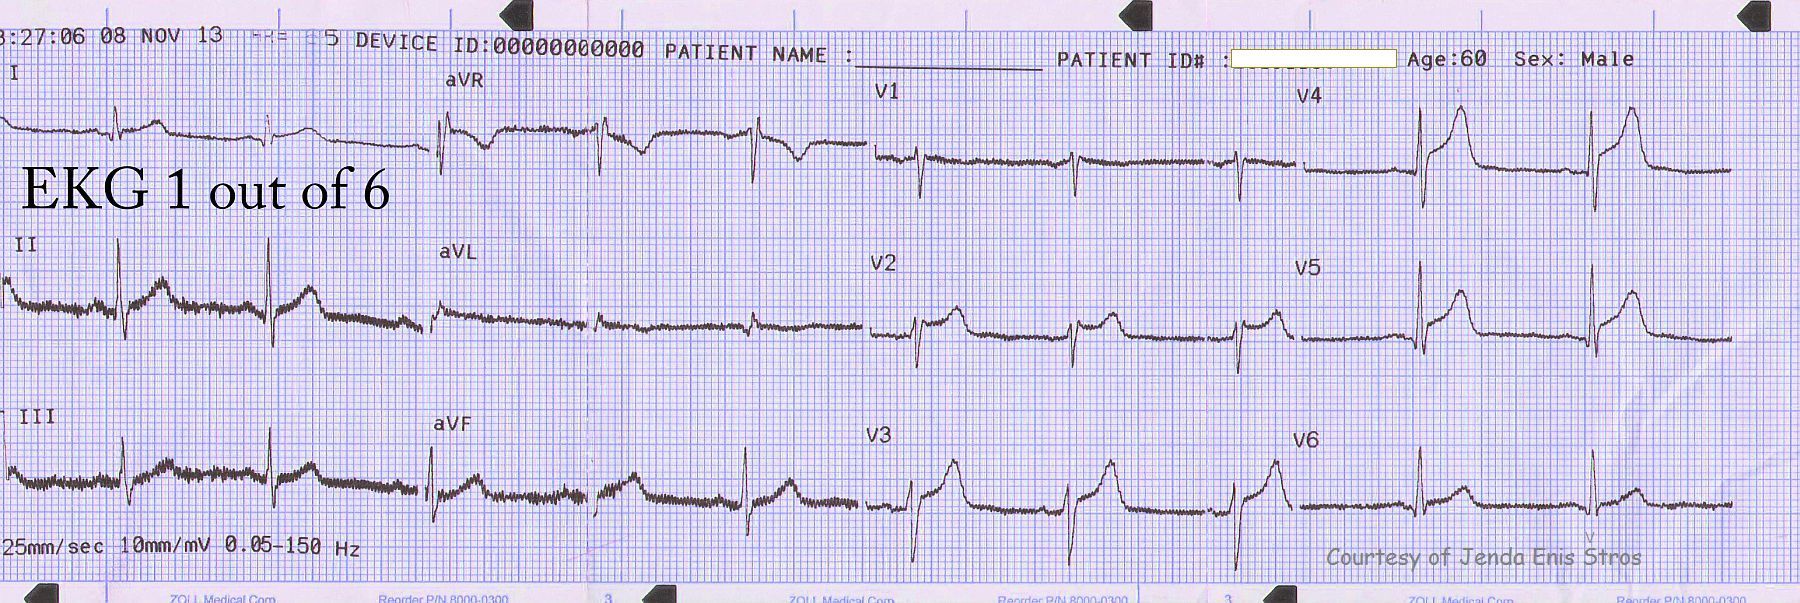
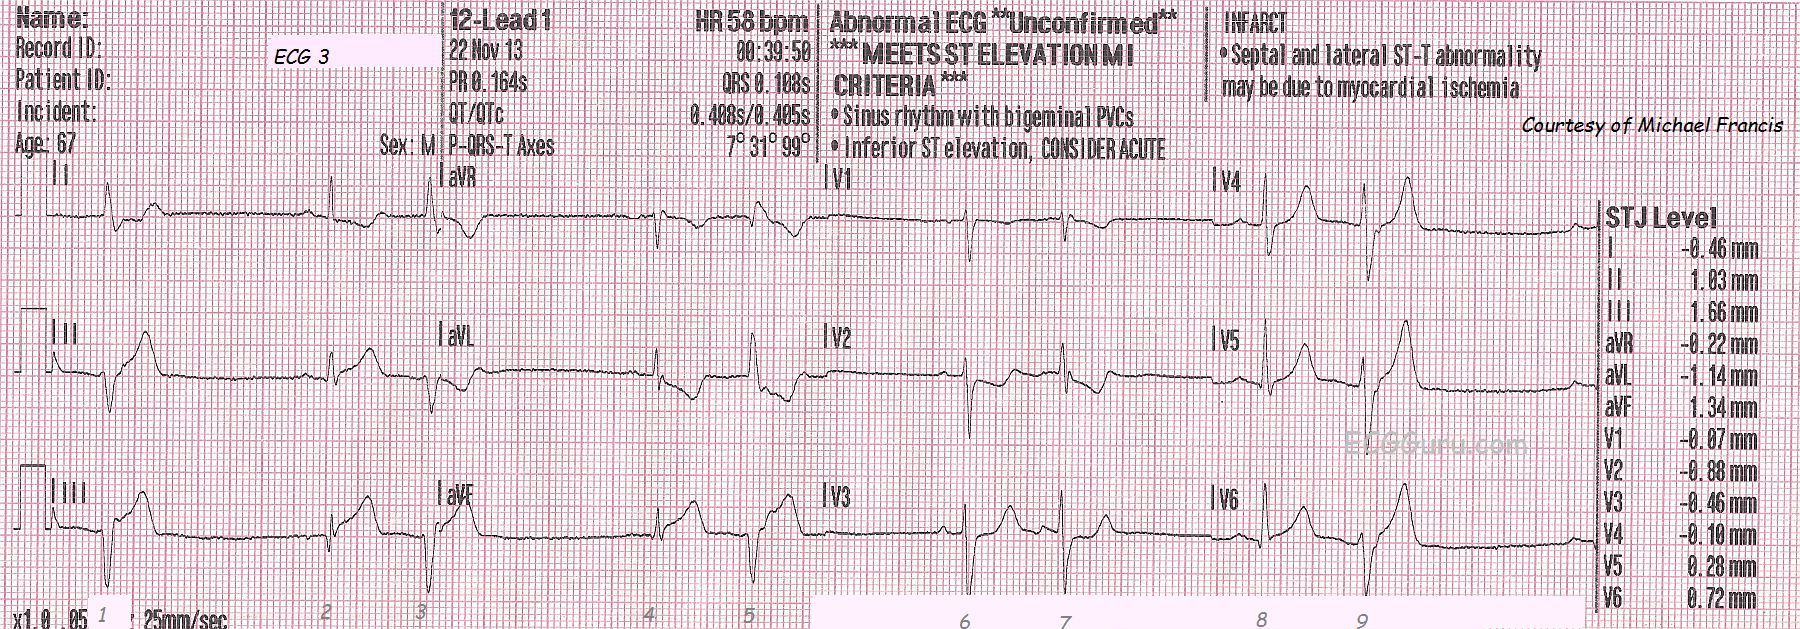
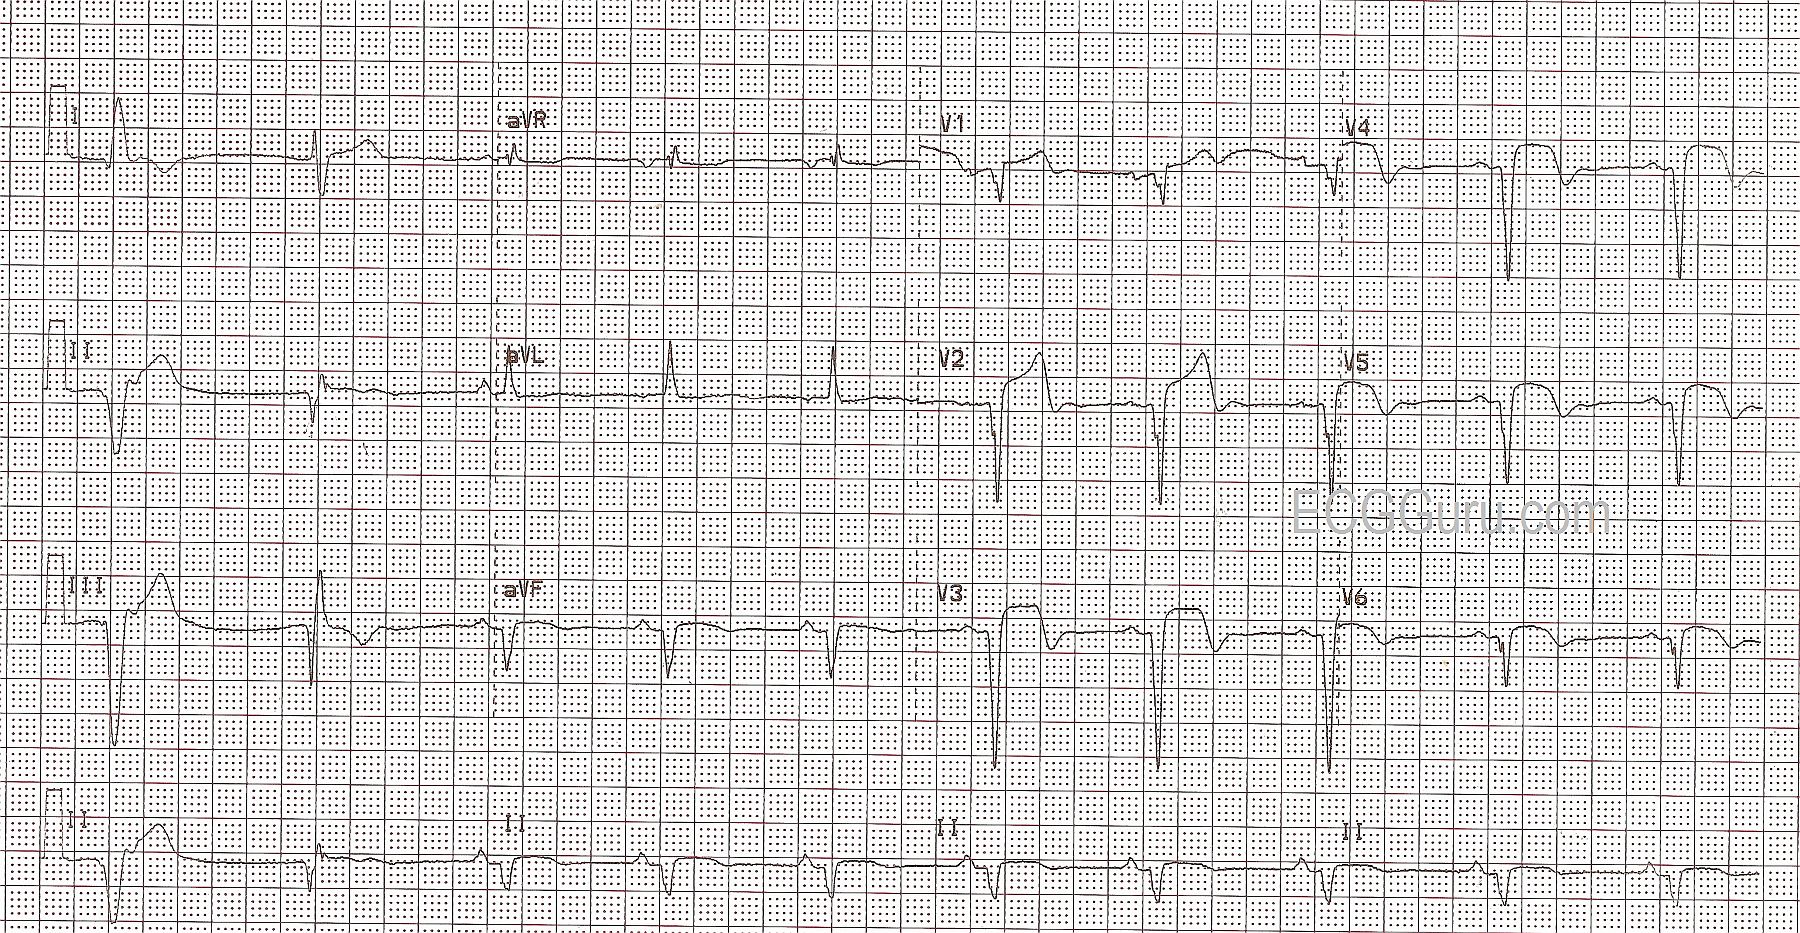
 ECG No. 3 is the first one shown here, taken at almost 39 minutes after midnight.  The patient was complaining of chest pain of 8 on a 1-10 scale.  His skin was pale, cool, and clammy.  The ECG shows acute inferior-posterior M.I., with ST elevation in II, III, and aVF and reciprocal ST depression in V2, and V3.  V1 would normally be depressed in posterior extension of an inferior wall M.I. - unless the right ventricle is also infarcted.  The message from the right ventricle to V1 would be "elevate", countering the message from the posterior wall, "depress".   The rhythm is sinus with ventricular bigeminy.  The rescue crew notified the hospital of a "STEMI Alert". The patient received I.V., O2,  nitroglycerin spray and paste, as well as aspirin.  The patient's BP was 144/92.

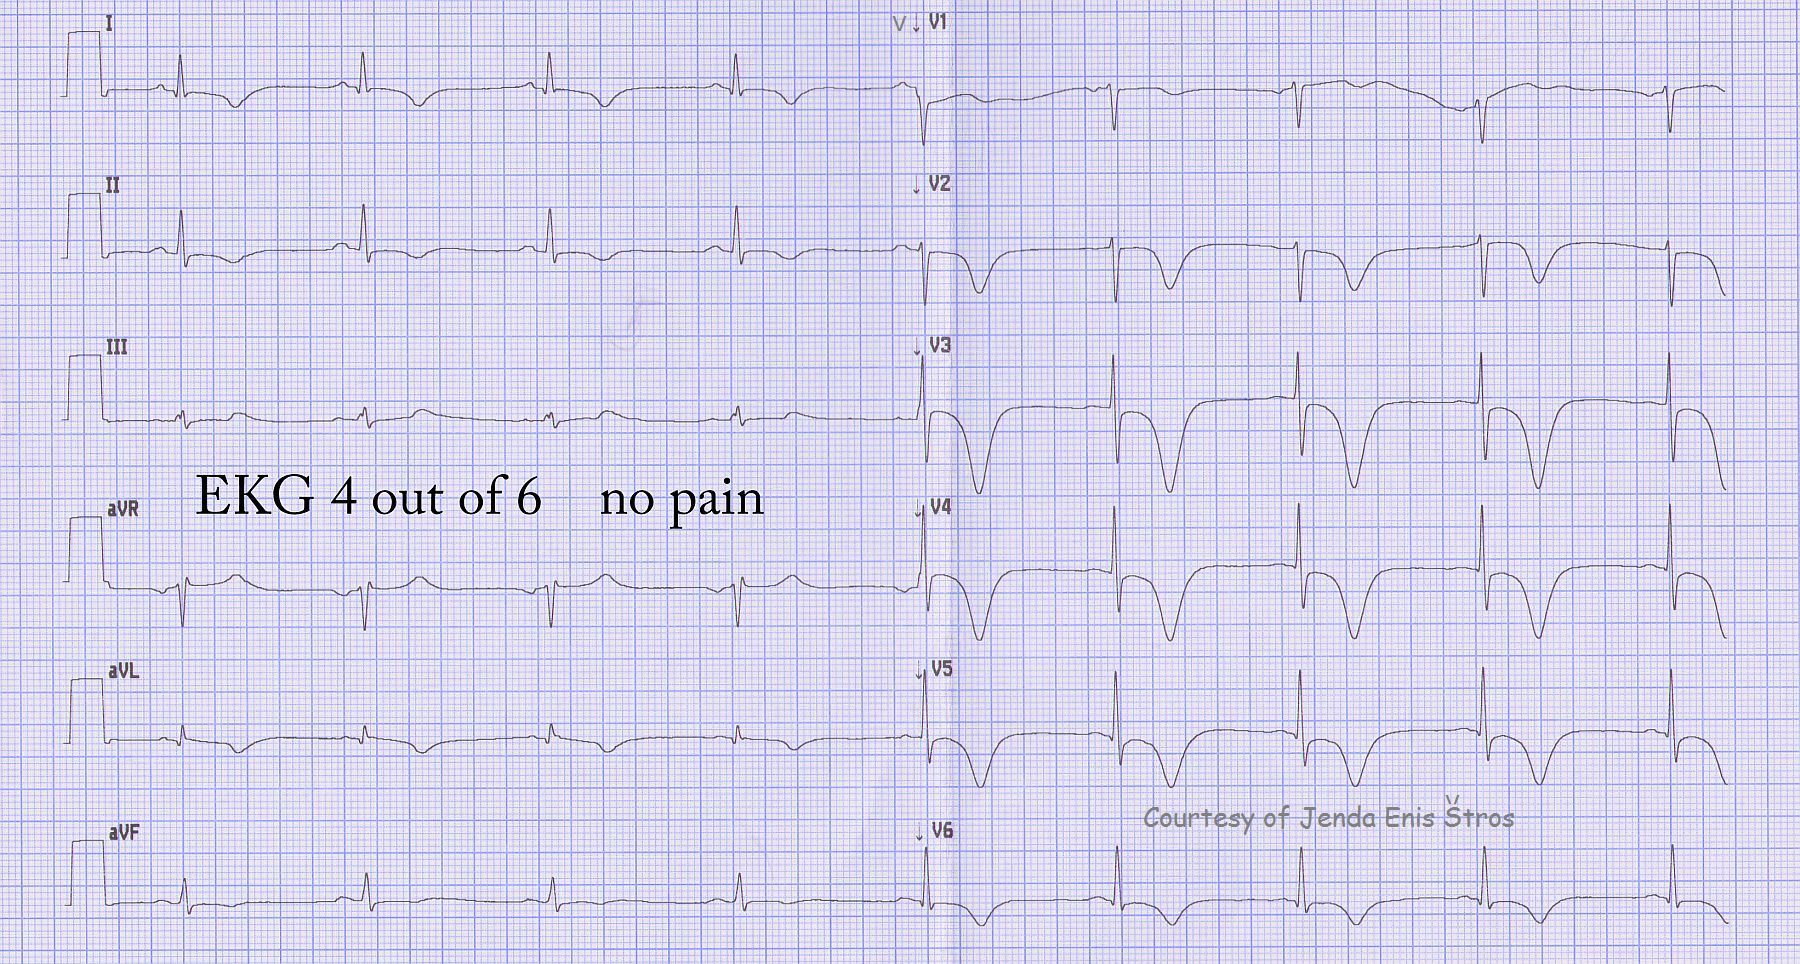
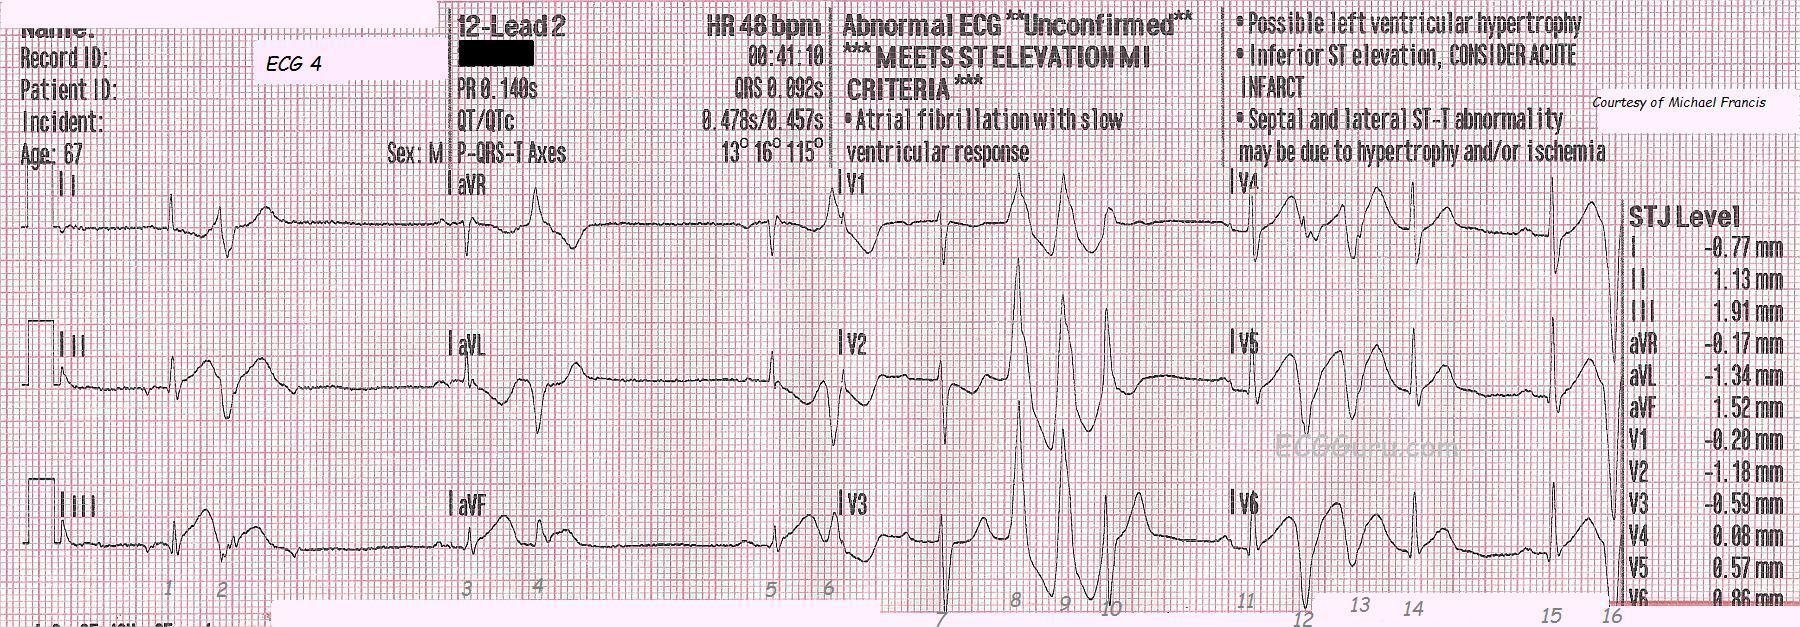
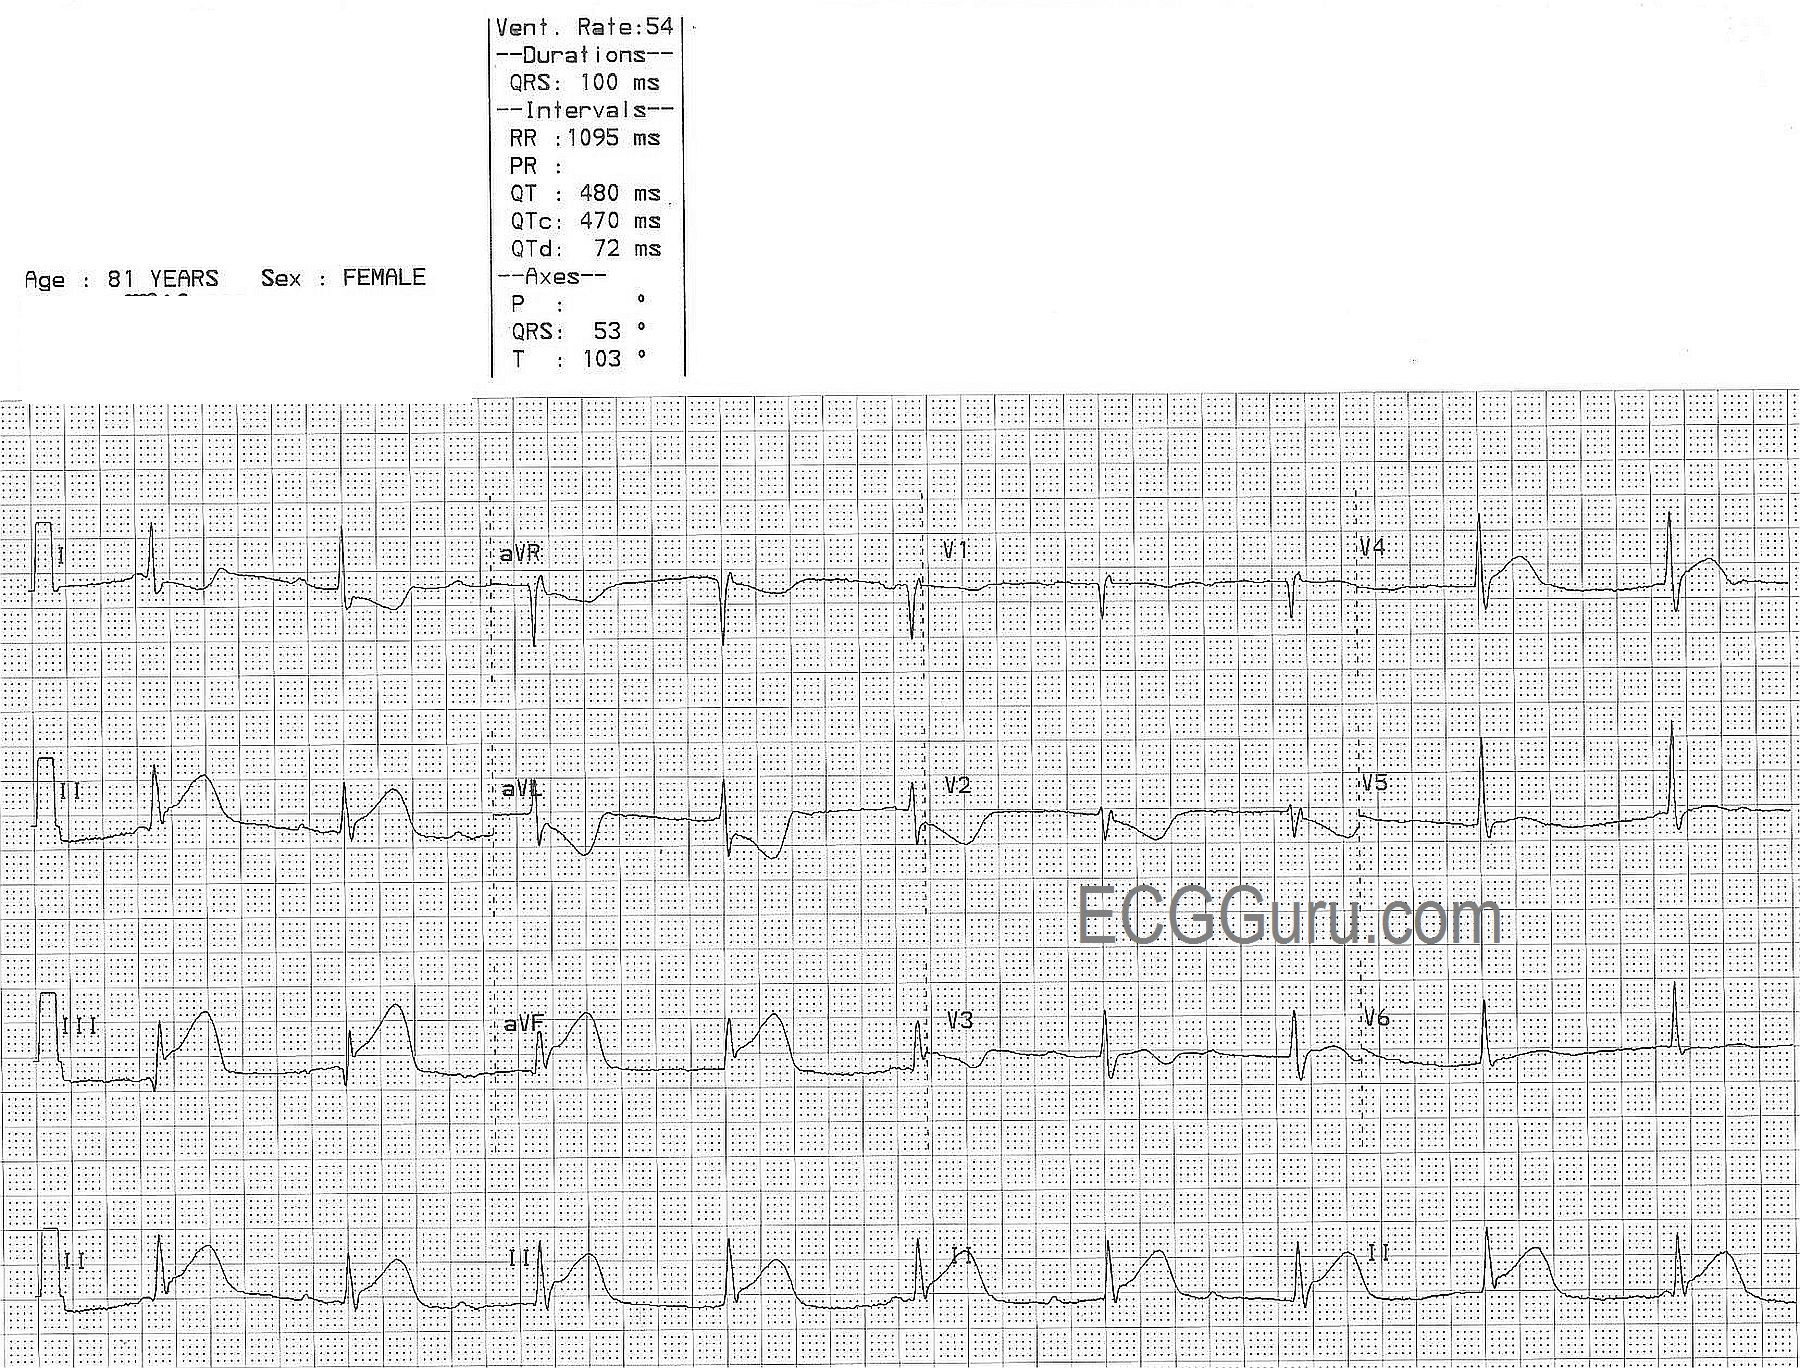
ECG No. 4 was taken at 12:41 a.m.  It shows a change in P waves probably reflecting a low atrial focus.  The patient has a slow underlying rhythm with ventricular bigeminy that is probably multifocal.  It is very hard to determine multifocal PVCs when there is no concurrent rhythm strip, but this is a three-channel ECG machine, and the rhythm strips are run separately from the 12-lead.  There are runs of V Tach toward the end of the ECG, and this is not a good sign in a patient with ST elevation.  In some cases, the V Tach can become persistent, in others it is transient.  The ST elevation and reciprocal depressions are still evident.

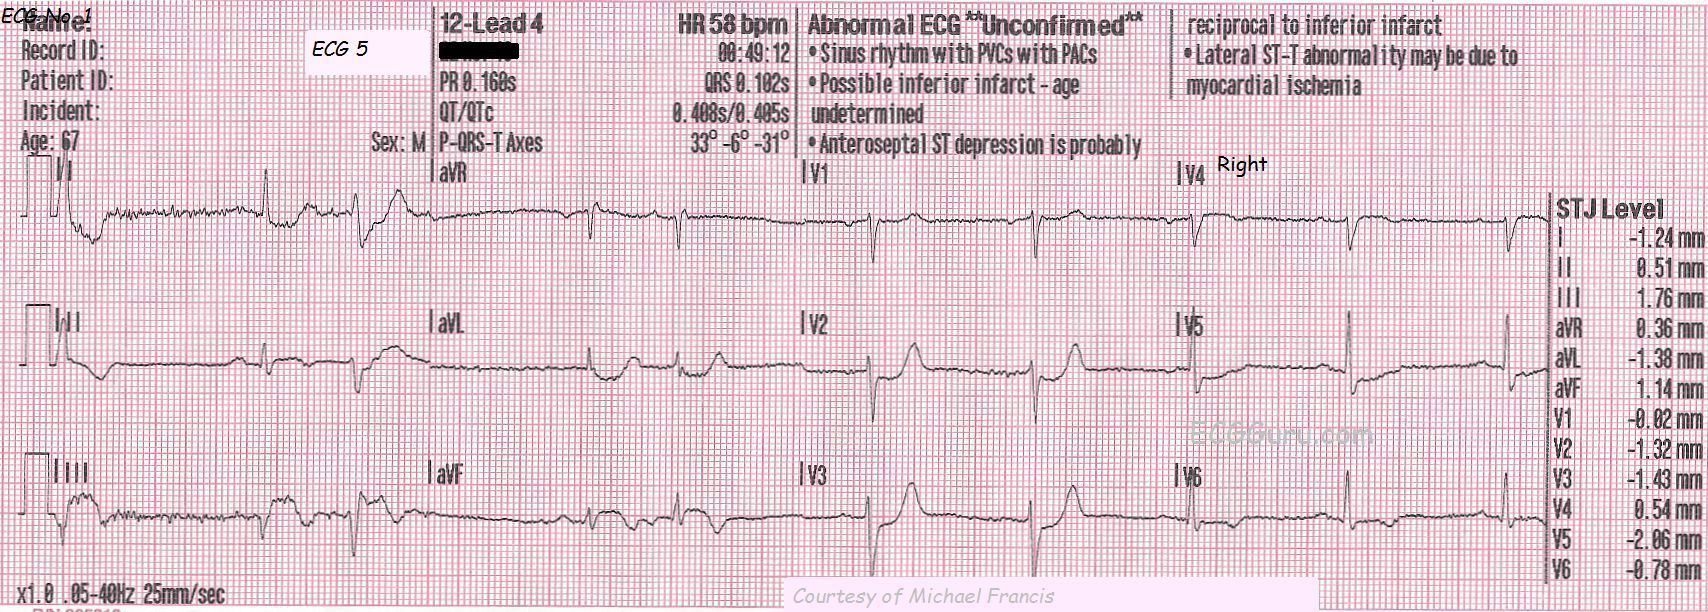
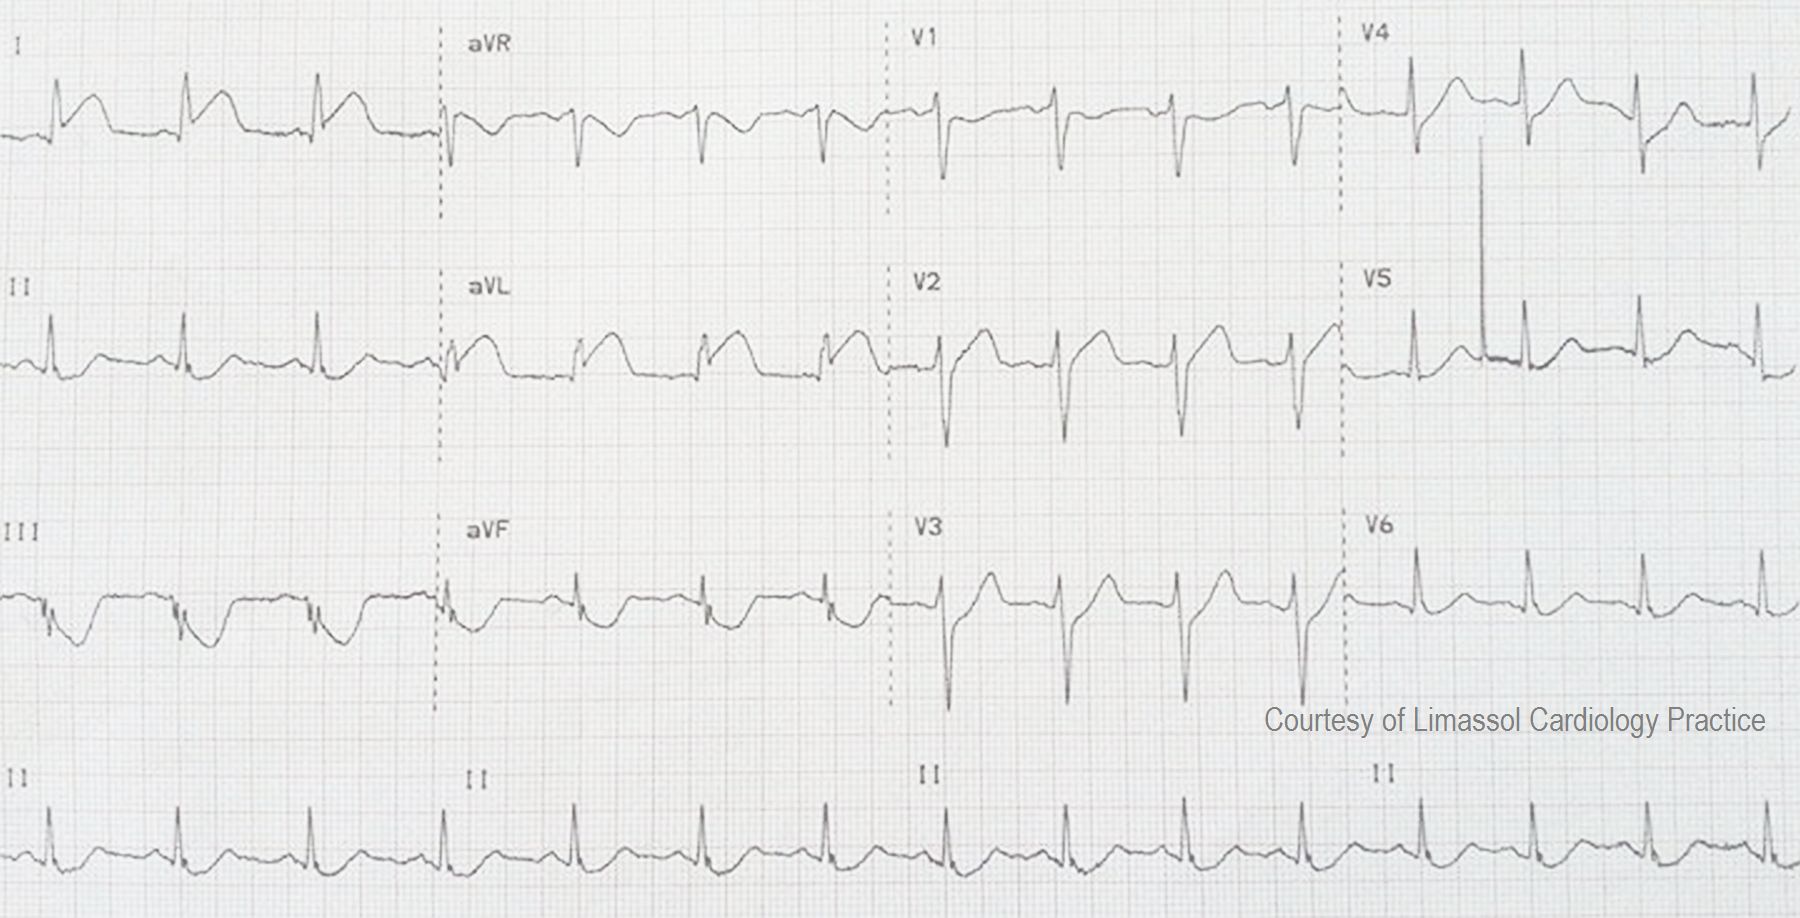
ECG No. 5, taken at 12:49 a.m., shows further development of the ST segments, and the classic "domed" shape of STEMI.  In addition, a pathological Q wave has appeared in Lead III, possibly indicating permanent damage from this M.I.  In this ECG, the paramedics have moved the V4 wire to the V4 Right position to better view the right ventricle.  V4 Right is slightly elevated, and definitely dome-shaped, like a frown.  This is an indication that the RV is injured, and medications that lower BP (especially nitroglycerin) should be avoided in the pre-hospital setting because of the danger of loss of preload of the RV and sudden drop in cardiac output. The patient's BP at this time was 138/85.

Dawn's picture

Anterior Wall M.I. With Previous Inferior Wall M.I.

This ECG illustrates an acute anterior wall M.I. in a patient with a previous history of inferior wall M.I.  The anterior wall M.I. can be seen in the classic signs in V1 through V6:  ST elevations with coved upward shape (tombstones), T waves inverting beginning around V2 and continuing through V6, and pathological Q waves in V1 through V6.

The patient had a history of previous inferior wall M.I., unknown age.  This is normally seen in Leads II, III, and aVF.  The first two complexes on the strip are wide QRS complexes without associated P waves, presumably ventricular.  It is impossible to know from this ECG whether the first complex is a PVC or escape beat, but the second appears to be escape.  So, to evaluate the ST segments, T waves, and pathological Q waves in the inferior wall, all we have are aVF and the Lead II rhythm strip at the bottom.  These show pathological Q waves (necrosis), and some slight elevation of ST, with coving or horizontal flattening.  From this, we know there is damage in the inferior wall, but the age of the M.I. is undetermined.

This patient went to the cath lab, and received angioplasty with stenting of the proximal left anterior descending branch of the left coronary artery.

Dawn's picture

Inferior Wall M.I. Due To Circumflex Artery Occlusion

This ECG is from an 81 year old woman with an extensive history of coronary artery disease.  She was experiencing chest pain at the time of the ECG.  We can clearly see ST elevation in Leads II, III, and aVF, indicating an inferior wall ST-elevation M.I. (STEMI).  There are reciprocal ST depressions in Leads I and aVL.  There are subtle and less specific ST changes in V1 (flat ST and T), V2 (ST depression), V3 (ST elevation and inverted T wave), and V4 through V6 (slight ST elevation).  The flat, horizontal shape of most of the ST segments is another clue to her CAD.  What coronary artery do you think is the culprit for the ST elevation?

This patient received coronary angiography, so we do not have to guess at where her lesions are.  She was found to have an occluded left internal mammary artery (LIMA) graft.

The left anterior descending coronary artery (top of view) is very diseased, with some extremely narrow areas.  The circumflex artery is large and covers a lot of area, but it, too, is very diseased, with a critical occlusion (marked with arrow).  On this day, the circumflex artery received angioplasty and stents.  The patient's right coronary artery was patent.

In approximately 85% of the population, the RCA supplies the inferior wall of the heart.  In most of the rest, a branch of the circumflex supplies the posterior/inferior wall.

This patient also has a very interesting arrhythmia.  We see P waves (numbered) that appear regular for three beats, then we see no P waves for a pause.  Then, three more P waves appear.  There is no readily-seen "hidden" P wave in the ST segments or T waves.  Even though there appear to be "progressively prolonging PR intervals", the PR intervals of each group of three do not match the other group of three.  The first "PRI" - P wave number 1- and the last one - P wave number 7 - appear too short to be normal PR intervals.  The ventricular rate is regular, and the QRS complexes are slightly wide at  .10 sec.  The rate is 54 bpm.  This suggests junctional rhythm.

We are eager to hear your comments regarding this rhythm.

Dawn's picture

Acute Lateral Wall M.I.

This week's ECG for your collection was kindly donated by Dr. Stasinos Theodorou, interventional cardiologist with the Limassol Cardiology Practice in Cyprus. It offers a wonderful teaching opportunity, and illustrates how valuable an ECG can be in locating a lesion during an M.I.   Dr. Theodorou previously posted this ECG and the angiograms from the same patient on FaceBook, and he has offered them to the users of the ECG Guru website  free of copyright.

Dr. Theodorou reports that the culprit lesion in this M.I. was initially very difficult to find on angiogram.  In this case the culprit was an ostially occluded second diagonal artery which, due to the anatomy, was almost impossible to spot from the initial diagnostic images.  There was no "stump" because the occlusion was in the ostium - the beginning of the artery.  The patient also had a significant right coronary artery lesion, but it was not the cause of the M.I. because the RCA perfuses the right ventricle and inferior/posterior wall of the left ventricle.  The ST elevation in this ECG is in I and aVL - the area of the high lateral wall.  Because the  ECG appeared to be inconsistent with the angiogram, Dr. Theodorou obtained further projections, allowing him to identify and treat the offending lesion.  This illustrates the importance of the ECG in locating coronary artery lesions, even in this age of high technology and cath labs.  The interventional cardiologist's proficiency in ECG interpretation enabled him to find this "invisible" lesion.

We are grateful to Dr. Theodorou for sharing this valuable learning experience with us.  You can find more from Dr. Theodorou on his website, FaceBook page, and here, on our "Ask the Expert" page.


Dawn's picture

Anterior Wall M.I.

This series of three ECGs is from a 75-year-old woman who came to the Emergency Dept. with chest pain.  The first ECG shows ST elevation in V1, V2, and V3, with generally low voltage in the QRS complexes. There is some coving upward of the ST segment in aVR, which can suggest a very proximal lesion of the left coronary artery (LCA).  She was taken to the cath lab, where it was discovered that she had a 100% occlusion of the midportion of the anterior descending branch of the left coronary artery, which was repaired and stented.  The second ECG, taken after the angioplasty, shows some Q waves in V1 and V2, with poor R wave progression in the V leads.   A 25% occlusion of the obtuse marginal branch of the circumflex artery was stented two days later. The third ECG was obtained after that procedure.  It shows that the Q waves have disappeared in the anterior leads (possibly due to different technicians performing the ECGs with different lead placement).  It also shows marked T wave inversion in I and aVL, representing ischemia in the lateral wall, and in all the chest leads, representing ischemia in the anterior wall.  The QTc is prolonged in this third ECG at 479 ms.  It is not known what medications the patient was on.  This patient also had a 50% proximal occlusion in the RCA and a 75% occlusion in the posterior descending artery.   This is a good example of a patient with extensive coronary artery disease who finally presented for treatment when she developed ST elevation M.I.  

Dawn's picture

ECG Basics: Normal Sinus Rhythm With ST Segment Elevation

This Lead II rhythm strip was taken from a 12-Lead ECG performed on a 66-year-old man who was having an acute inferior wall M.I.  The rhythm is normal sinus rhythm at 65 bpm.  The QRS complex is slightly wide at 112 ms (.11 seconds).  The patient did not have a bundle branch block pattern on his 12-lead ECG.  The PR interval is .17 seconds, and the P waves are widened and have a "double peak".  This can be a sign of left-sided heart failure, and is called P Mitrale.  Your students should be advised not to try to diagnose acute M.I. from a monitor strip, as ST segments can be inaccurate on some types of monitors.  However, any derangement of the ST segment on a monitor strip calls for an immediate 12-Lead ECG for confirmation.

Dawn's picture

Inferior Wall M.I.

This ECG was obtained from a 78-year-old woman who had been experiencing intermittant chest pain for two days.  When she finally presented to the Emergency Department, her ECG showed ST elevation in the inferior leads II, III, and aVF.  She also has ST depression in I and aVL, which represents reciprocal changes seen in the high lateral leads, which are opposite the inferior wall.  In addition, V1 and V2 show some ST depression, with early transition of the R waves (taller than normal for V2 and V3).  This is a common finding in IWMI, and indicates posterior wall involvement.  The injury is continuous from the inferior wall of the left ventricle, up the posterior wall, because both were supplied in this case by the right coronary artery.

This ECG has three rhythm strips.  The more rhythm strips you have, the easier it is to determine the rhythm.  In this case, the rhythm is normal sinus rhythm.  But the extra rhythm strips would allow you to compare P wave morphology in three views if the rhythm was in question.  Instructors:  ask your students what they think about this rate (78 per minute) in the setting of acute M.I.   Is it within normal range? Is it optimal for the injured heart?   Another good point to bring up is the use of additional right-side leads to assess the right ventricle.  V3R and V4R can be very useful in determining whether right ventricular M.I. is also present.  Some practitioners skip this step and evaluate the RV using echocardiography.  In the emergency setting, however, it can be very helpful to know the condition of the RV.  RVMI is always a possiblity in RCA occlusion, and RVMI can increase mortality significantly.  BP must be protected, since the injured right ventricle is very dependent on preload to function adequately as a pump, providing preload for the left side of the heart.

This patient was lost to followup.

Dawn's picture

Acute M.I. In A Patient With Left Ventricular Hypertrophy

This 60-year-old man presented to the Emergency Department with chest pain and shortness of breath.  He gave a history of having seven coronary artery stents in the past.

This is a good ECG for demonstrating the voltage and ST criteria for LVH and acute anterio-lateral wall M.I. in the same patient, where both conditions have been confirmed by other tests.   If you are teaching the topics of ST elevation M.I., or left ventricular hypertrophy, you will probably have to address the issue that LVH can be considered a "mimic" for STEMI, especially for beginners.  This is because LVH causes ST depression in leads with upright QRS complexes, and reciprocal ST elevation in leads with negative QRS complexes.  This is called ST segment discordance.  The ST changes in LVH are due to the "strain" pattern, indicating strain on the left ventricular myocardium.  It is true that some ST elevation will appear in V1 and V2 in these patients, and can be mistaken for M.I.  In the ECG shown here, the patient has definite ST elevation in leads which would NORMALLY have depression in the LVH strain pattern.  Leads V3 through V6 and I and aVL have ST elevation that is not discordant, and is definitely real. In addition, the ST elevation in V1 and V2 are greater than expected for LVH alone.

The criteria most often used to determine LVH is the Sokolov-Lyon Criteria, (S wave in V1 + R wave in V5 or V6 = 35 mm).  It is best to confirm the LVH with echocardiograhy.

This patient was taken to the cath lab, and the M.I. was confirmed, although his case was lost to followup, and we do not know if he received more angioplasty, coronary artery bypass, or other treatment, or what his condition was post catheterization.

For a similar ECG and discussion on this site, go to this LINK.

Dawn's picture

Inferior-posterior Wall M.I.

This 66-year-old man presented with a complaint of chest pain.  His ECG shows a "classic" inferior wall ST-elevation M.I. (STEMI).  The ST elevation is apparent in Leads II, III, and aVF, which are the leads that reflect the inferior wall of the left ventricle.  In addition, this ECG shows ST elevation in Leads V5 and V6, the low lateral wall.  The ST depression in V1 and V2 are reciprocal changes caused by acute injury in the posterior wall. In the majority, the RCA supplies the inferior-posterior wall, the right ventricle, the right atrium (including the SA node and the AV node), and in some, the low lateral wall.  The proximal location of this man's occlusive lesion has caused damage in all these areas.  The relatively slow rate is common in IWMI and can be caused by SA node injury, vagal stimulation, or medications.  Clinical data is not available for this patient.  

Pages

All our content is FREE & COPYRIGHT FREE for non-commercial use

Please be courteous and leave any watermark or author attribution on content you reproduce.