
Submitted by Dawn on Tue, 12/03/2013 - 21:21
This series of ECGs was taken during ambulance transport of a 67 year old man with chest pain. Earlier the same week, this man had been discharged from the hospital after having a cardiac cath, angioplasty, and stents. He was discharged the next day. The patient stated that, until that hospital admission, he was healthy, athletic, and had no significant medical history. He is currently taking a statin, atenolol, and "one of the new blood thinners" - he didn't know the name.
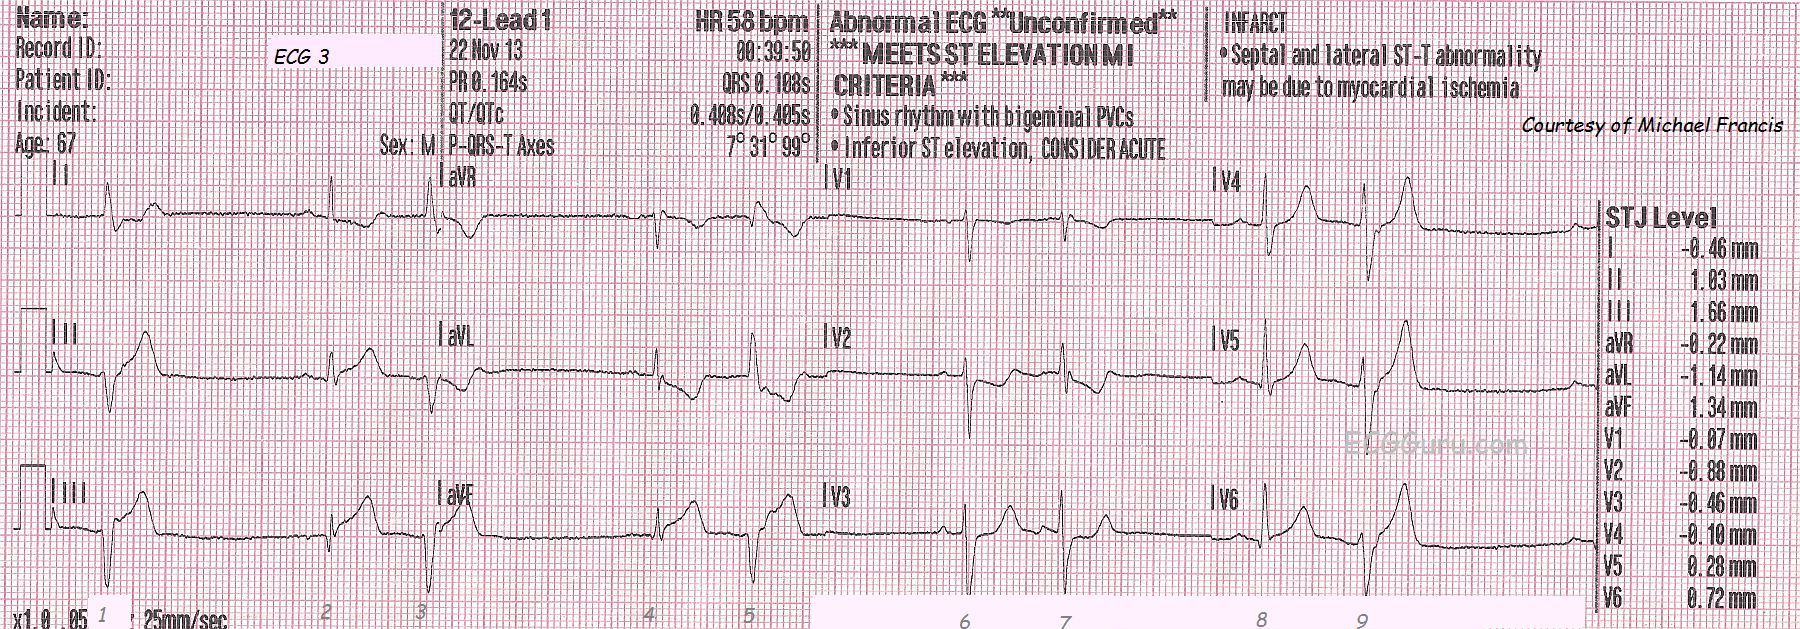
ECG No. 3 is the first one shown here, taken at almost 39 minutes after midnight. The patient was complaining of chest pain of 8 on a 1-10 scale. His skin was pale, cool, and clammy. The ECG shows acute inferior-posterior M.I., with ST elevation in II, III, and aVF and reciprocal ST depression in V2, and V3. V1 would normally be depressed in posterior extension of an inferior wall M.I. - unless the right ventricle is also infarcted. The message from the right ventricle to V1 would be "elevate", countering the message from the posterior wall, "depress". The rhythm is sinus with ventricular bigeminy. The rescue crew notified the hospital of a "STEMI Alert". The patient received I.V., O2, nitroglycerin spray and paste, as well as aspirin. The patient's BP was 144/92.
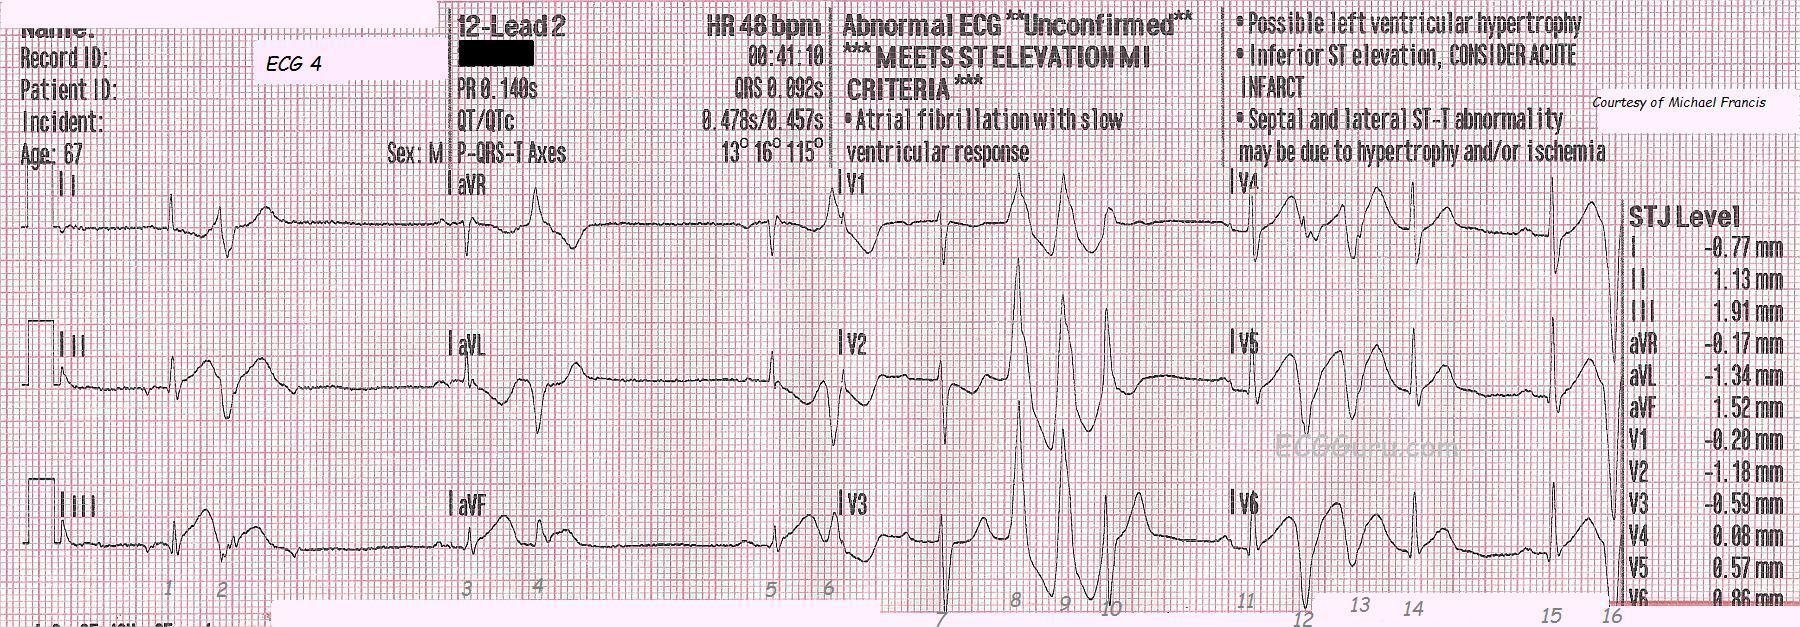
ECG No. 4 was taken at 12:41 a.m. It shows a change in P waves probably reflecting a low atrial focus. The patient has a slow underlying rhythm with ventricular bigeminy that is probably multifocal. It is very hard to determine multifocal PVCs when there is no concurrent rhythm strip, but this is a three-channel ECG machine, and the rhythm strips are run separately from the 12-lead. There are runs of V Tach toward the end of the ECG, and this is not a good sign in a patient with ST elevation. In some cases, the V Tach can become persistent, in others it is transient. The ST elevation and reciprocal depressions are still evident.
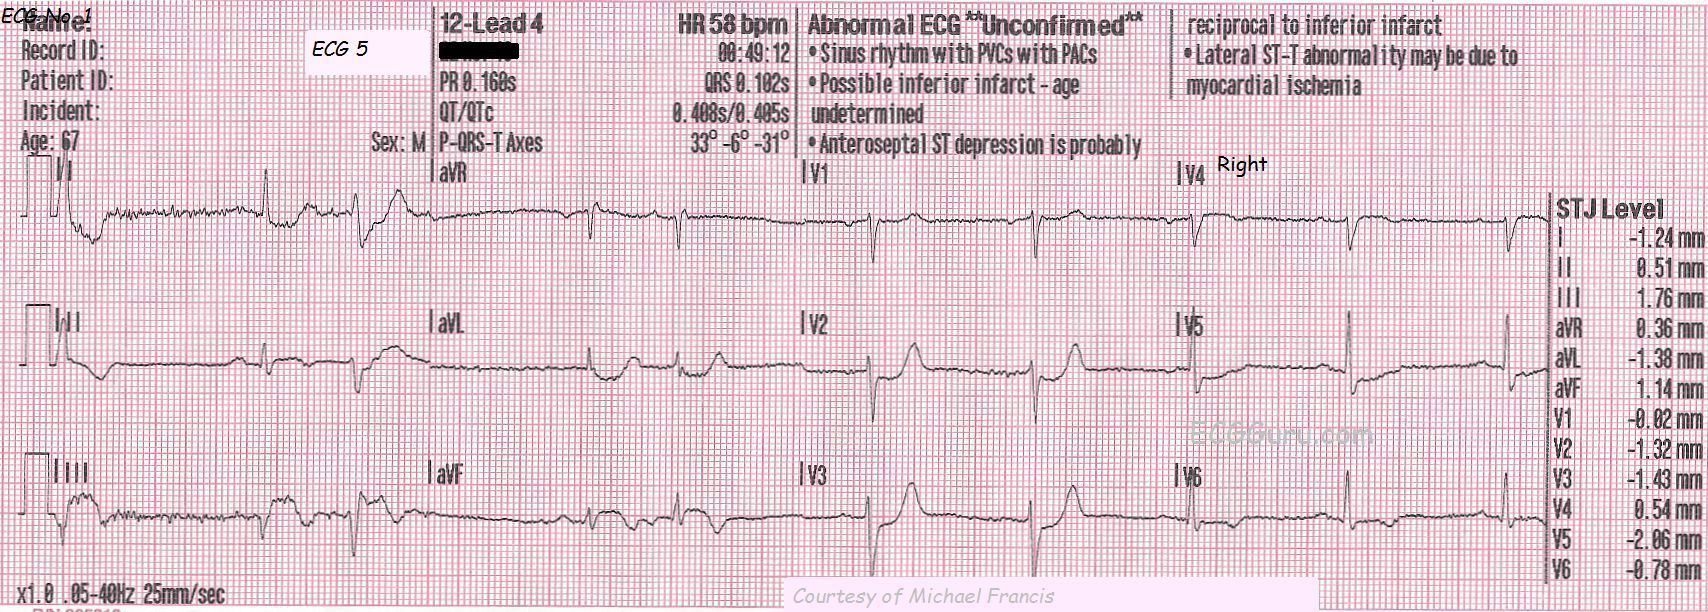
ECG No. 5, taken at 12:49 a.m., shows further development of the ST segments, and the classic "domed" shape of STEMI. In addition, a pathological Q wave has appeared in Lead III, possibly indicating permanent damage from this M.I. In this ECG, the paramedics have moved the V4 wire to the V4 Right position to better view the right ventricle. V4 Right is slightly elevated, and definitely dome-shaped, like a frown. This is an indication that the RV is injured, and medications that lower BP (especially nitroglycerin) should be avoided in the pre-hospital setting because of the danger of loss of preload of the RV and sudden drop in cardiac output. The patient's BP at this time was 138/85.
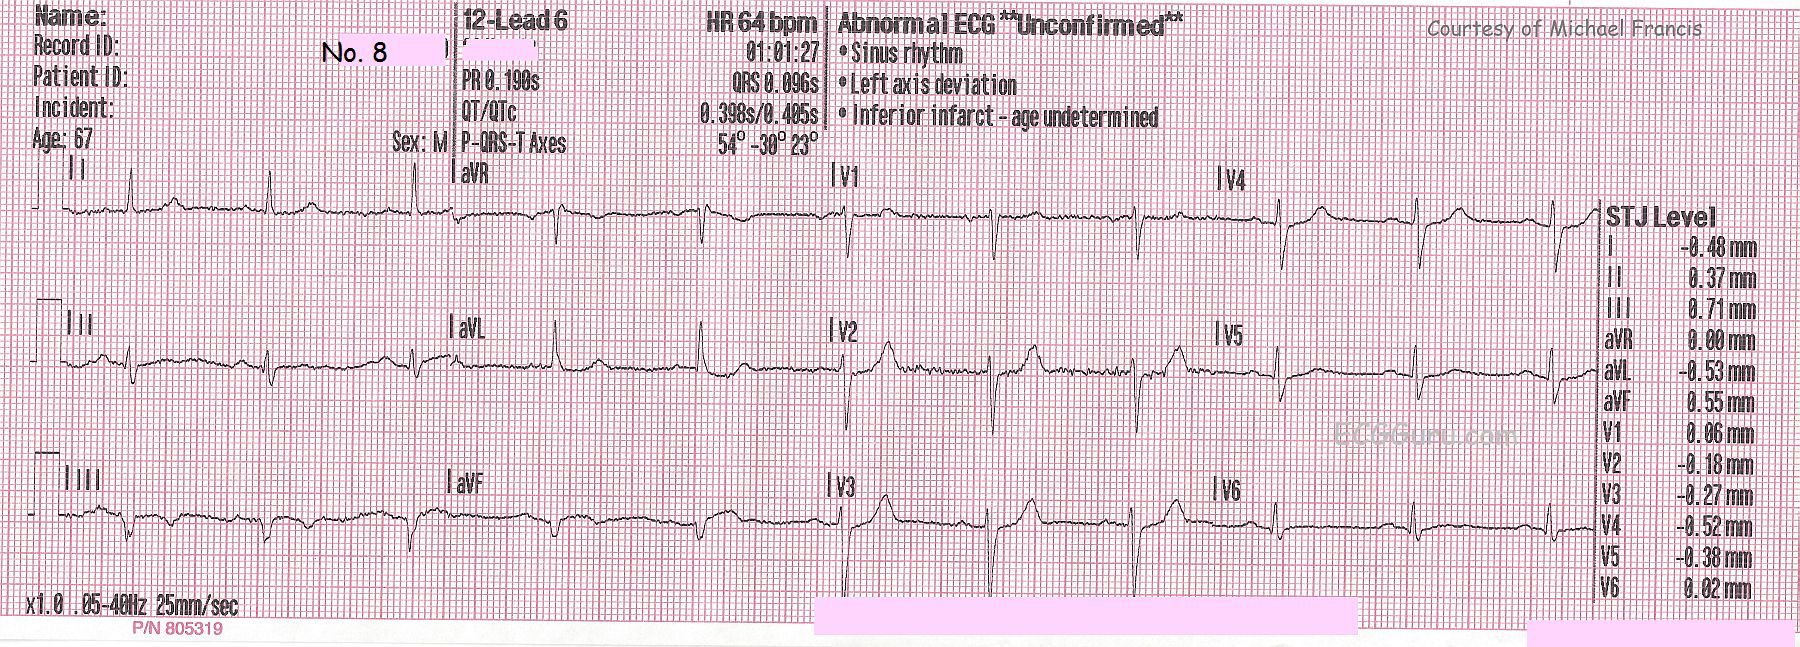
ECG No. 8, taken at 1:01 a.m., shows return of the ST segments to the baseline, but persistence of the abnormal domed shape. The T waves have inverted, and the Q waves are now pathological in Lead aVF and Lead III. This indicates evolution of the M.I. At this point, the patient states he is feeling better. He was turned over to the Emergency Department in this subjectively improved condition. The patient's BP at this time was 117/79.
The patient was lost to followup, except that the paramedics were notified that he continued to improve and was discharged home without cardiac catheterization. A rhythm strip from this patient is presented here in ECG Basics.
How can a patient go through the evolutionary changes of an M.I. in such a short time? And why would a recently-stented coronary artery behave this way? First, some lesions are unstable and cause partial occlusions. If the plaque or clot move, or if the artery constricts, ECG signs of complete occlusion can appear. They can disappear if spontaneous re-perfusion occurs. Secondly, stents can fail and become occluded, even with today's modern anticoagulant and anti-scarring drugs. Also, we do not know which artery was repaired earlier in the week. This M.I. appears to be caused by a culprit lesion in the right coronary artery.
We welcome comments from all ECG Guru members, and especially from the Interventional Cardiologists out there who might want to expand on that last paragraph!
Rate this content:
All our content is FREE & COPYRIGHT FREE for non-commercial use
Please be courteous and leave any watermark or author attribution on content you reproduce.
Comments
Conjecture
I can't do anything more than guess, but as you touch on in your discussion, I believe the last two ECG's show spontaneous reperfusion as opposed to evolving or "completed" infarction. My reasoning has almost entirely to do with the T-waves and ST-segments.
1 - The resolution of the patient's symptoms corresponds roughly with the appearance of T-wave inversions (ECG 5) and directly with loss of the ST-elevation (ECG 8).
2 - This case evolved way too fast to progress from the injury pattern of STEMI to the inverted T-waves and isoelectric J-point of a completed infarct. Even if the coved ST-segments in ECG 5 were due to evolving STEMI, the J-point should remain elevated for several hours to days as opposed to minutes before returning to baseline (if ever). Such a rapid return of the J-point is much more suggestive of a reperfusion patten.
3 - The tall T-waves in V2 and V3 of ECG 5 are likely posterior reperfusion T-waves, as often described by Dr. Smith.
4 - Compared to ECG 5, ECG 8 is already starting to show rapid resolution of what I claim are reperfusion waves, with significantly less T-wave inversion in the inferior leads, shorter T-waves in the right precordials, and upright T-waves in V5/V6. Again, this is all happening way too fast for a true MI.
I can't account for the well-formed Q-waves in the inferior leads of the later ECG's except to point out that there was already what I believe to be an abnormal Q-wave in lead III of ECG 3. I might guess that the patient had Q-waves in aVF and III at baseline but the acute injury (STEMI) pattern of the first two ECG's also brought out some R-wave in those leads. Classically we think that STEMI diminishes or extinguishes R-wave height (especially anterior STEMI), but, and don't quote me on this, I think I've seen cases where the injury phase of inferior STEMI has resulted in increased amplitude of the R-wave in those leads, especially III. I'll see what I can drag up, but I'm pretty sure I'm not making up the phenomenon.
Vince D
http://www.medialapproach.com
Sequential ECGs - in Acute Infero-Postero-Lat STEMI
Very nice series of tracings - with excellent points made by Dawn. In particular I’d reemphasize the following:
HIGHLY insightful to have a sequential series of tracings like this!
P.S. As to VinceD’s excellent point about why a Q wave only in lead III - this could be the result of axis shift - or even of a CHANGE in the elevation of the bed! Slight change in angle of the bed can cause Q waves to come and go in a way that is hard to predict. Have you EVER seen ANYONE record the amount of degrees that a patient’s bed may have been elevated at the time the ECG is done? Some patients just can’t lie flat when acutely ill (esp. if a component of heart failure is present). Otherwise - it is possible that the Q in lead III does reflect some necrosis from this event ...
Ken Grauer, MD www.kg-ekgpress.com [email protected]