Displaying 51 - 60 of 67
Dawn's picture

Stroke and ST Elevation

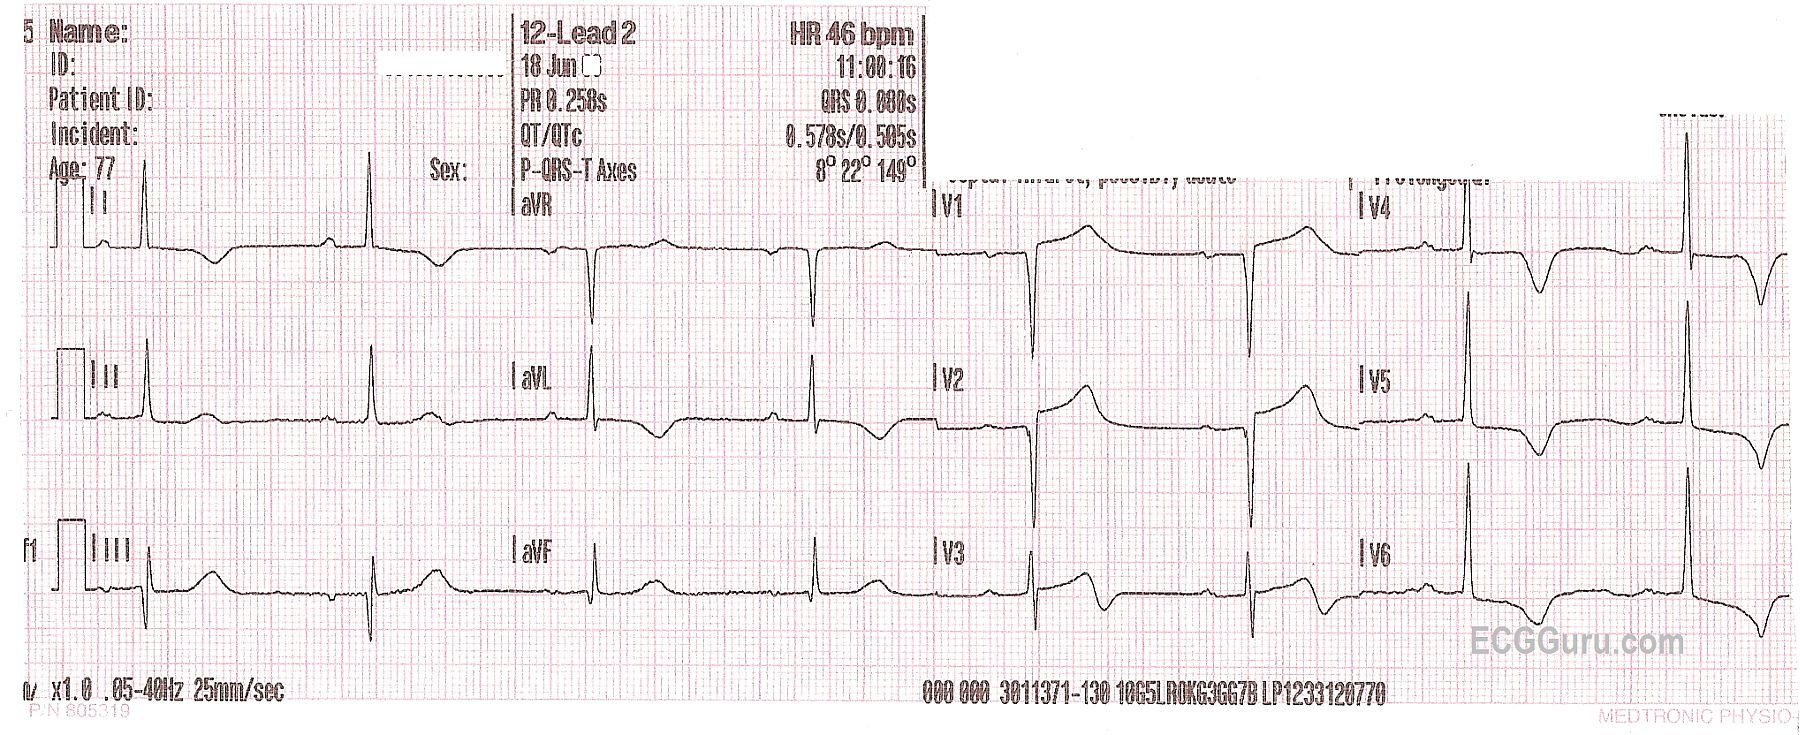
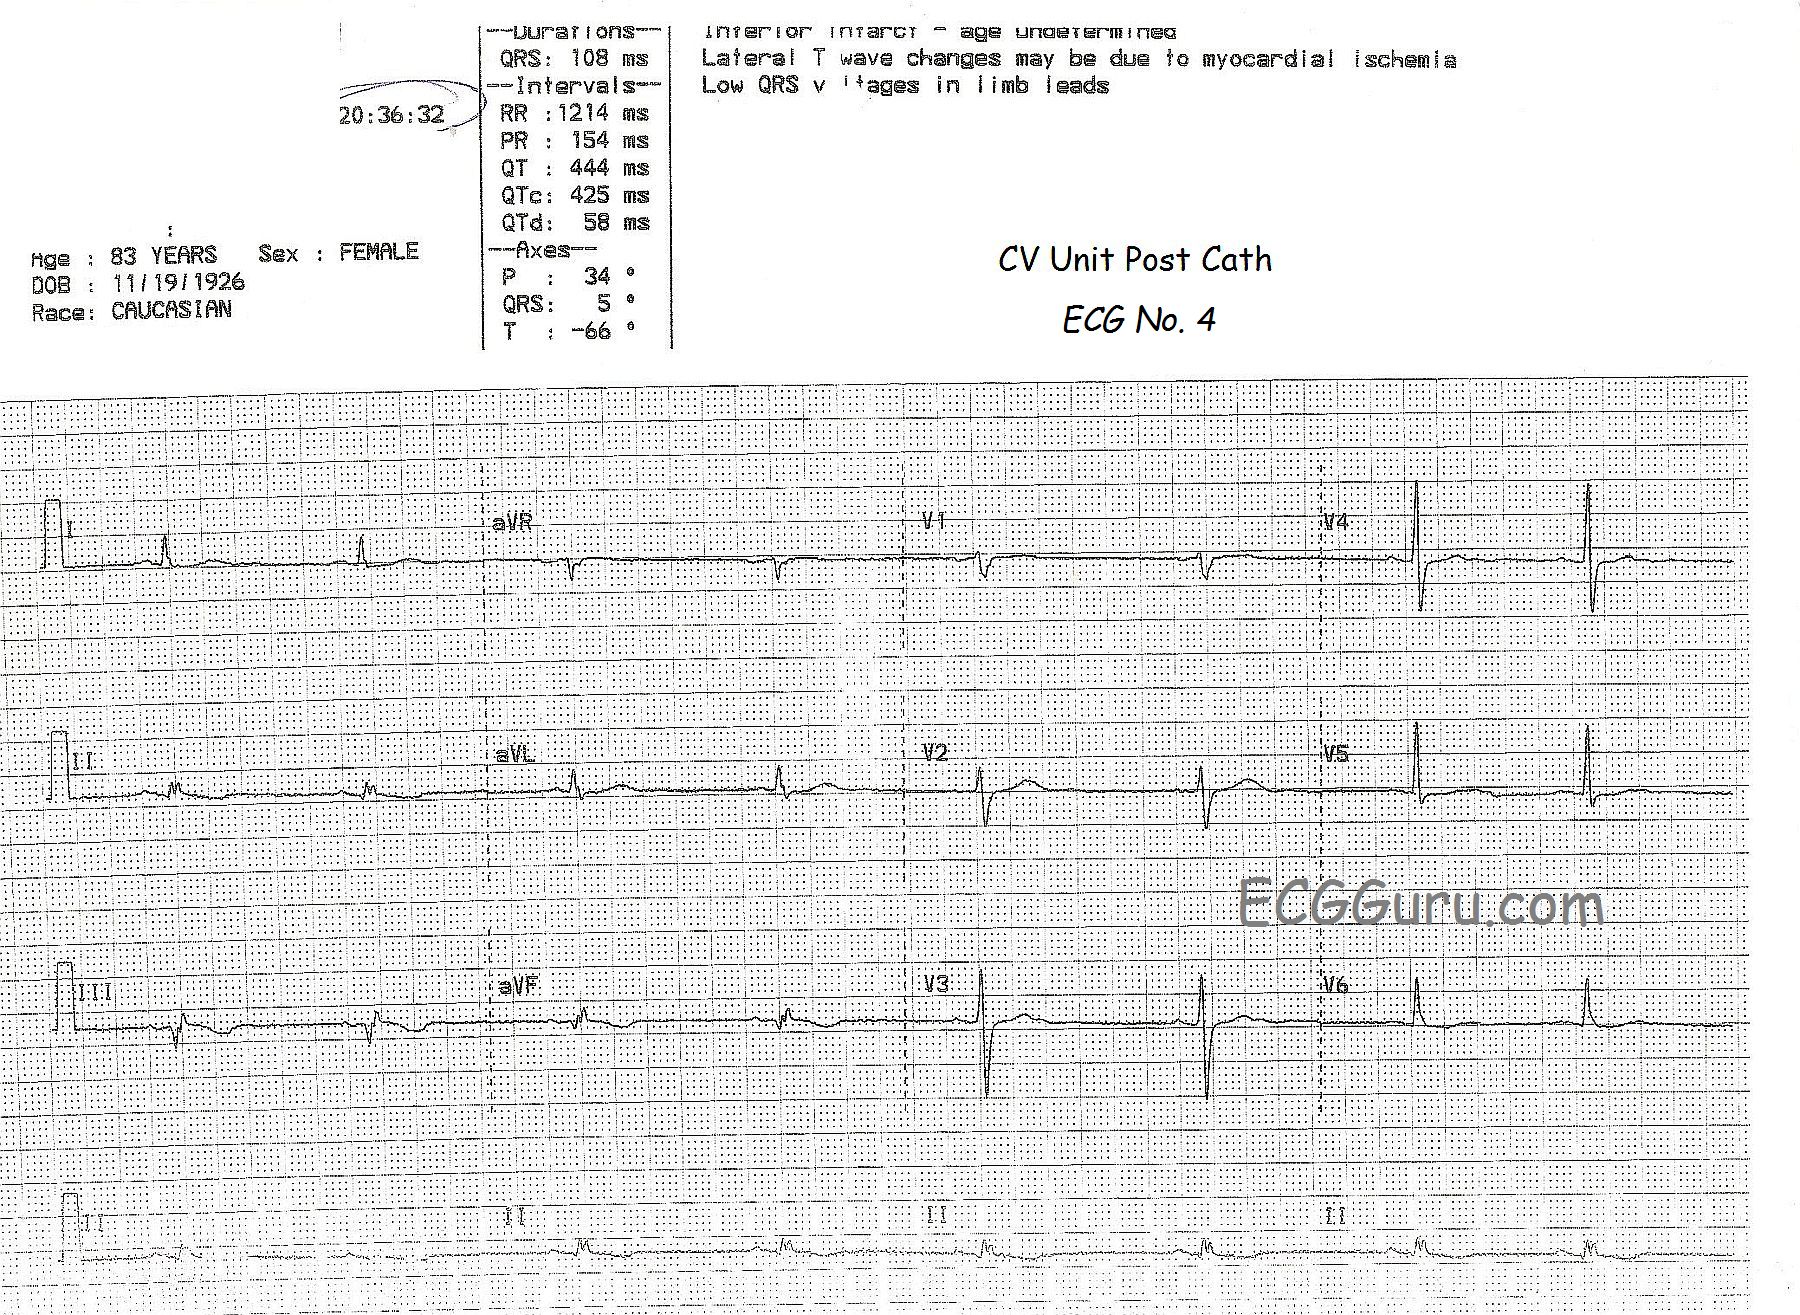
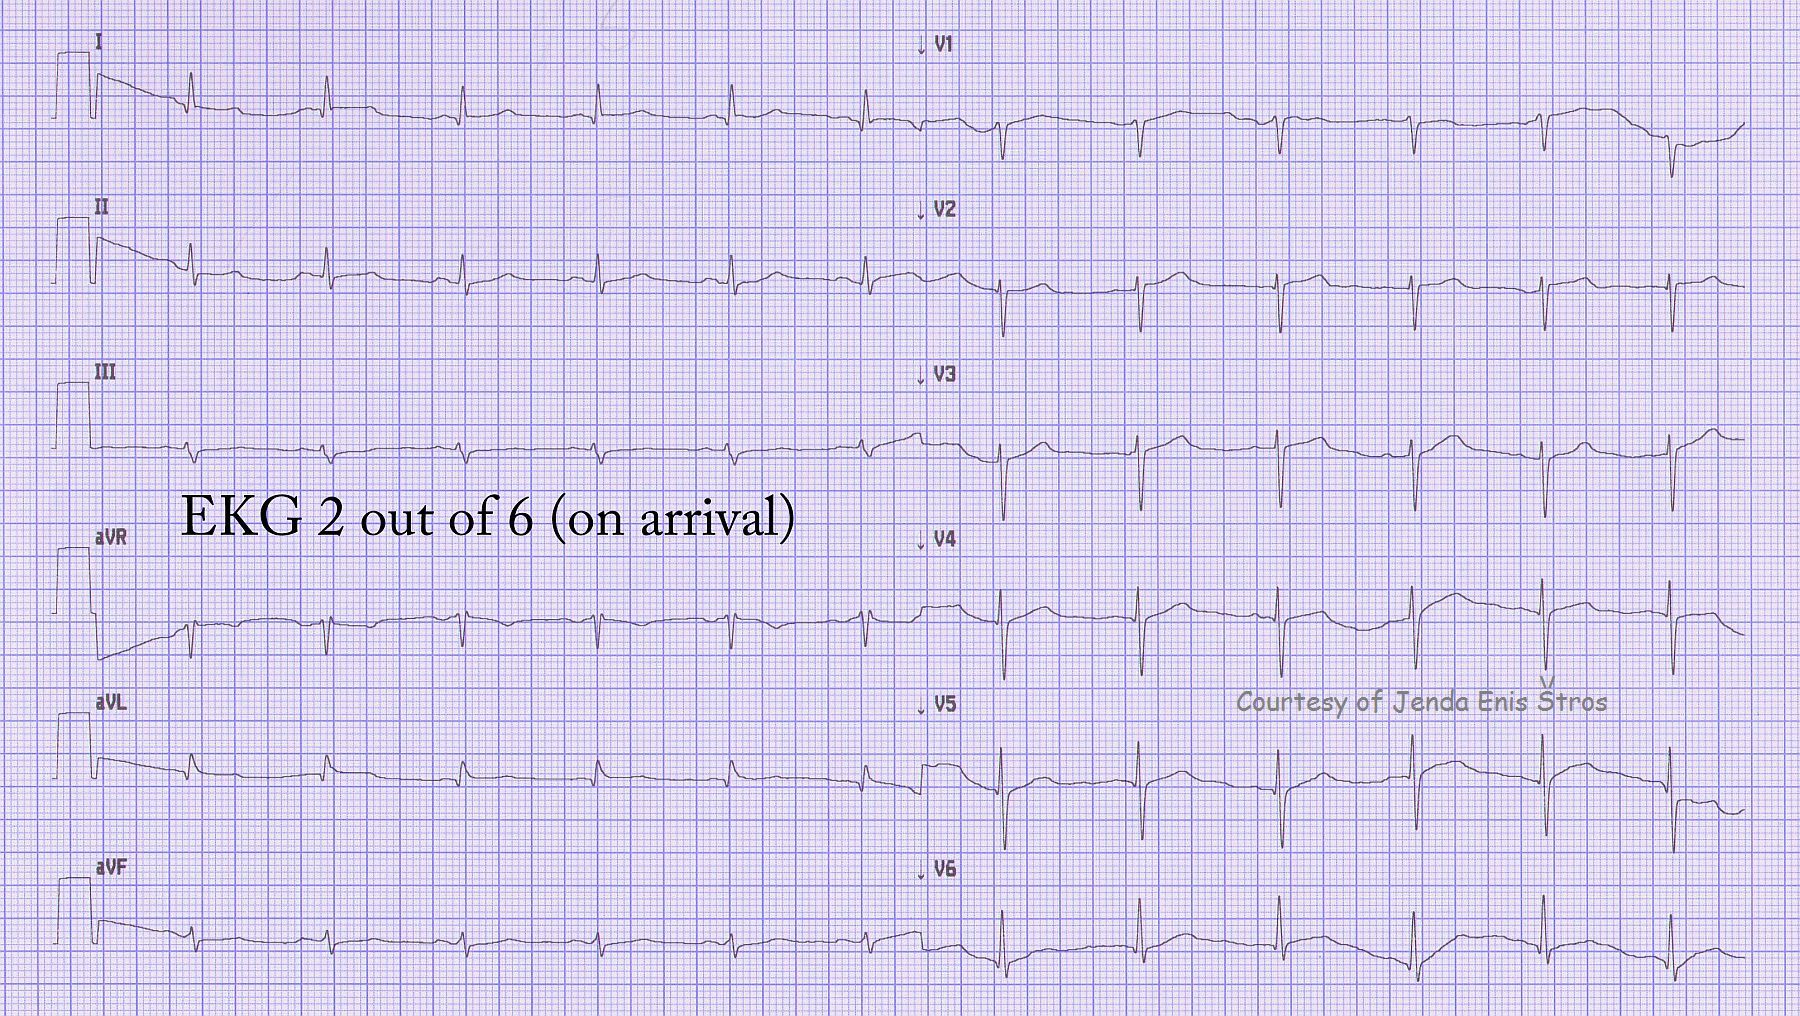
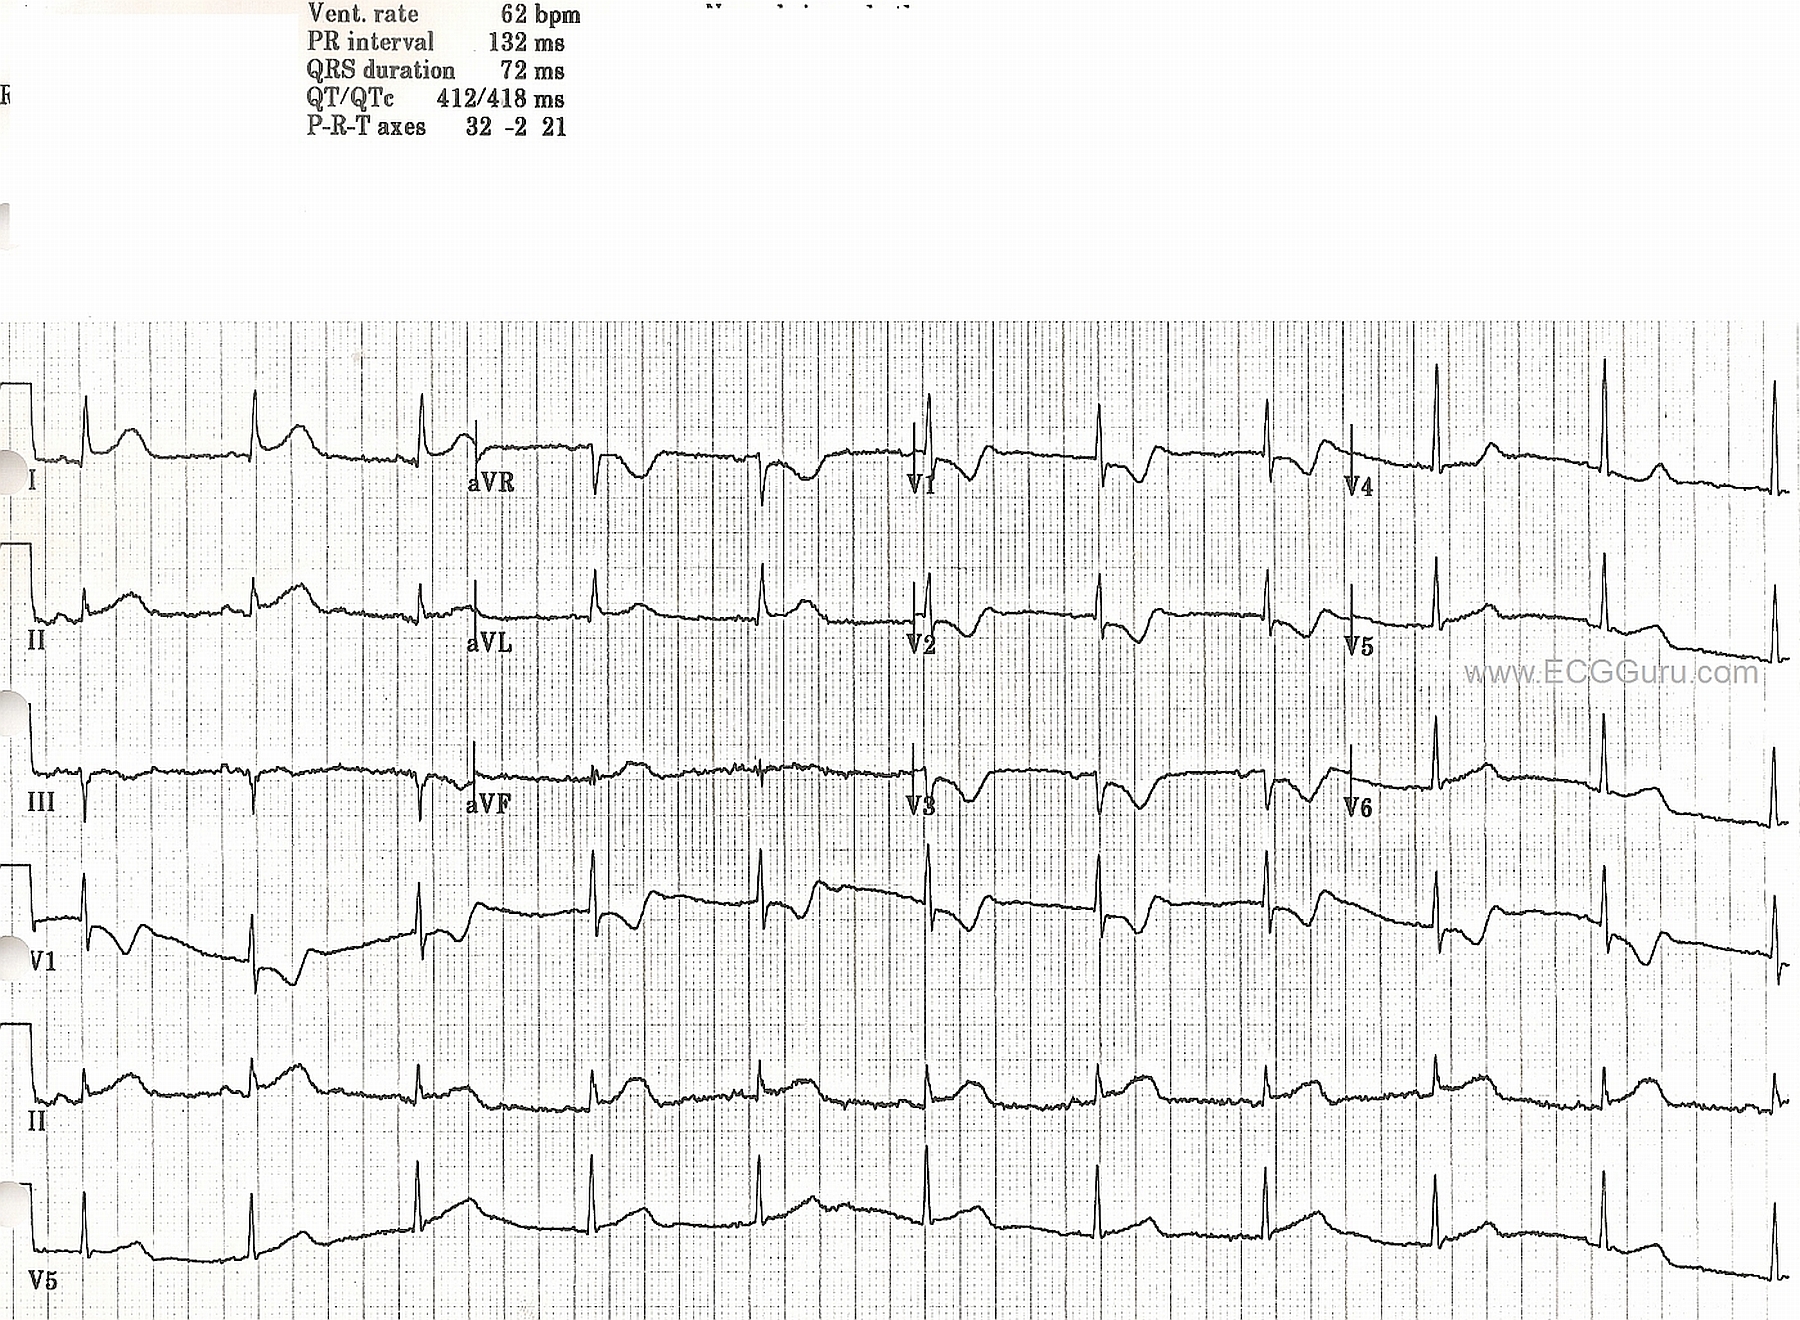
A 77-year-old man was brought to the Emergency Department with stroke symptoms.  He had less than one hour since symptom onset.  He presented with extreme weakness of his right side and slurred speech.   He has a history of coronary artery disease and previous acute M.I.  His BP was 188/80, P 46/min., and resp. 16/min.  He denies chest pain, N&V, and shortness of breath.  The E.D. physician called in the stroke team, and a diagnosis of CVA was made.   What does his ECG show?

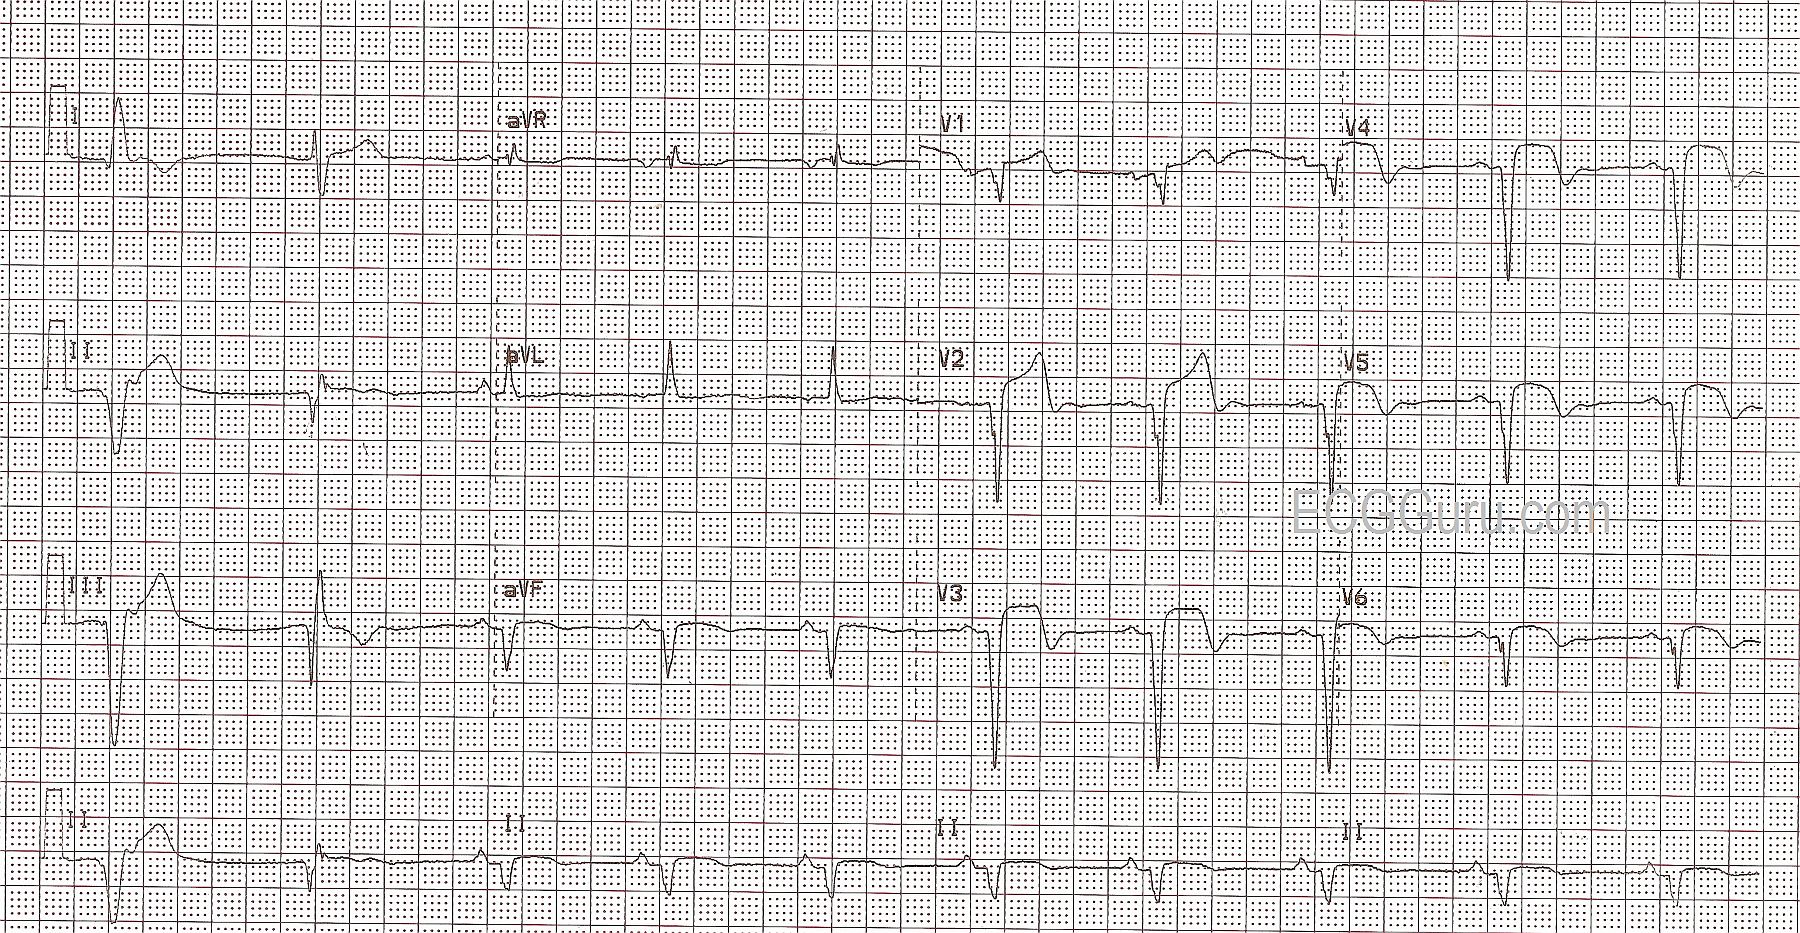
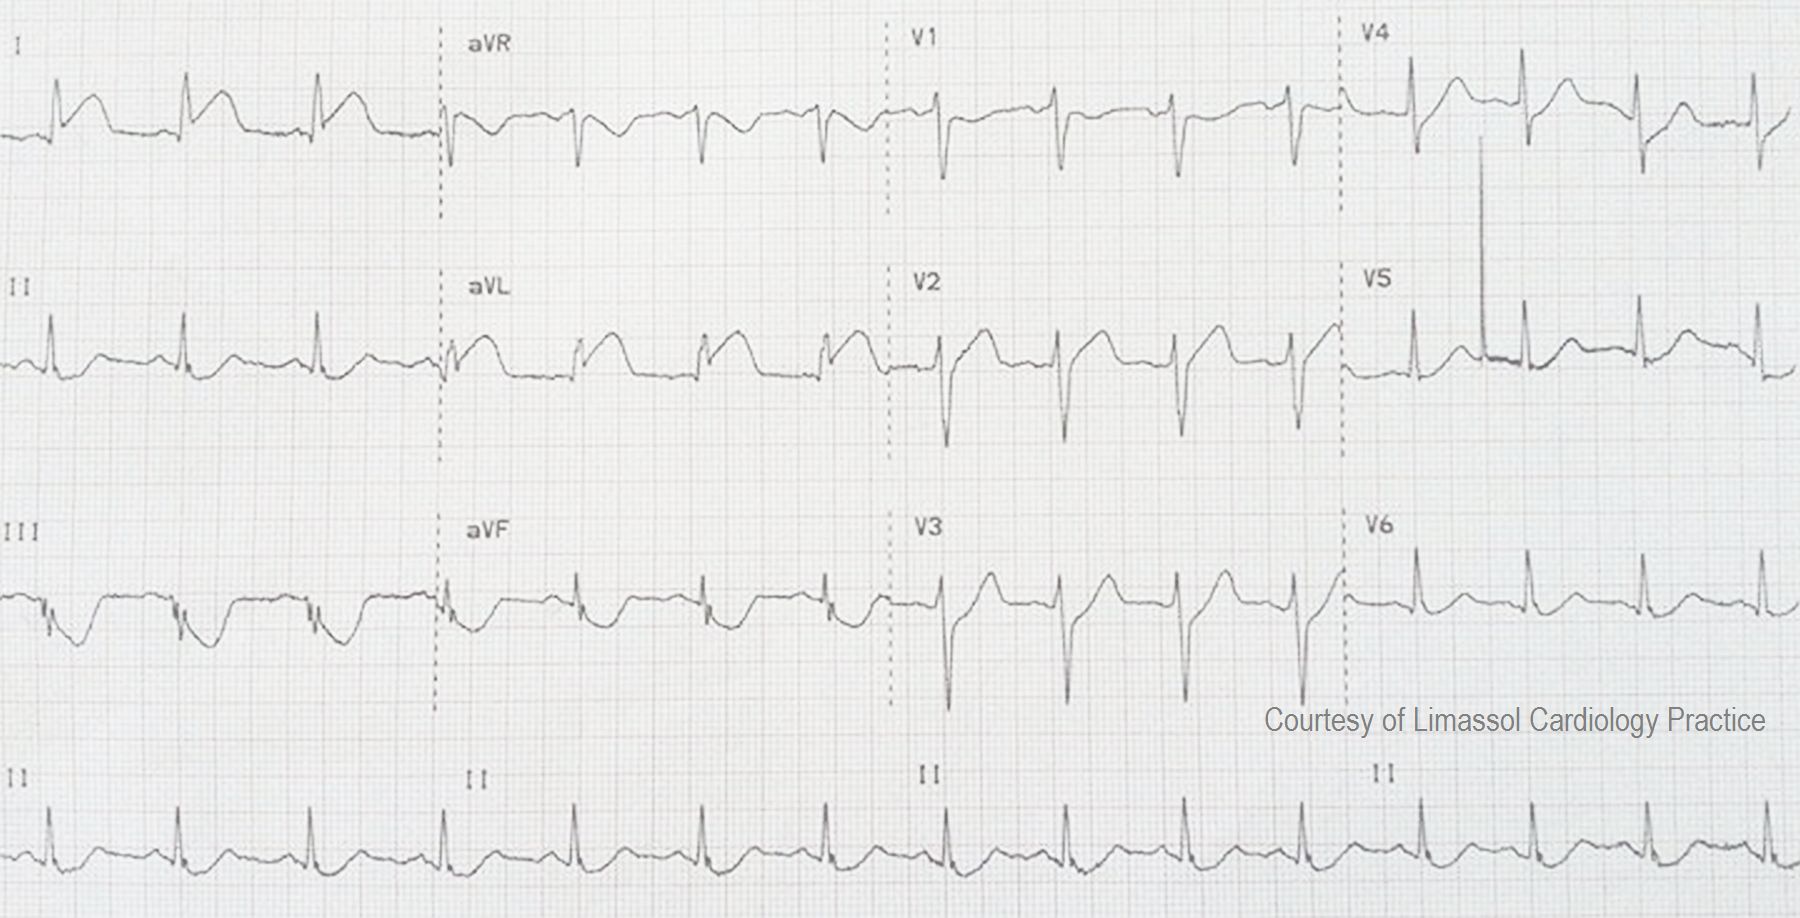
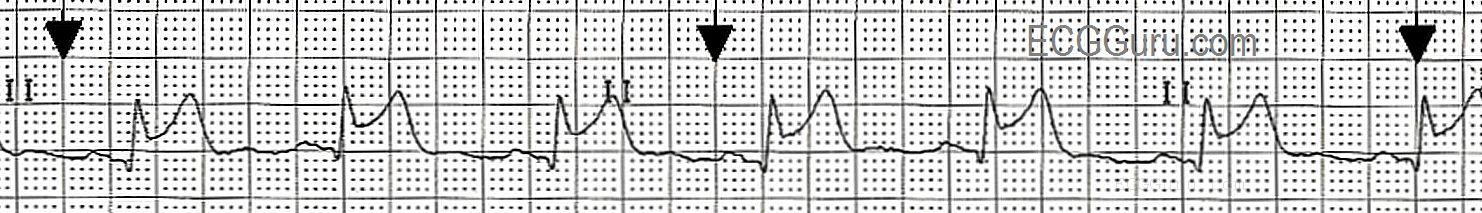
This ECG shows clear ST elevations in V1 and V2, with abnormally flat ST segments in nearly all leads.  In addition, there are ischemic T wave inversions in Leads V3, V4, V5, I, and aVL.   A diagnosis of anterio-lateral M.I. is made in addition to stroke.

Ischemic changes, like ST elevation and T wave inversions have been demonstrated frequently in patients with strokes.  Stroke symptoms have also been recorded in patients who are having M.I.s.  Ischemic stroke has been shown to be a complication of acute myocardial infarction.  Hemorrhagic stroke can follow anticoagulation or thrombolysis.   Also, acute M.I. has been shown to be a complication of stroke. Artery disease is a common denominator in both conditions. 

Needless to say, this can be a very complex problem, and the patient with stroke symptoms requires a CT scan to rule out hemorrhage before the M.I. is treated with anticoagulants or thrombolytics. 

References:  MI After Stroke, The Heart.orgIncidence of Stroke After Acute M.I., Witt, et al ; Ischemic Stroke After Acute Myocardial Infarction, Mooe, et al.


Dawn's picture

Teaching Tips: ECG Series WO 118: STEMI With Changing ST Elevations

Continuing with our theme of using  series of ECGs for teaching, we present the case of an 83-year-old woman with weakness, chest pain, and near-syncope.  The first ECG, taken by paramedics at her home, shows a sinus rhythm with a slightly wide QRS complex.  At this point, it is unclear whether this represents left bundle branch block or a non-specific interventricular conduction delay. There is the most subtle ST elevation in Leads III and aVF. In LBBB without acute M.I., we would expect the ST segments to be discordant, or opposite, the QRS complexes.   Even more informative is the reciprocal ST depression in Leads I and aVL (and a little in V2).  This can be a sign of inferior wall injury that shows up earlier than ST elevation in the inferior leads.

ECG number 2 was taken during transport to the hospital.  The chest pain continues, and now the ST elevation in the inferior leads is pronounced, and the reciprocal depression in I, aVL, and V2 has also become much more obvious.  V1 would also normally show this depression - a sign of the injury traveling up the back of the inferior wall (posterior).  But if the right ventricle is injured, V1 will have ST elevation.    V1 in this case is probably reflecting the depression from the posterior wall AND the elevation from the right ventricle.  The ST elevation is now prominent enough that the paramedics notified the hospital of a "STEMI Alert".  The QRS remains widened at .13 sec., but the ST elevations and depressions are not opposite the QRS direction, which would be typical for LBBB without an M.I.  Therefore, even if LBBB is present, these ST elevations and depressions would be considered a sign of STEMI.  The rate is slowing in this ECG.

ECG number 3 was taken in the Emergency Department.  The patient's symptoms continued.  The bradycardia is still present, as is the QRS widening.  Now, something new has shown up:  prominent U waves in the precordial leads.  There appears to be T-U fusion.  We do not know the patient's medications or lab results, so the most likely cause for the prominent U waves is the bradycardia.  She does not have other ECG signs of hypokalemia, which is one of the many causes of U waves. 

Dawn's picture

Teaching Series 1113: ECG 6 of 6 - Acute Anterior Wall M.I.

This ECG is the last in a series of 6 that were donated by Jenda Enis Štros showing the evolutionary changes of an M.I. from onset, through spontaneous reperfusion, angioplasty, re-occlusion by thrombus, and recovery.  This ECG shows deep precordial T wave inversions, an expected evolutionary change after reperfusion of an occluded artery - in this case, the left anterior descending.  The patient has lost some of his QRS amplitude (viable heart muscle), but has not developed pathological Q waves.  Pathological Q waves would indicate full-thickness necrosis of the wall, which is usually a permanent injury.  

The patient was discharged home with a 45% ejection fraction (60% is ideal), and he had akinesis of part of his anterior wall.  This can be permanent or temporary, and followup studies would be needed to evaluate the ongoing health and function of the left ventricle.

Here are links to all six ECGs from this series:

http://www.ecgguru.com/ecg/teaching-series-1113-ecg-1-6-acute-anterior-wall-mi

http://www.ecgguru.com/ecg/teaching-series-1113-ecg-2-6-acute-anterior-wall-mi

http://www.ecgguru.com/ecg/teaching-series-1113-ecg-3-6-acute-anterior-wall-mi

http://www.ecgguru.com/ecg/teaching-series-1113-ecg-4-6-acute-anterior-wall-mi

http://www.ecgguru.com/ecg/teaching-series-1113-ecg-5-6-acute-anterior-wall-mi


http://www.ecgguru.com/ecg/teaching-series-1113-ecg-6-6-acute-anterior-wall-mi


Dawn's picture

Teaching Series 1113: ECG 4 of 6 - Acute Anterior Wall M.I.

Continuing our teaching series of ECGs donated by Jenda Enis Štros, ECG 4 of 6 shows a new occurance of huge T wave inversions in the precordial leads.  Since this is the area that was stented (left anterior descending artery, anterior wall of the LV), we immediately should think of re-occlusion of the artery.  In a newly-placed stent, the danger is thrombosis (blood clot).  The patient had no chest pain at this time.

Here are links to all six of the ECGs in this series:

http://www.ecgguru.com/ecg/teaching-series-1113-ecg-1-6-acute-anterior-wall-mi

http://www.ecgguru.com/ecg/teaching-series-1113-ecg-2-6-acute-anterior-wall-mi

http://www.ecgguru.com/ecg/teaching-series-1113-ecg-3-6-acute-anterior-wall-mi

http://www.ecgguru.com/ecg/teaching-series-1113-ecg-4-6-acute-anterior-wall-mi

http://www.ecgguru.com/ecg/teaching-series-1113-ecg-5-6-acute-anterior-wall-mi 

http://www.ecgguru.com/ecg/teaching-series-1113-ecg-6-6-acute-anterior-wall-mi


Dawn's picture

Teaching Series 1113: ECG 3 of 6 - Acute Anterior Wall M.I.

This is ECG 3 in a series of 6 ECGs donated to the ECG Guru by Jenda Enis Štros. The left anterior descending artery occlusion has been confirmed in the cath lab, and angioplasty with stent placement has been performed.  Post-stent, there are T wave inversions in the precordial leads (V Leads), which is an evolutionary change during the recovery phase of acute ST elevation M.I. 

Here are the links to all six ECGs in this series:

http://www.ecgguru.com/ecg/teaching-series-1113-ecg-1-6-acute-anterior-wall-mi

http://www.ecgguru.com/ecg/teaching-series-1113-ecg-2-6-acute-anterior-wall-mi

http://www.ecgguru.com/ecg/teaching-series-1113-ecg-3-6-acute-anterior-wall-mi

http://www.ecgguru.com/ecg/teaching-series-1113-ecg-4-6-acute-anterior-wall-mi

http://www.ecgguru.com/ecg/teaching-series-1113-ecg-5-6-acute-anterior-wall-mi


http://www.ecgguru.com/ecg/teaching-series-1113-ecg-6-6-acute-anterior-wall-mi


Dawn's picture

Teaching Series 1113: ECG 2 of 6 - Acute Anterior Wall M.I.

To continue the series donated by Jenda Enis Štros, ECG 2 shows spontaneous resolution of the ST elevation, coinciding with relief of the patient's chest pain.  Spontaneous reperfusion can occur when the artery diameter is increased, the offending clot shifts position to allow blood flow, or other reasons.  This does not mean, however, that the lesion has disappeared.

Here are the links to all six of the ECGs in this series:

http://www.ecgguru.com/ecg/teaching-series-1113-ecg-1-6-acute-anterior-wall-mi

http://www.ecgguru.com/ecg/teaching-series-1113-ecg-2-6-acute-anterior-wall-mi

http://www.ecgguru.com/ecg/teaching-series-1113-ecg-3-6-acute-anterior-wall-mi

http://www.ecgguru.com/ecg/teaching-series-1113-ecg-4-6-acute-anterior-wall-mi

http://www.ecgguru.com/ecg/teaching-series-1113-ecg-5-6-acute-anterior-wall-mi


http://www.ecgguru.com/ecg/teaching-series-1113-ecg-6-6-acute-anterior-wall-mi


Dawn's picture

Anterior Wall M.I. With Previous Inferior Wall M.I.

This ECG illustrates an acute anterior wall M.I. in a patient with a previous history of inferior wall M.I.  The anterior wall M.I. can be seen in the classic signs in V1 through V6:  ST elevations with coved upward shape (tombstones), T waves inverting beginning around V2 and continuing through V6, and pathological Q waves in V1 through V6.

The patient had a history of previous inferior wall M.I., unknown age.  This is normally seen in Leads II, III, and aVF.  The first two complexes on the strip are wide QRS complexes without associated P waves, presumably ventricular.  It is impossible to know from this ECG whether the first complex is a PVC or escape beat, but the second appears to be escape.  So, to evaluate the ST segments, T waves, and pathological Q waves in the inferior wall, all we have are aVF and the Lead II rhythm strip at the bottom.  These show pathological Q waves (necrosis), and some slight elevation of ST, with coving or horizontal flattening.  From this, we know there is damage in the inferior wall, but the age of the M.I. is undetermined.

This patient went to the cath lab, and received angioplasty with stenting of the proximal left anterior descending branch of the left coronary artery.

Dawn's picture

Acute Lateral Wall M.I.

This week's ECG for your collection was kindly donated by Dr. Stasinos Theodorou, interventional cardiologist with the Limassol Cardiology Practice in Cyprus. It offers a wonderful teaching opportunity, and illustrates how valuable an ECG can be in locating a lesion during an M.I.   Dr. Theodorou previously posted this ECG and the angiograms from the same patient on FaceBook, and he has offered them to the users of the ECG Guru website  free of copyright.

Dr. Theodorou reports that the culprit lesion in this M.I. was initially very difficult to find on angiogram.  In this case the culprit was an ostially occluded second diagonal artery which, due to the anatomy, was almost impossible to spot from the initial diagnostic images.  There was no "stump" because the occlusion was in the ostium - the beginning of the artery.  The patient also had a significant right coronary artery lesion, but it was not the cause of the M.I. because the RCA perfuses the right ventricle and inferior/posterior wall of the left ventricle.  The ST elevation in this ECG is in I and aVL - the area of the high lateral wall.  Because the  ECG appeared to be inconsistent with the angiogram, Dr. Theodorou obtained further projections, allowing him to identify and treat the offending lesion.  This illustrates the importance of the ECG in locating coronary artery lesions, even in this age of high technology and cath labs.  The interventional cardiologist's proficiency in ECG interpretation enabled him to find this "invisible" lesion.

We are grateful to Dr. Theodorou for sharing this valuable learning experience with us.  You can find more from Dr. Theodorou on his website, FaceBook page, and here, on our "Ask the Expert" page.


Dawn's picture

ECG Basics: Normal Sinus Rhythm With ST Segment Elevation

This Lead II rhythm strip was taken from a 12-Lead ECG performed on a 66-year-old man who was having an acute inferior wall M.I.  The rhythm is normal sinus rhythm at 65 bpm.  The QRS complex is slightly wide at 112 ms (.11 seconds).  The patient did not have a bundle branch block pattern on his 12-lead ECG.  The PR interval is .17 seconds, and the P waves are widened and have a "double peak".  This can be a sign of left-sided heart failure, and is called P Mitrale.  Your students should be advised not to try to diagnose acute M.I. from a monitor strip, as ST segments can be inaccurate on some types of monitors.  However, any derangement of the ST segment on a monitor strip calls for an immediate 12-Lead ECG for confirmation.

Dawn's picture

Acute Posterior-Lateral M.I.

This ECG is from old files, and no patient information is available.  Acute ST elevation is apparent in lateral leads I and aVL, and in Lead II.  In addition, the anterior leads V1, V2, and V3 show reciprocal ST depression and, in V1 and V2, taller-than-normal R waves.  This points to acute posterior - lateral M.I., probably due to occlusion of the circumflex artery. Unfortunately, we do not have angiogram confirmation for this.

The P waves are interesting.  They are hard to see because of their small size and the fine baseline artifact present.  The best view appears to be in the Lead II rhythm strip at the bottom.  In this view, the P waves' morphology appears to be changing.  What do you think?


Pages

All our content is FREE & COPYRIGHT FREE for non-commercial use

Please be courteous and leave any watermark or author attribution on content you reproduce.