
Submitted by jer5150 on Sat, 06/16/2012 - 22:00
This week’s ECG is categorized under the heading:“Tracing suggestive of ” This is a classical example of this pair of derangements.
Patient's clinical data: 46-year-old white man who presented to the emergency department. Co-morbidities include a history of hypertension, CHF, CAD, Type II DM, and diabetic nephropathy in addition to one other major problem.
Questions: What combination of effects are present and what chronic problem are they both typically associated with? What clinical procedure has this patient been routinely undergoing and now needs to have STAT?
Rate this content:
-

- jer5150's blog
- Log in or register to post comments
All our content is FREE & COPYRIGHT FREE for non-commercial use
Please be courteous and leave any watermark or author attribution on content you reproduce.
Comments
Hyperacute T wave.
Sinus bradycardia 40p/m,RAD(LPHB)'ST depression in inferior leads,STelevation v1.2,avr,QTc49msec,tall astral T wave in chest leads and biphasic in v1. DD : 1 - ACS. 2- hyperkalemia.need plasma klevel.
Imad
renal failure
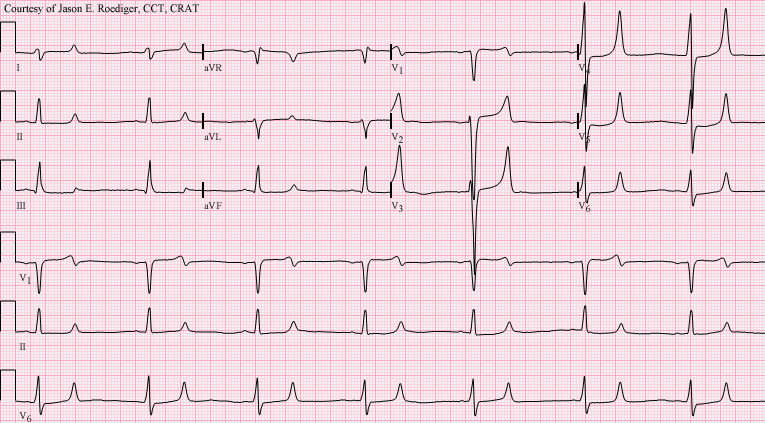
Sinus brady, rate approx 43. Tall peaked T waves, slightly widened QRS, and flattened P waves suggest HyperK. The flat, slightly prolonged QT segment suggest Hypocalcemia. Both of these are present in acute renal failure. Pt has been undergoing routine dialysis, and needs it urgently now.
INTERPRETATION
There really didn’t seem to be much of a need for me to moderate this past week’s ECG. There were only two responders and neither one posted any questions however they both made some good observations. Imad was the first to respond as well as being the first to hint towards the hyperkalemia, but it was really DaveB who located all of the features and details I was looking for someone to spot and neatly summarized them in his comments.When I first laid eyes on this “unknown” ECG, the very first thought that popped into my head was: “I bet this patient was hyperkalemic and hypocalcemic due to renal failure”. After researching the pathology and etiology, that’s exactly what turned out to be the case here. This is one of those types of ECGs that is rather eye-catching once you recognize what to look for and to the best of my knowledge, it has no known imitator or mimic. The ST-T pattern is a strong indicator of these combined electrolyte effects and heavily favors chronic renal disease.
The title of this week’s blog was obviously a play on words. Aside from the reference to the electrolyte imbalance, I was also referring to a couple of other relative highs and lows that typically go hand and hand with chronic renal failure.
Three “highs”: 1.) T-wave voltage, 2.) blood pressure, and 3.) serum potassium level.
Three “lows”: 1.) Sinus rate, 2.) P-wave voltage, and 3.) serum calcium level.
The computer originally interpreted this ECG as:
Junctional bradycardia (no value was calculated for a P-R interval)
Rightward axis
Nonspecific intraventricular block
Abnormal ECG
The overreading cardiology fellow, who reviewed and confirmed this ECG, replaced the top statement of junctional bradycardia with his own. To the computer’s original statement, he added his freehand text in all uppercase letters.
SINUS BRADYCARDIA. OCCASIONAL PACS
Rightward axis
Nonspecific intraventricular block
Abnormal ECG
The computer didn’t make the right call nor did the fellow get it entirely correct. Inexplicably, the fellow included the statement of occasional PACs yet I’m not really sure where he thought he was seeing them since the rhythm is absolutely and precisely regular without even so much as a hint of early beats. Perhaps he glanced at the sinus beats in the precordial leads and mistook the monumental height of the T-waves to be some sort of an extrasystole. More human mistakes are made that way when attention to detail is not heeded. Along those same lines, sometimes the computer will do what is called a “double-count” where it calculates the ventricular rate to be exactly twice what it actually is by factoring in the T-waves as separate beats. Other times it will consider the prominent T-waves to be PVCs and generate false-positive statements by calling this ventricular bigeminy.
The computer failed to recognize this as a markedly slow sinus bradycardia probably due to the fact that the sinus P-waves are of such low voltage. Typically, the higher the potassium level, the flatter the sinus P-wave becomes while simultaneously the duration of the QRS interval becomes wider. Here, the height of the P-waves in monitoring lead II is no more than 1mm at best and the QRS complex is 0.13s. It’s unknown what the patient’s blood pressure reading was as the time this ECG was performed.
The T waves associated with hyperkalemia are often referred to by a multitude of descriptors such as: tall, symmetrical, narrow-based, “thorn-like”, peaked, sharp, pointed, tented, and prominent. Some even refer to them as tombstone or hyperacute but you run the risk of confusing others because both of these are also used by certain authors to describe T-waves in the presence of acute myocardial infarction. Of various descriptors, I probably like the 2nd of “Taigman’s T-wave Rules” the most.
Rule 2: “If the T-waves look like they would hurt your butt if you sat on them, the patient is probably hyperkalemic.” (1) Most of those precordial T-waves do indeed look like they would be very painful to perch your hindquarters upon.
Whenever you encounter a prolonged QT interval, one of the first potential culprits you should suspect is hypocalcemia barring any antiarrhythmic drug toxicity of course. Prolongation of the QT interval as a result of ST segment prolongation suggests hypocalcemia.
The blood lab results of these two electrolytes came back in the patient’s computer record as so-called “panic values” and were flagged with an asterisk (*).
Serum potassium level (here K+ = 7.4* mmol/L). Normal range = 3.5 - 5.1
serum calcium level (here Ca++ = 6.4* mm/dL). Normal range = 8.5 - 10.1
This patient is in need of emergent dialysis to decrease their potassium while simultaneously repleting their calcium.
Incidentally, around the time this diabetic patient’s ECG was recorded their glucose level came back as 1836*. Normal range = 74 - 106.
INTERPRETATION.
1. Sinus bradycardia (rate = 41/min) with combined effects of both . . .
2. . . . hyperkalemia and . . .
3. . . . hypocalcemia in a patient with renal failure.
4. Right axis deviation (RAD) at 98-degrees.
While I wouldn’t necessarily say that the overall QT interval is disproportionately long for this bradycardic rate, I would say that the duration of the ST segment is contributing a disproportionate amount to the QT interval when compared to the T-wave’s contribution. In other words, the bulk of the long QT is comprised of a much prolonged ST segment.
I would not attribute the right axis deviation (RAD) to left posterior hemiblock (LPHB). LPHB is rarely observed in isolation and is almost always seen in association with RBBB which is not the case seen here.
This patient went on to live for a few more years but subsequently died from complications associated with their end-stage renal failure.
References / Sources:
1.) Taigman, M., Canan, S., Miller, C. Taigman’s Advanced Cardiology (In Plain English). Englewood Cliffs: Brady, 1995, p. 27
2.) Marriott HJL. Challenging ECGs. Philadelphia: Hanley & Belfus, 2002, p. 430 - 431
3.) http://ekgumem.tumblr.com/post/21210434232/is-that-just-artifact-in-this-bradycardic-rhythm
4.) http://img.medscape.com/article/763/564/763564-figure-1.jpg
5.) http://ecg.bidmc.harvard.edu/mavendata/images/case26/800x400.gif
6.) http://img.medscape.com/fullsize/migrated/481/497/ecg_mc481497.fig.gif
7.) http://www.metealpaslan.com/ecg/000076-03.htm
8.) http://www.theheart.org/documents/sitestructure/en/content/survey/1493409/images/slide1.jpg
Jason E. Roediger - Certified Cardiographic Technician (CCT)
[email protected]