Displaying 21 - 26 of 26
Dawn's picture

Anterior Wall M.I.

This ECG was obtained from an elderly man who was complaining of acute-onset chest pain, radiating down his left arm.  He also complained of a cough, and had audible rhonchi.  The machine interpretation gives several possible explanations for the widespread ST elevation noted on the ECG.  The paramedics were a bit distracted by the machine's interpretation, and by the respiratory symptoms, and decided not to call a "cardiac alert" on the patient.  They did, however, quickly transport him to the closest hospital, which happened to have full-service cardiac facilities.  The patient was diagnosed with an acute M.I. and treated with angioplasty in the cath lab, with a good outcome.  Afterward, the medics felt that they "overthought" this one, and should have given more weight to the patient's symptoms.  Teach your students to evaluate their experiences with open minds and unafraid of self-criticism, so they may learn from every patient.  This patient received excellent care, and the paramedics added to their "information banks", upon which they will draw for many years to come. 

Although the angiogram results are not available to us, it is plausible that a proximal occlusion of the LCA, near the bifurcation of the LAD and the diagonal, could cause ST elevation in V3 through V6, with mild elevation in Lead II (which is oriented to the leftward portion of the inferior wall), and ST and T changes in the high lateral leads (I and aVL). 


Dawn's picture

Left Main Coronary Artery Occlusion

This ECG was provided by Jamie Bisson, of E Advanced Healthcare.

The patient, in cardiogenic shock, was resuscitated in the Emergency Department, then sent to the cath lab, where his left main coronary artery was opened and stented.

Many people with complete occlusion of the left main do not survive. When there is some diminished blood flow through the blocked area in the proximal LAD or left main, this pattern may appear. Look for ST elevation in aVR greater than or equal to 1 mm, ST elevation in aVR greater than the ST elevation in V1, and widespread ST depression.   

In this ECG, aVR and V1 show ST segment elevation, with widespread ST depression. For years, aVR was virtually ignored in the literature, and considered to be only a reciprocal view of the lateral inferior wall. Now, there is convincing evidence of its usefulness in discovering proximal left coronary artery occlusion and severe triple vessel disease. ST elevation in aVR can be a reliable sign of ischemia of the basal part of the heart and the proximal IV septum.

Many people with complete occlusion of the left main do not survive. When there is diminished blood flow through the blocked area in the proximal LAD or left main, this pattern may appear. Look for ST elevation in aVR greater than or equal to 1 mm, ST elevation in aVR greater than the ST elevation in V1, and widespread ST depression.

For complete discussions on this topic, go to Life in the Fast Lane,

Dr. Smith's ECG Blog,

JACC


Dawn's picture

Anterior Wall M.I. With Bifascicular Block

This is a good example of acute anterior wall M.I., with ST elevation in V1 through V6, as well as in Leads I and aVL.  The extensive distribution of ST segment elevations across the anterior and high lateral walls indicates a proximal LAD artery occlusion.  In addition, this ECG shows right bundle branch block, with a QRS width of 144 ms (.14 sec.) and an rsR' pattern in V1. There is also a wide s wave in Lead I which is partly obscurred in V6 by the ST elevation.  The right axis deviation (98 degrees) suggests a left posterior fascicular block which, when coupled with the RBBB, is a bi-fascicular block.  P waves are difficult to see.  Do you think they are found at the end of the QRS complexes, representing a long first-degree AVB?  Look at leads V3 through V6 for clues.

Please feel free to add your comments below.  The more "gurus" the better.

A good ECG to teach your students that a patient facing a life-threatening emergency may have a "normal" rate and regular rhythm.  There is something in this ECG for beginners through advanced students.

Dawn's picture

Anterior Wall M.I. With Atrial Fibrillation

A good teaching ECG, showing clearly elevated ST segments in V1 through V4.  This patient had an LAD occlusion.  In addition, he has new-onset atrial fib at a rate of about 120/min.  Atrial fib has decreased cardiac output because of the loss of P waves prior to the QRS complexes, and a resultant decreased ventricular filling pressure.  In addition, this fast rate contributes to increased myocardial oxygen demand and damage.  An early priority, along with getting this patient to PCI, is slowing the rate.

Dawn's picture

Left Ventricular Hypertrophy with Anterior Wall M.I.

This is a good ECG for demonstrating the voltage and ST criteria for LVH and acute anterior wall M.I. in the same patient, where both conditions have been confirmed by other tests.   If you are teaching the topics of ST elevation M.I., or left ventricular hypertrophy, you will probably have to address the issue that LVH can be considered a "mimic" for STEMI, especially for beginners.  This is because LVH causes ST depression in leads with upright QRS complexes, and reciprocal ST elevation in leads with negative QRS complexes.  This is called ST segment discordance.  The ST changes in LVH are due to the "strain" pattern, indicating strain on the left ventricular myocardium.  It is true that some ST elevation will appear in V1 and V2 in these patients, and can be mistaken for M.I.  In the ECG shown here, the patient has definite ST elevation in leads which would NORMALLY have depression in the LVH strain pattern.  Leads V1 through V4 have ST elevation that is not discordant, and is definitely real.  This patient was taken to the cath lab, and his left anterior descending artery stented.

Dawn's picture

AWMI With Recent IWMI

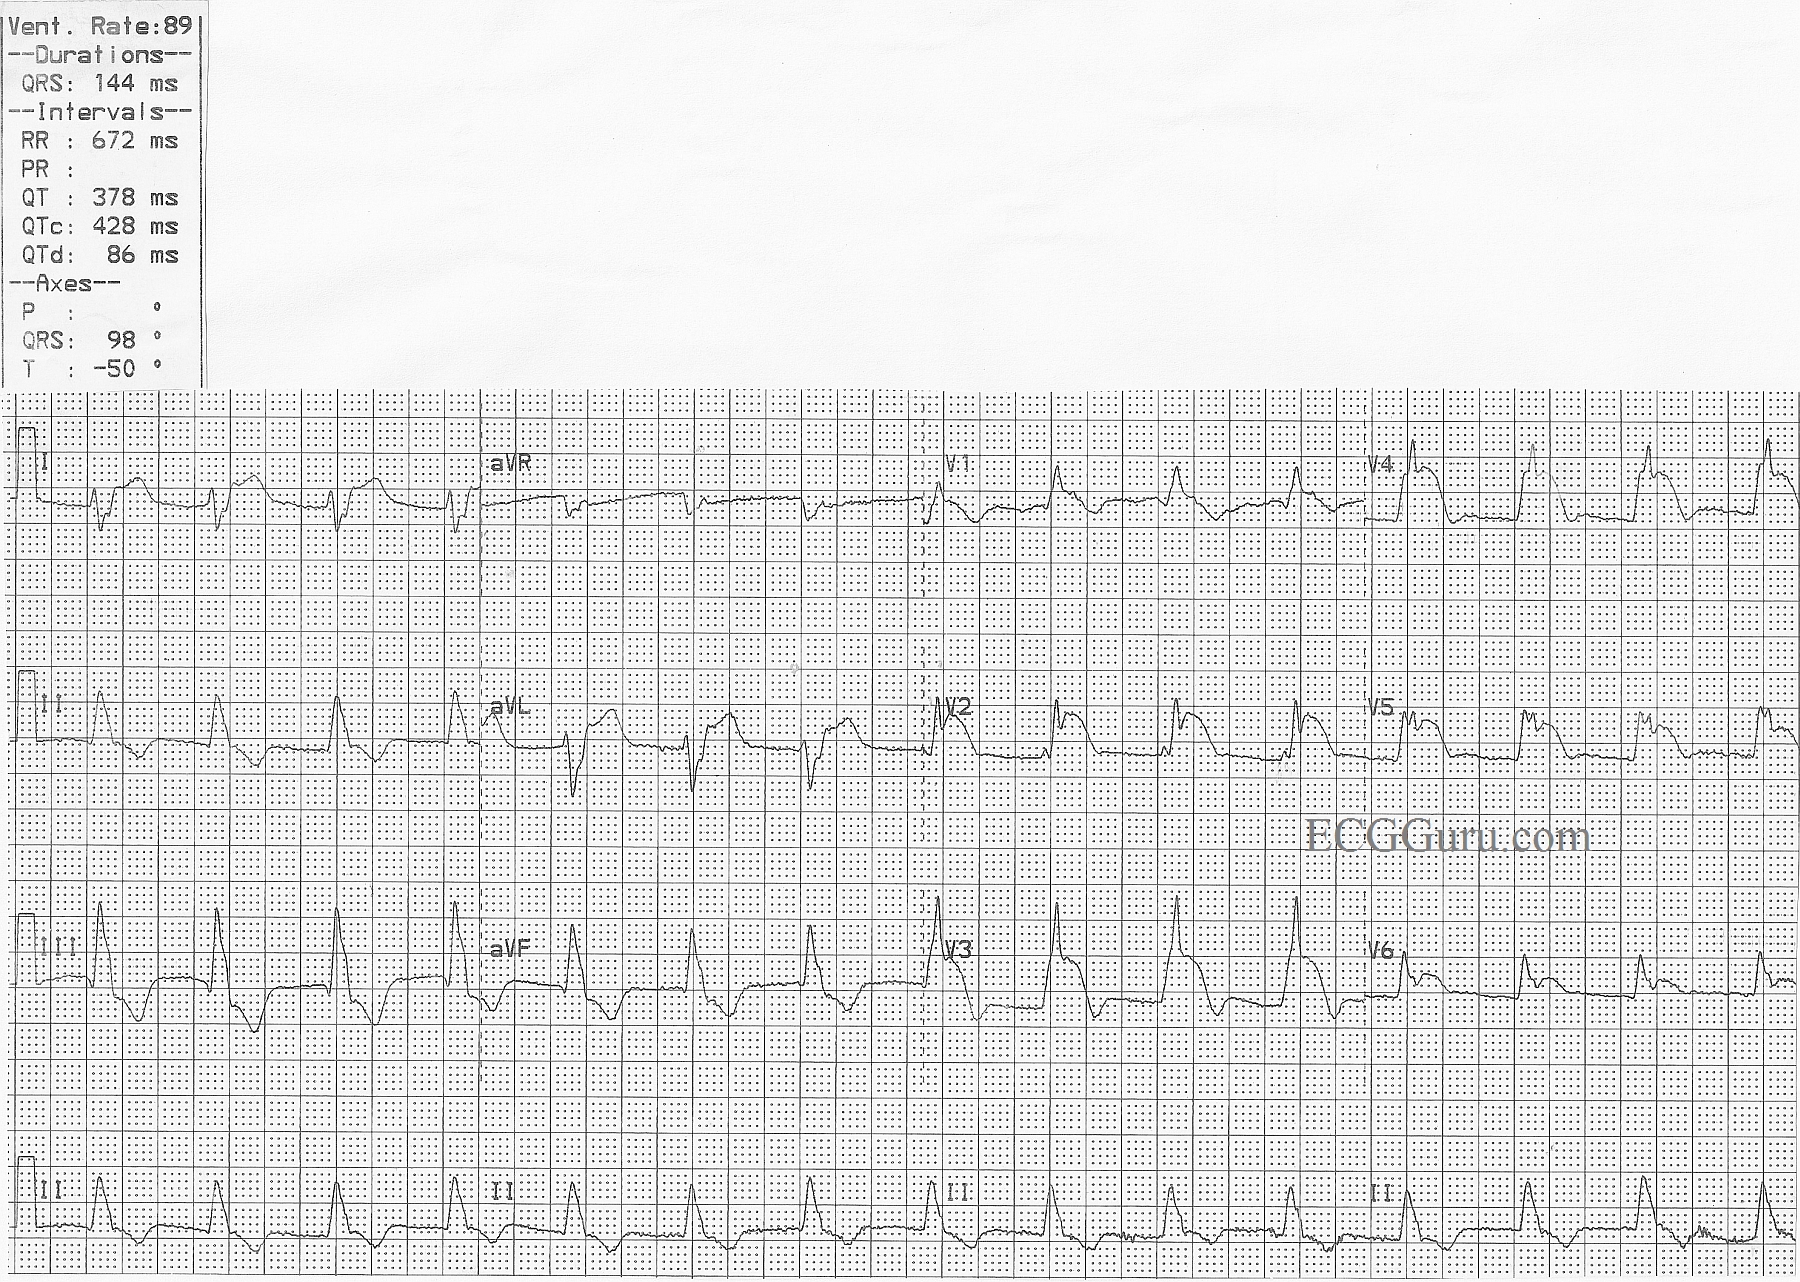
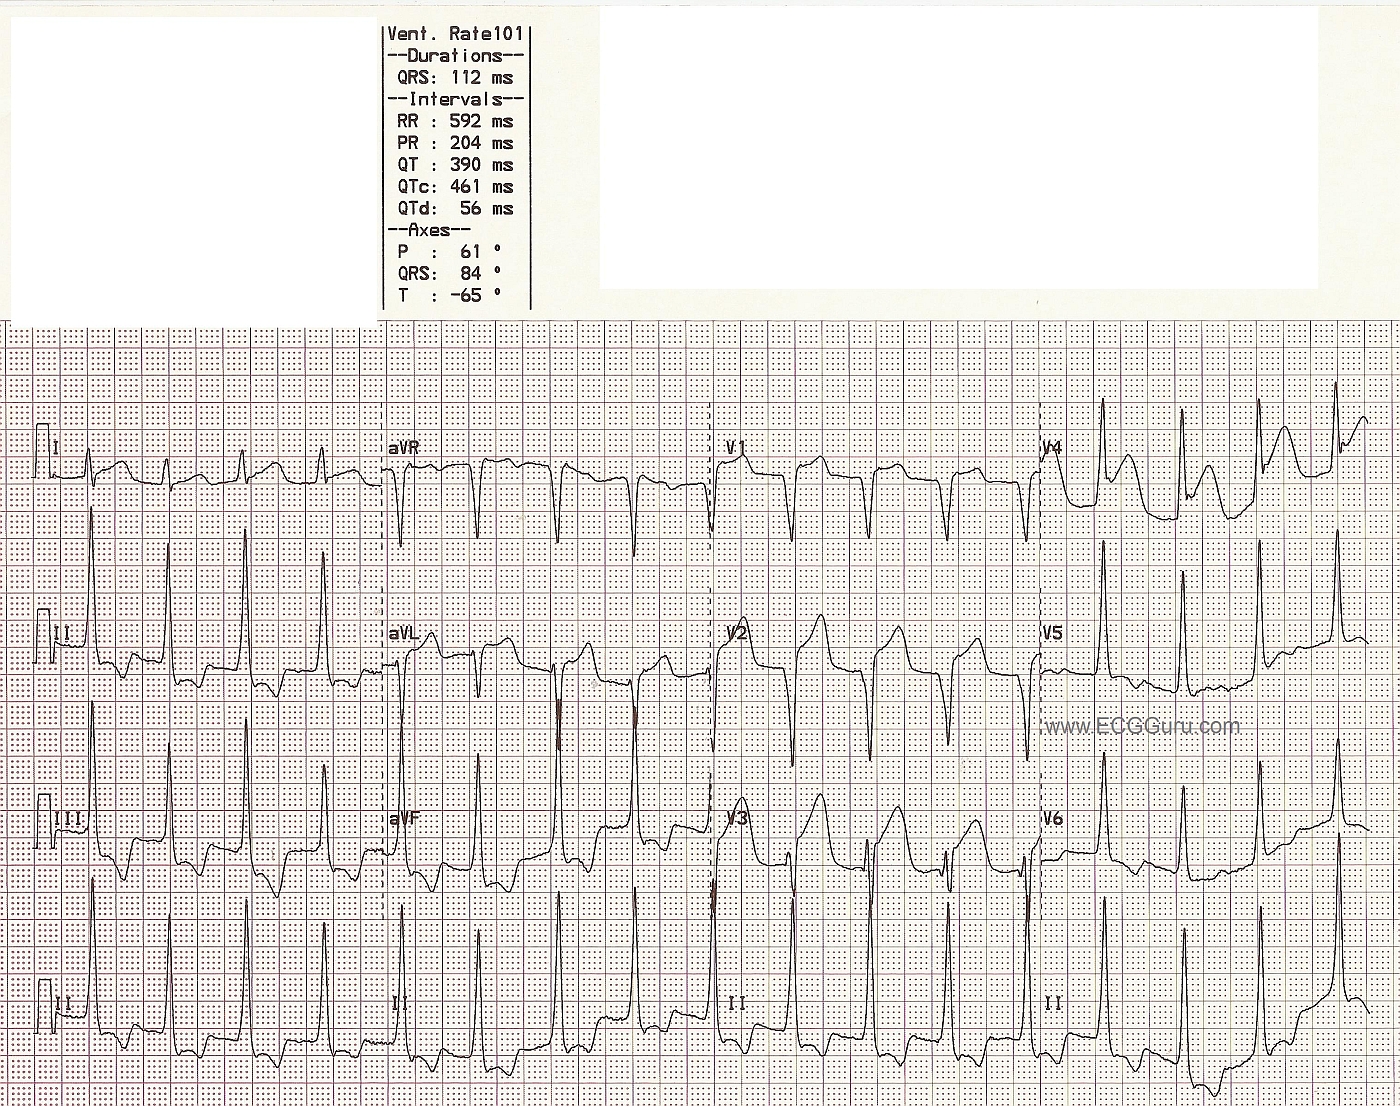
Patient AW103: This 88 year old woman had been sick for several days, but had not sought treatment. Her family found her nearly unresponsive and called 911. She presented to the Emergency Department as a STEMI Alert, and was in cardiogenic shock, with very poor perfusion. The ECG from the ED shows a large antero-lateral M.I., with ST elevation in V2 through V6, and also I and aVL. In addition, there are pathological Q waves, indicating necrosis, in the precordial leads, V2 through V6. The inferior wall leads, II, III, and aVF, also have pathological Q waves and abnormally shaped ST segments - no longer distinctly elevated, but coved upward.

This is a good tracing to teach students about Q waves and "old", "new", and "recent" M.I., and also about the clinical effects of hypokinesis or akinesis of the ventricles.

Unfortunately, this patient suffered a cardiac arrest in the cath lab while having her LCA reperfused with balloon angioplasty. She was resuscitated, on a ventilator and intraaortic balloon pump, and admitted to the CVICU, where she passed away within a few hours.

You will find photos from her cardiac cath in the Other Instructor Resources section, labelled as patient AW103. Click here for RCA Image, LCA Occluded Image, LCA Angioplasty Image.  Videos of her ventriculogram and left coronary artery angiogram can be found in the Resources section of this website.
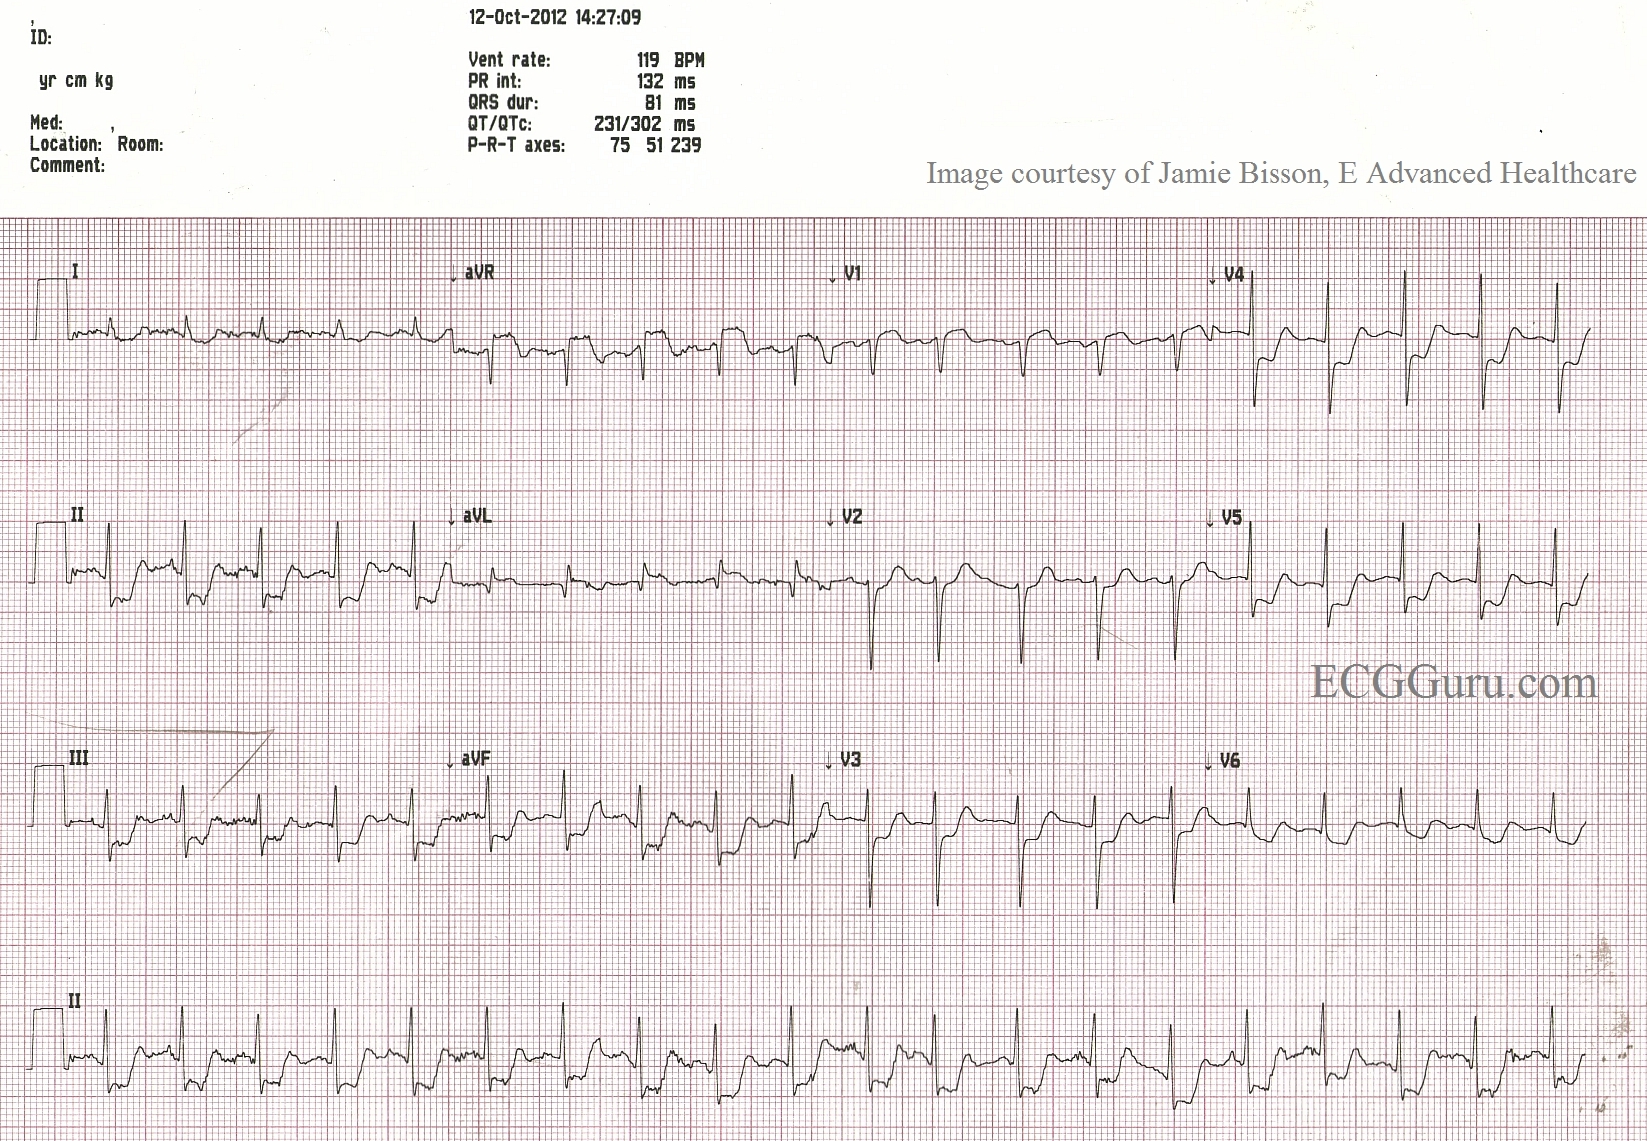
Pages

All our content is FREE & COPYRIGHT FREE for non-commercial use

Please be courteous and leave any watermark or author attribution on content you reproduce.