
Submitted by Dawn on Wed, 02/24/2016 - 20:09
This ECG is a good example of sinus rhythm with aberrantly-conducted PACs. The tracing was donated to the ECG Guru several years ago by Dr. Ahmed from Sanjiban Hospital in India. We have no patient data for this tracing.
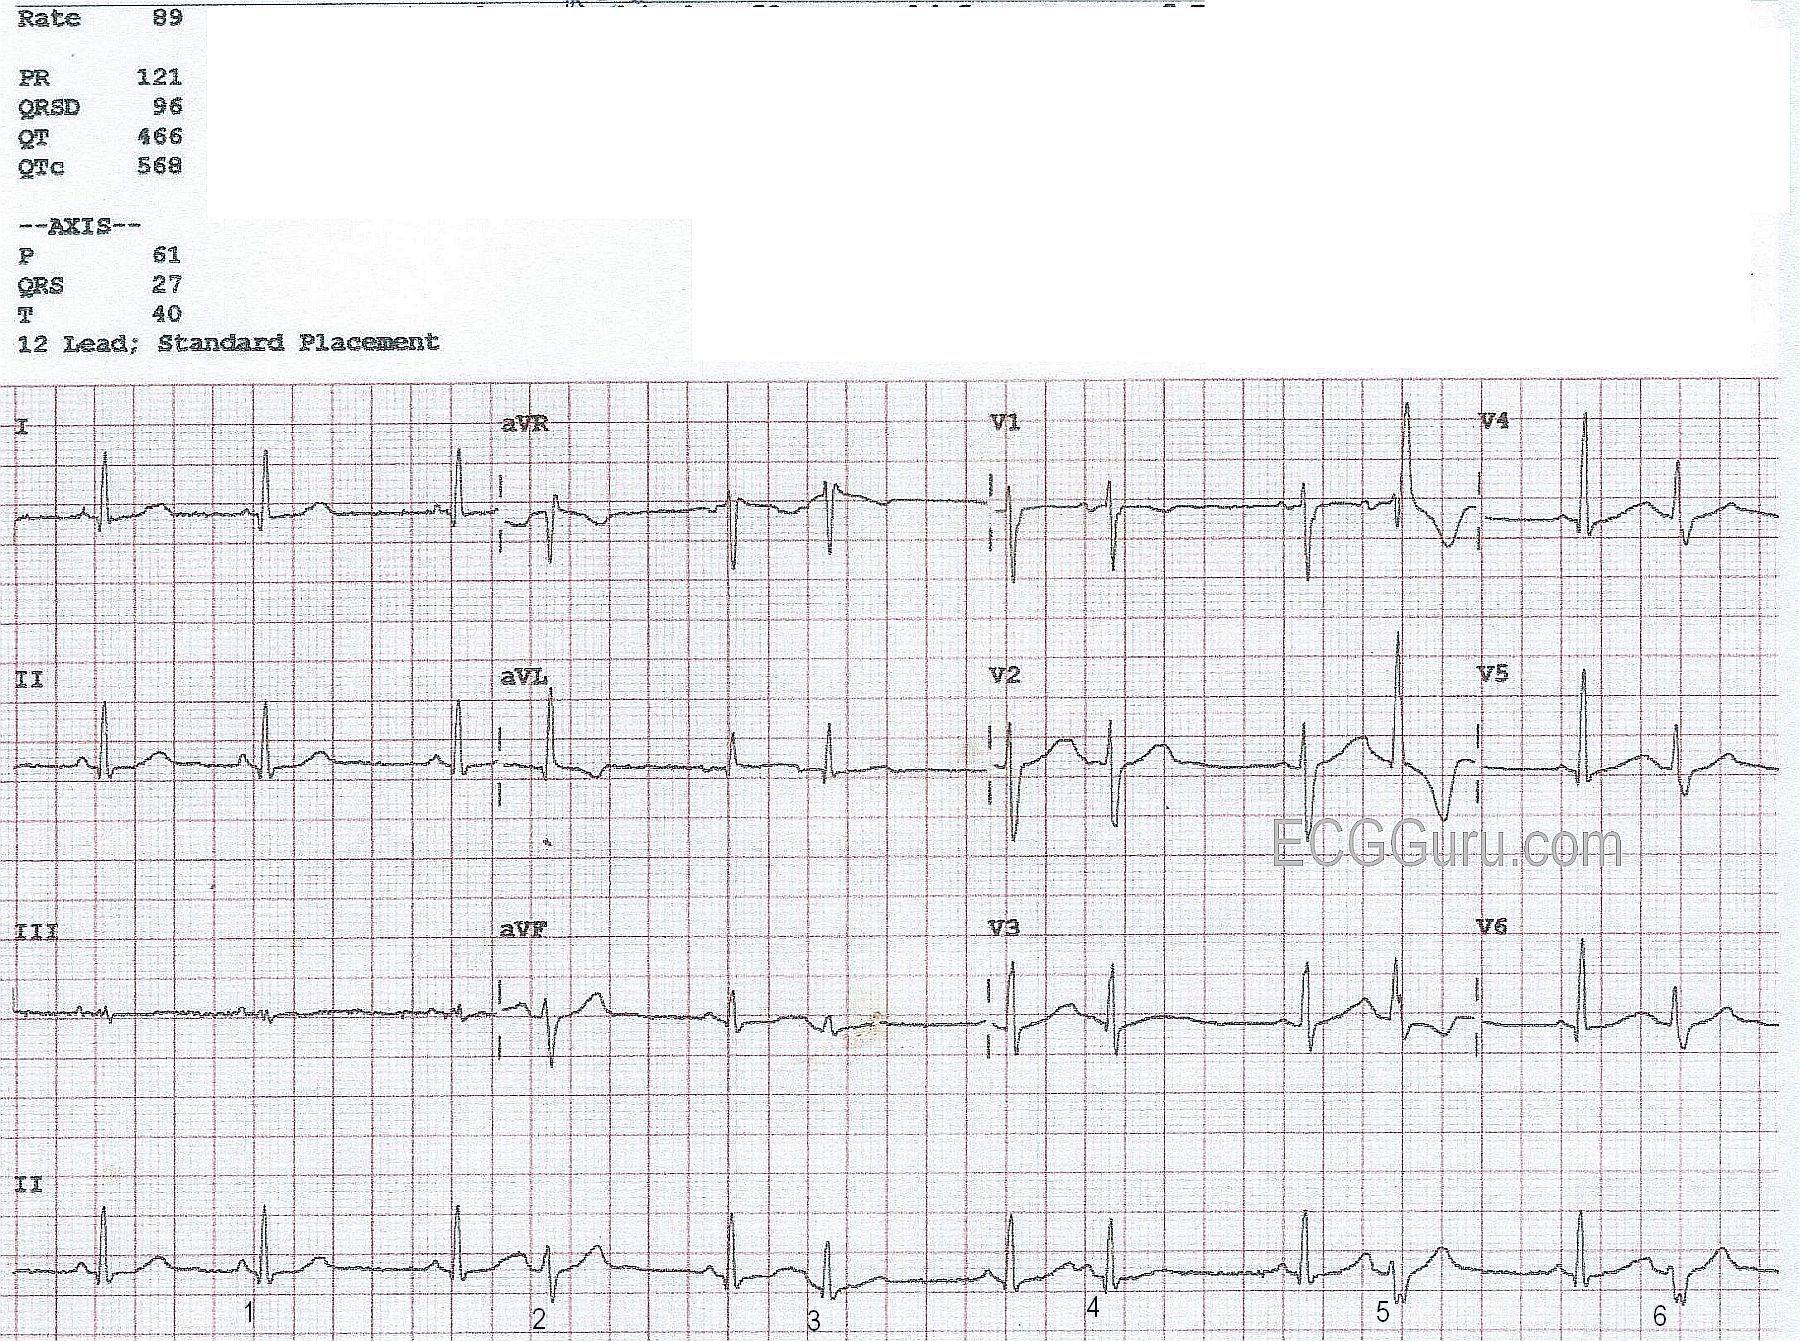
The underlying rhythm here is normal sinus rhythm. Most of the parameters – rate, PR interval, and QRS duration – are normal. The QTc interval, which is the QT interval corrected to a rate of 60 bpm, is prolonged at 568 ms. We do not know the patient’s clinical condition or medications, so we cannot guess at the reason. However, a prolonged QTc is associated with an increased risk of Torsades de pointes, a type of polymorphic ventricular tachycardia.
The first three beats appear the same (Leads I, II, and III). However, the first R-to-R interval is shorter than the second one. This could be due to rate variation, a concealed sinus block, or a premature atrial contraction (PAC). The P wave of the “early” beat, marked #1, looks slightly different from the other P waves in Lead II, but, because of the slow rate, there is no way to be sure without a longer rhythm strip. After the possible PAC, the rhythm becomes coupled, probably atrial bigeminy, where every other beat is a PAC. There are several mechanisms that cause grouped beating, but atrial ectopic bigeminy is the most common. Normally, PACs have different-looking P waves compared to the sinus beats. In this ECG, the P waves are often buried in the preceding T waves, and are hard to evaluate.
Interestingly, the PACs in this strip are conducted with varying amounts of aberrancy. Because they are premature, they find the ventricles in varying stages of repolarization. When the ventricles are not completely repolarized, the electrical impulse may conduct down the more recovered conduction pathways, while going around the less recovered pathways. A common form of aberrant conduction is right bundle branch block. In RBBB aberrant conduction, the impulse finds the right bundle branch temporarily unable to conduct, so it follows the left bundle branch down into the ventricles. The left ventricle is depolarlized slightly ahead of the right, and the common ECG pattern of a wide QRS with rSR’ pattern in V1 and Rs in Leads I and V6 will appear.
The PAC marked “2” probably has a small degree of aberrancy. The PACs marked “3” and “4” appear almost like the normal beats. PACs “5” and “6” have clearly taken on the form of right bundle branch block, including the T wave changes commonly seen with RBBB.
The clinical significance of the grouped beating, and of the prolonged QT interval, would have to be evaluated before treatment is decided. But, this ECG provides students with a good opportunity to see variations on aberrant conduction.
Rate this content:
All our content is FREE & COPYRIGHT FREE for non-commercial use
Please be courteous and leave any watermark or author attribution on content you reproduce.
Comments
PACs with Varying Degrees of Aberrant Conduction
FIRST — I don’t “buy” that the QTc is prolonged in this example. Usually the computerized interpretation will be accurate in assessing intervals. This however, is one occasion in which it is wrong. I suspect the computer was including all QT intervals, with many of them being artificially lengthened because of the early beats (as well as because premature P waves on top of the last part of the preceding T wave produced “pseudo-QT prolongation” ). I would favor assessing the QTc in this tracing from the very first 2 QRS complexes (which are not surrounded by any PACs) — and the QT interval clearly looks normal for those 2 beats. I would therefore cross out the computer assessment of the QTc, and assume the QT is normal.
Otherwise — This is an excellent ECG for illustrating some important aspects about diagnosing aberrant conduction. The underlying rhythm on the long lead II rhythm strip is sinus — with different-looking beats occurring in a bigeminal pattern beginning with the 4th QRS complex on this tracing. The “bottom line” — is that we can say with 100% certainty that the beats labeled as #2,3,4,5,6 are all supraventricular with aberrant conduction.
How do we know this with such certainty? There are several reasons which become clear with the following observations:
i) Beats #2,3,4,5,6 are all preceded by premature P waves. Some of these P waves are easier to see than others (ie, there is no mistaking the P wave seen before the beat labeled as #4). The other P waves ARE present, and deform to various degrees the T wave preceding them. The MOST reliable way to diagnose aberrant conduction is by finding a premature P wave before the different-looking beat — and we have this in each instance (before beats #2,3,4,5,6) in this case.
ii) QRS morphology is absolutely typical for aberrant conduction! To appreciate this, we need to use the concept of “simultaneous leads”. That is, if you look vertically up from the long lead II rhythm strip at beat #5 all the way to lead V1 — you see an absolutely “classic” RBBB aberrant pattern with small initial r wave, S wave that descends below the baseline, and then a relatively thin and monophasic tall R’ (ie, taller “right rabbit ear” ). This absolutely typical morphology almost by itself is diagnostic of aberrant conduction.
iii) Now look vertically up from the long lead II for beat #6 until you reach lead V6 — and you will see the wide terminal S wave in lead V6 that is characteristic of RBBB.
iv) There is also LAHB aberration — which we see multiple times in the long lead II rhythm strip for beats #2,5,6. Aberrant conduction most often appears with QRS morphology consistent with some form of conduction defect. RBBB aberration is the most common form seen (because in most patients, it is the right bundle branch referactory period that is longest … ) — but any form of conduction defect may be seen. Here we have RBBB/LAHB aberration.
v) Finally — there is a “reason” for aberrant conduction. That is, the ONLY beats that look different are the PACs (ie, each QRS is preceded by an early-occurring QRS) — AND — the degree of aberration is consistent with what you would expect from the relative coupling intervals between normal beats and the different-looking beats. That is, the coupling interval (ie, distance between the 7th QRS complex on this tracing and the PAC just before the beat labeled #4) is the longest coupling interval — which is why beat #4 is almost conducted normally! In contrast — coupling intervals (as carefully measured with calipers) are shorter prior to beats labeled #2,5,6 — which is why these beats manifest LAHB aberration (and in the case of beats #5,6 also RBBB aberration).
BEYOND-the-CORE — The process described above is “cycle-sequence comparison” — which simply means assessing relative coupling intervals in the hope of explaining the presence (and relative amount) of aberrant conduction. Added to this is a final parameter that we have not yet mentioned — which is the preceding R-R interval. That’s because length of the relative refractory period depends on length of the preceding R-R interval — and often one has to “balance” potential effect of relative length of the preceding R-R interval with the potential effect of a given coupling interval length.
BOTTOM LINE — While some of what I describe above is admittedly complex, the KEY concepts are hopefully clear and can be summarized as follows: The underlying rhythm is sinus. The beats labeled #2,3,4,5,6 are all early and preceded by premature P waves — so these are ALL PACs. The presence of premature P waves and completely typical QRS morphology for RBBB/LAHB convincingly proves these beats are all aberrantly conducted to varying degrees — with the greatest amount of aberration being seen in beats with the shortest coupling intervals ( = beats #2,5,6).
============================================
FOR THOSE WANTING MORE — I explain the Basics of Aberrant Conduction in my ECG Video #12 (which is in my Part 3 on Rhythm Diagnosis) — CLICK HERE for a link that will take you directly to 19:46 in the video, where the next 10 minutes thoroughly illustrate and review this subject —
You may also find these 2 ECG Blogs of interest on this subject (includes discussion of the Ashman phenomenon):
Ken Grauer, MD www.kg-ekgpress.com [email protected]
Excellent Discussion, Dawn and Dr. Grauer
Excellent ECG and analysis from both of you. There's a lot to be learned here. I, too, was somewhat taken aback by the computer-calculated QTc. It was way off in this case.
I have very little to add to two excellent analyses, but of course, I struggled to come up with something. Looking at V1, the second premature beat is a classic RBBB pattern. But the first premature beat in V1 is also a classic RBB DELAY pattern. While the QRS complex looks very similar to the "normal" beats in V1, you will notice that the S wave is smaller - shorter. That is the first sign of a conduction delay developing in the right bundle branch. Normally the L to R conduction in the septum cancels very little of the opposing force in the left lateral wall. However, with a delay in the right bundle, the septum is free to be depolarized from L to R more completely, providing extra "counterpoise" to the opposing vector on the other side of the left ventricle. Thus, the S wave in V1 is slightly - but noticeably - shorter.
Thanks again to Dawn and Dr. Grauer!
Jerry W. Jones MD FACEP FAAEM
https://www.medicusofhouston.com
Twitter: @jwjmd