
Submitted by Dawn on Tue, 05/26/2015 - 14:36
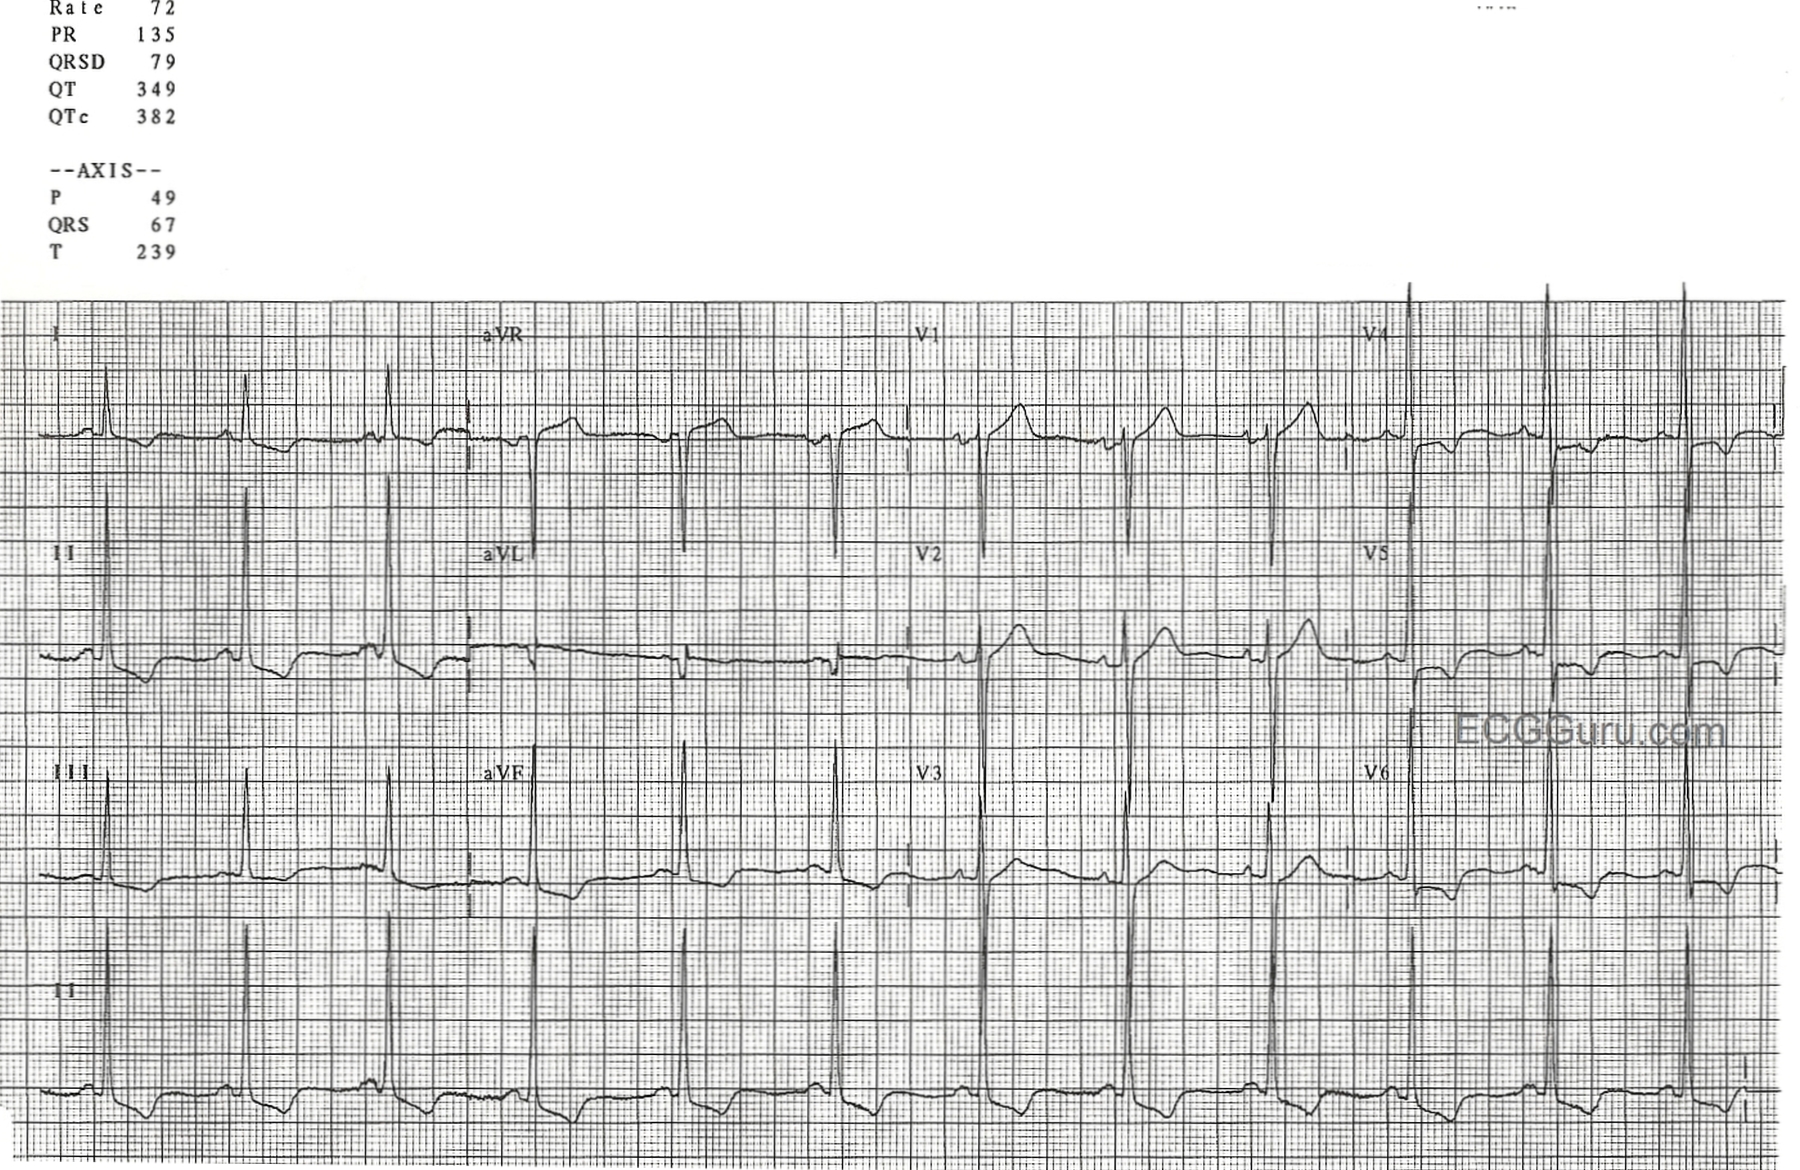
This ECG shows voltage criteria for LVH (deep S waves V1-V3 and tall R waves V4 - V6). There are many criteria in use for determining LVH, but probably the most commonly used is the Sokolow-Lyon criteria. This criteria says that if the voltage of the S wave in V1 PLUS the tallest R wave of V4, V5, and V6 equals 35 mm or more, the criteria are sufficient for LVH.
In order to diagnose LVH from the ECG, we must also show repolarization abnormalities, called the "strain pattern". This is seen in sloping ST depressions in all leads with upright QRS complexes. There will also be slight ST elevations (reciprocal to the depressions) in leads with negative QRSs. Chest xray and echocardiogram are important in confirming the extent of the left ventricular enlargement.
The axis of this ECG is not typical of LVH, as it is normal. LVH usually has a left axis deviation. In this ECG, Lead aVL appears to have a pathological Q wave. Possible high lateral damage in the past has skewed the axis downward. The wide p waves in Lead II and the biphasic p waves in V1 may also indicate left atrial strain, a common finding with LVH, called "P mitrale".
Related Terms:
Rate this content:
All our content is FREE & COPYRIGHT FREE for non-commercial use
Please be courteous and leave any watermark or author attribution on content you reproduce.
Comments
LVH but No History — And Anything Else?
The ECG for this week’s Instructor’s Collection is a gem that offers an array of teaching points. These are best illustrated by beginning with systematic interpretation of the tracing.
MISSING: There is NO history given — not even the age of this patient. That said — I’ll guess the patient is an adult who is at the very least middle age given the variety of findings listed below. But the point to emphasize is the NEED for a History (including the patient’s Age) in the clinical interpretation of any tracing, especially this one.
DESCRIPTIVE ANALYSIS: The rhythm is a fairly regular sinus rhythm at a rate between ~65-70/minute. All intervals (PR, QRS, QT) are normal. The axis is normal at ~ +70 degrees. P wave morphology varies somewhat from beat-to-beat — and is borderline for biatrial abnormality (See below). There is definite LVH. Q-R-S-T CHANGES: A wide and disproportionately deep Q wave is seen in lead aVL. Transition is normal (between lead V3-to-V4). There is ST-T wave depression in inferior and lateral leads consistent with ischemia and/or LV “strain”, if not other cause. There is 1-2 mm of ST elevation in lead aVR. U waves are seen in V2,V3 — and possibly also in V5,V6 (fusing with the terminal portion of the T wave in these leads). We are not given any prior tracing for comparison ...
IMPRESSION: Sinus rhythm. Old lateral infarction (the Q in aVL). Possible LAA/RAA. Definite LVH with ST-T wave changes suggestive of ischemia and/or “strain” (and/or drug effect or electrolyte disorder). Strongly suggest clinical correlation! (ie, IF I was reading this tracing among a “pile” of ECGs to be read — I would stop what I was doing to find out some clinical history about this patient before moving on — since without some history I could not render a final interpretation). I’d also LOVE to find a prior tracing on the patient to be able to compare ...
——————————————————
A more detailed explanation is in order:
——————————————————
Although the Q wave in aVL is isolated to this lead — lead aVL is the “highest” of the lateral leads in terms of its anatomic perspective — so it is indeed possible for significant Q waves and/or ST-T wave changes of high lateral inury/infarction to only be seen in that lead. Given the relative width and depth of the Q wave in aVL — we interpret this finding as suggestive of prior lateral infarction.
U waves are clearly seen in this tracing. Although typically thought of as diagnostic of hypokalemia — specificity of this finding is far from perfect. U waves may also be seen with bradycardia, LVH, hypomagnesemia — or in patients without specific abnormality. But the finding of small-but-definitely-present U waves in V2,V3 + likely large U waves in V5,V6 (that fuse with the terminal portion of the T wave in those leads) + diffuse ST depression in a patient who is likely to be on a number of cardioactive medications (possibly diuretics) should at least prompt consideration of low K+/Mg++.
ECG sensitivity and specificity for atrial abnormality is poor. As a result — we tend to undercall LAA and RAA (Left and Right Atrial Abnormality) unless we feel those diagnoses are likely. We find ourself wavering in this case as to whether or not to call LAA and RAA. For example, in the long lead II at the bottom of the tracing — some P waves look wide with notching and others don’t. Of the 3 P waves seen in lead V1 — the middle P wave shows a deeper terminal deflection than the other two. That said — the likely “context” of this tracing (despite not being given any history) — is that there is significant underlying structural heart disease (LVH and perhaps heart failure/cardiomyopathy/prior lateral infarction) — such that “borderline” ECG sign of LAA will probably correlate with some degree of LA dilatation on Echo. The positive and pointed (albeit small) initial P wave component in lead V1, with similar positive pointed P wave in V2 in this context suggests RAA. Alternatively — one could make the case that consistently larger-than-anticipated P waves in many leads with occasional extra notching (ie, in V5,V6) is more consistent with intra-atrial conduction defect rather than biatrial abnormality — with bottom line that the ECG is simply not a good indicator of what may (or may not) be going on in the atria …
There are many criteria in the ECG literature for diagnosis of LVH. Our preference favors use of deepest S in V1 or V2 (rather than just V1) + tallest R in V5,V6 (rather than V4,V5,V6) ≥35 mm — but that is a matter of personal preference. It is also academic in this case — since LVH voltage criteria are easily satisfied in this tracing regardless of which of the 50+ criteria in the literature that you select.
In our experience — I rarely need to look beyond leads V1,V2; V5,V6 and lead aVL (R wave ≥12 mm) to make the ECG diagnosis of LVH. But among other criteria I find helpful to be aware of — is presence of an R wave in any inferior lead of ≥20 mm. So diagnosis of voltage for LVH may be confidently made in this tracing exclusively from the finding of the R wave in lead II = 25 mm.
In my experience — LAD (left axis deviation) is often not found in association with definite ECG diagnosis of LVH. This is different than for RVH — for which RAD (right axis deviation) is one of the best indicators that RVH is present.
Voltage for LVH without accompanying ST-T wave changes of strain has poor specificity for true anatomic enlargement. However, the very typical sagging ST segments we see in multiple leads in this tracing in association with marked increased voltage probably places the chance of true LV chamber enlargement at >98-99% likelihood.
That said — there may be more than simple LVH in this tracing. Note that in addition to ST sagging — the J-point is significantly depressed in leads II, aVF, and V4,V5,V6. In addition, the shape of the ST segment in leads V4,V5,V6 (before reaching the negative T wave component) is coved. These findings clearly suggest that in addition to LV “strain”, there may also be ischemia that could be acute. We simply cannot distinguish between ST-T wave changes of marked “strain” vs ischemia vs a combination of the two on the basis of 1 ECG without prior tracings for comparison and with no history. For documentation purposes — we cover these possibilities by writing on our ECG interpretation, “LVH with strain and/or ischemia; Suggest clinical correlation”.
Clinically, in cases like this (ie, when we are asked to interpret a tracing on a patient that we know nothing about) — We either go to the chart or directly call the clinician provider to find out about the history. We do all in our power to try to obtain a prior ECG for comparison to see whether ST-T wave changes are new or old. This point cannot be overemphasized. IF the history in this case was progressively increasing chest discomfort of recent onset — then the diffuse ST-T wave changes we see in association with ST elevation in lead aVR might clearly indicate severe coronary disease with need for timely cardiac catheterization! We suspect changes seen in this tracing are less likely to be acute — but we cannot be certain of this without more information.
Finally — Note that the sagging ST segments in this tracing are not only seen in lateral leads, but also in inferior leads. In patients with a relatively vertical axis (as seen here) and marked increased inferior lead R wave amplitude — ST-T wave changes of LV “strain” may also be seen in inferior leads. So it is not the ST sagging per se in the inferior leads that heightens our attention to possible new ischemia on this tracing — but rather diffuseness of the ST depression + ST segment coving + J-point ST depression + ST elevation in lead aVR.
——————————————————
BOTTOM LINE: This ECG shows sinus rhythm, definite LVH with ST-T wave changes consistent with “strain” and/or ischemia. My overall “sense” is that nothing acute is going on with the patient — but some additional history (and ideally a prior tracing for comparison) is needed before we can be comfortable with that conclusion.
——————————————————
For those wanting more on the ECG diagnosis of Chamber Enlargement — Please see my ECG Blog #73 (on LVH) and ECG Blog #75 (on LAA/RAA).
——————————————————
P.S. A number of readers have asked if there are delta waves (or intermittent delta waves) present on this tracing. My answer is NO. Although admittedly, the PR interval is relatively short — and it looks like there may be some initial slurring of the QRS in a few leads (most notably in lead II) — this is not nearly consistent enough to qualify as a “delta wave”. I measure the PR interval at 0.13 second — which IS within the lower limit for normal AV nodal pathway conduction. What happens in some patients with marked LVH — is that the initial normal lateral septal q waves are lost. Note complete absence of q waves in leads I,V4,V5,V6 — with the only Q wave being the very wide (probably prior infarction) Q wave seen in lead aVL. It is not uncommon in older individuals with significant underlying structural heart disease — to develop some small amount of slurring in the initial portion of the QRS that is not associated with any AP (Accessory Pathway) — and that is what I believe is happening here.
Ken Grauer, MD www.kg-ekgpress.com [email protected]
Q in aVL
A pretty exhaustive analysis from Ken, including the important message that, contrary to popular opinion, LVH is usually not associated with a left axis deviation. I disagree with him on one point, although it may be a matter more of emphasis than substance. I don’t think that a big Q wave in aVL is in any way suggestive of previous lateral MI when there are no other supporting features. In a ‘vertically positioned’ heart a big Q in aVL can be an entirely normal feature, just as a Q in aVR usually is. If there is also a big Q in lead I, then the significance is completely different.
Dave R