
Submitted by Dawn on Wed, 08/07/2013 - 13:14
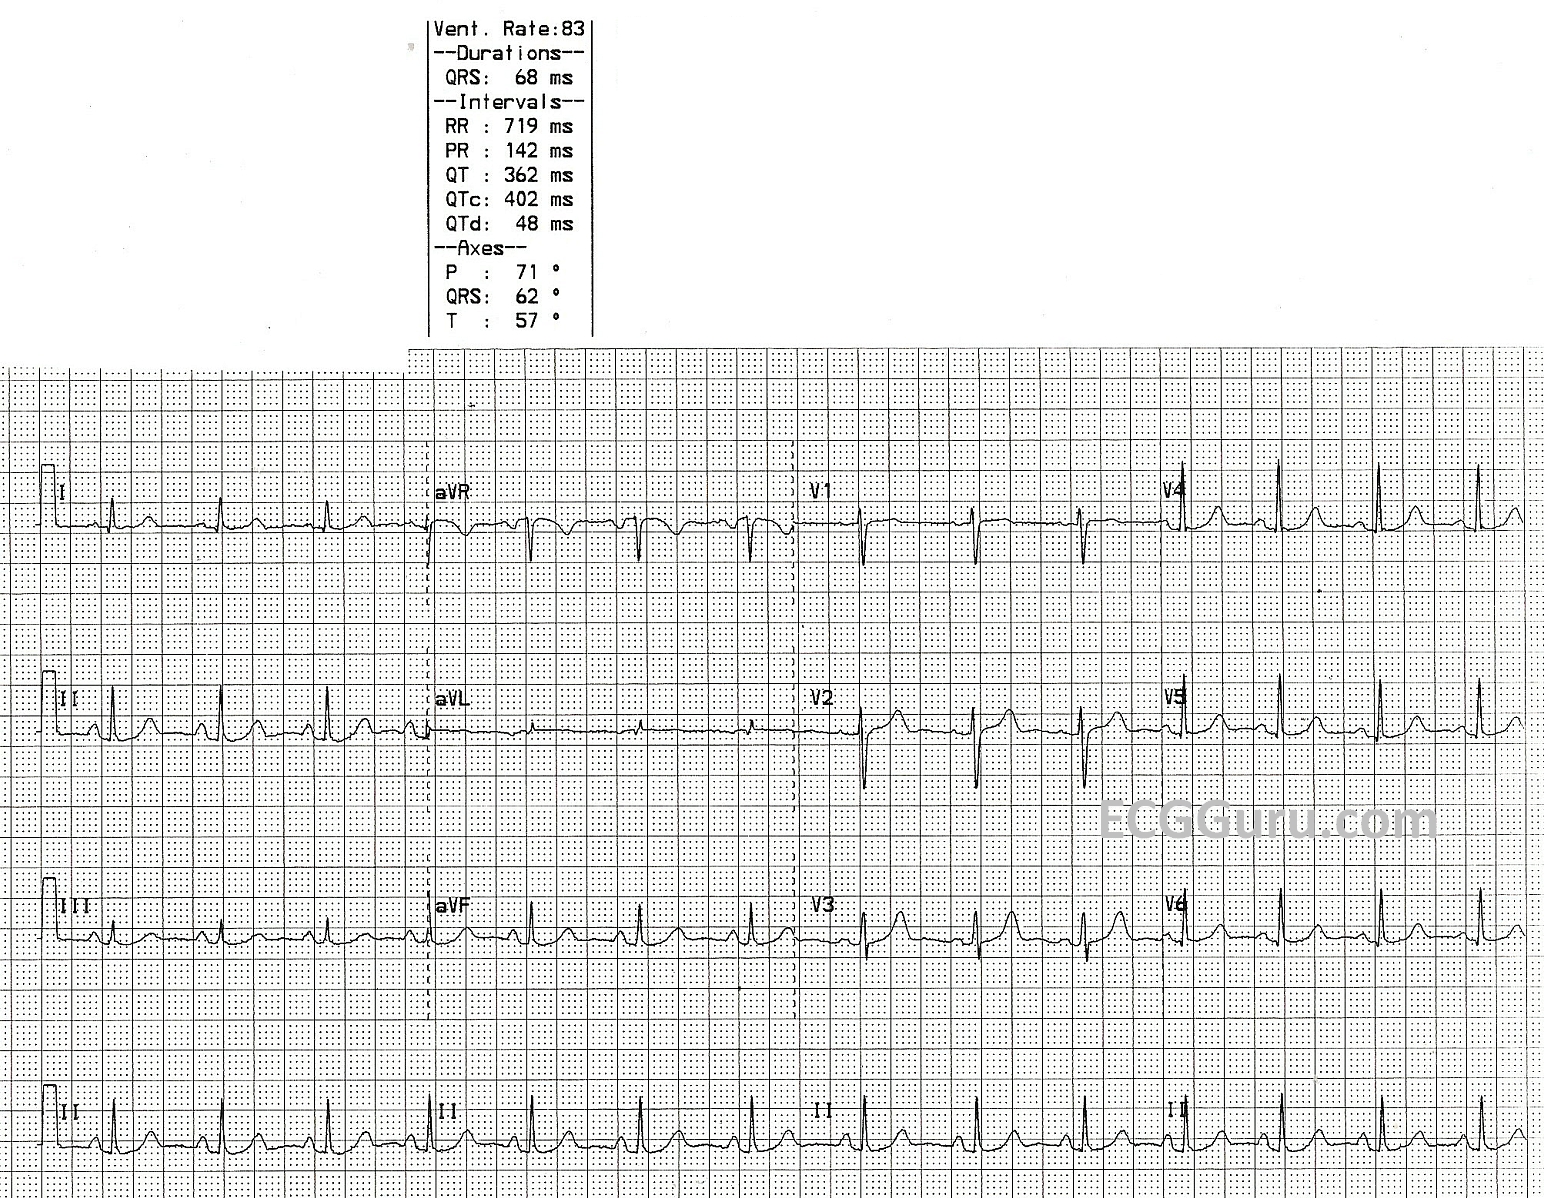
Up until now, we have posted basic rhythm strips in this area of the ECG Guru for those of you who are teachers of beginning students. Today, we offer a "normal" 12-Lead ECG for those desiring to introduce students to the 12-Lead format. It is always best to become familiar with normal before venturing into the realm of "abnormal". Encourage your students to find what they know to be normal, then add to their knowledge. Examples of findings which are within normal limits are: rate, rhythm, P wave morphology, QRS morphology, intervals, axis, R wave progression, ST segments, and T wave direction.
While advanced practitioners can almost always find something that is not "normal", we must remember that that can be said about almost any human body. This ECG was taken from a healthy volunteer with no medical complaints.
Rate this content:
All our content is FREE & COPYRIGHT FREE for non-commercial use
Please be courteous and leave any watermark or author attribution on content you reproduce.
Comments
A Basic Normal Tracing - and an Interesting Normal Finding
The ECG presented represents a normal 12-lead ECG obtained from a healthy volunteer with no medical complaints. As per Dawn - those who teach ECG interpretation can encourage systematic assessment of the parameters of Rate - Rhythm - Intervals - Axis - Chamber Enlargement - and QRST Changes.
The point to emphasize is that ECG interpretation should always consist of 2 Steps.
BEYOND-the-CORE: Did you notice that there is PR segment depression? This is best seen in each of the inferior leads, where the baseline right after the P wave is lower than the baseline just before the P wave. This may also be present in leads V4,V5 - and there seems to be a slight hint of PR elevation in aVR.
For more on Pericarditis - CLICK HERE.
Ken Grauer, MD www.kg-ekgpress.com [email protected]
Test Subject from app
Test