Dawn's picture

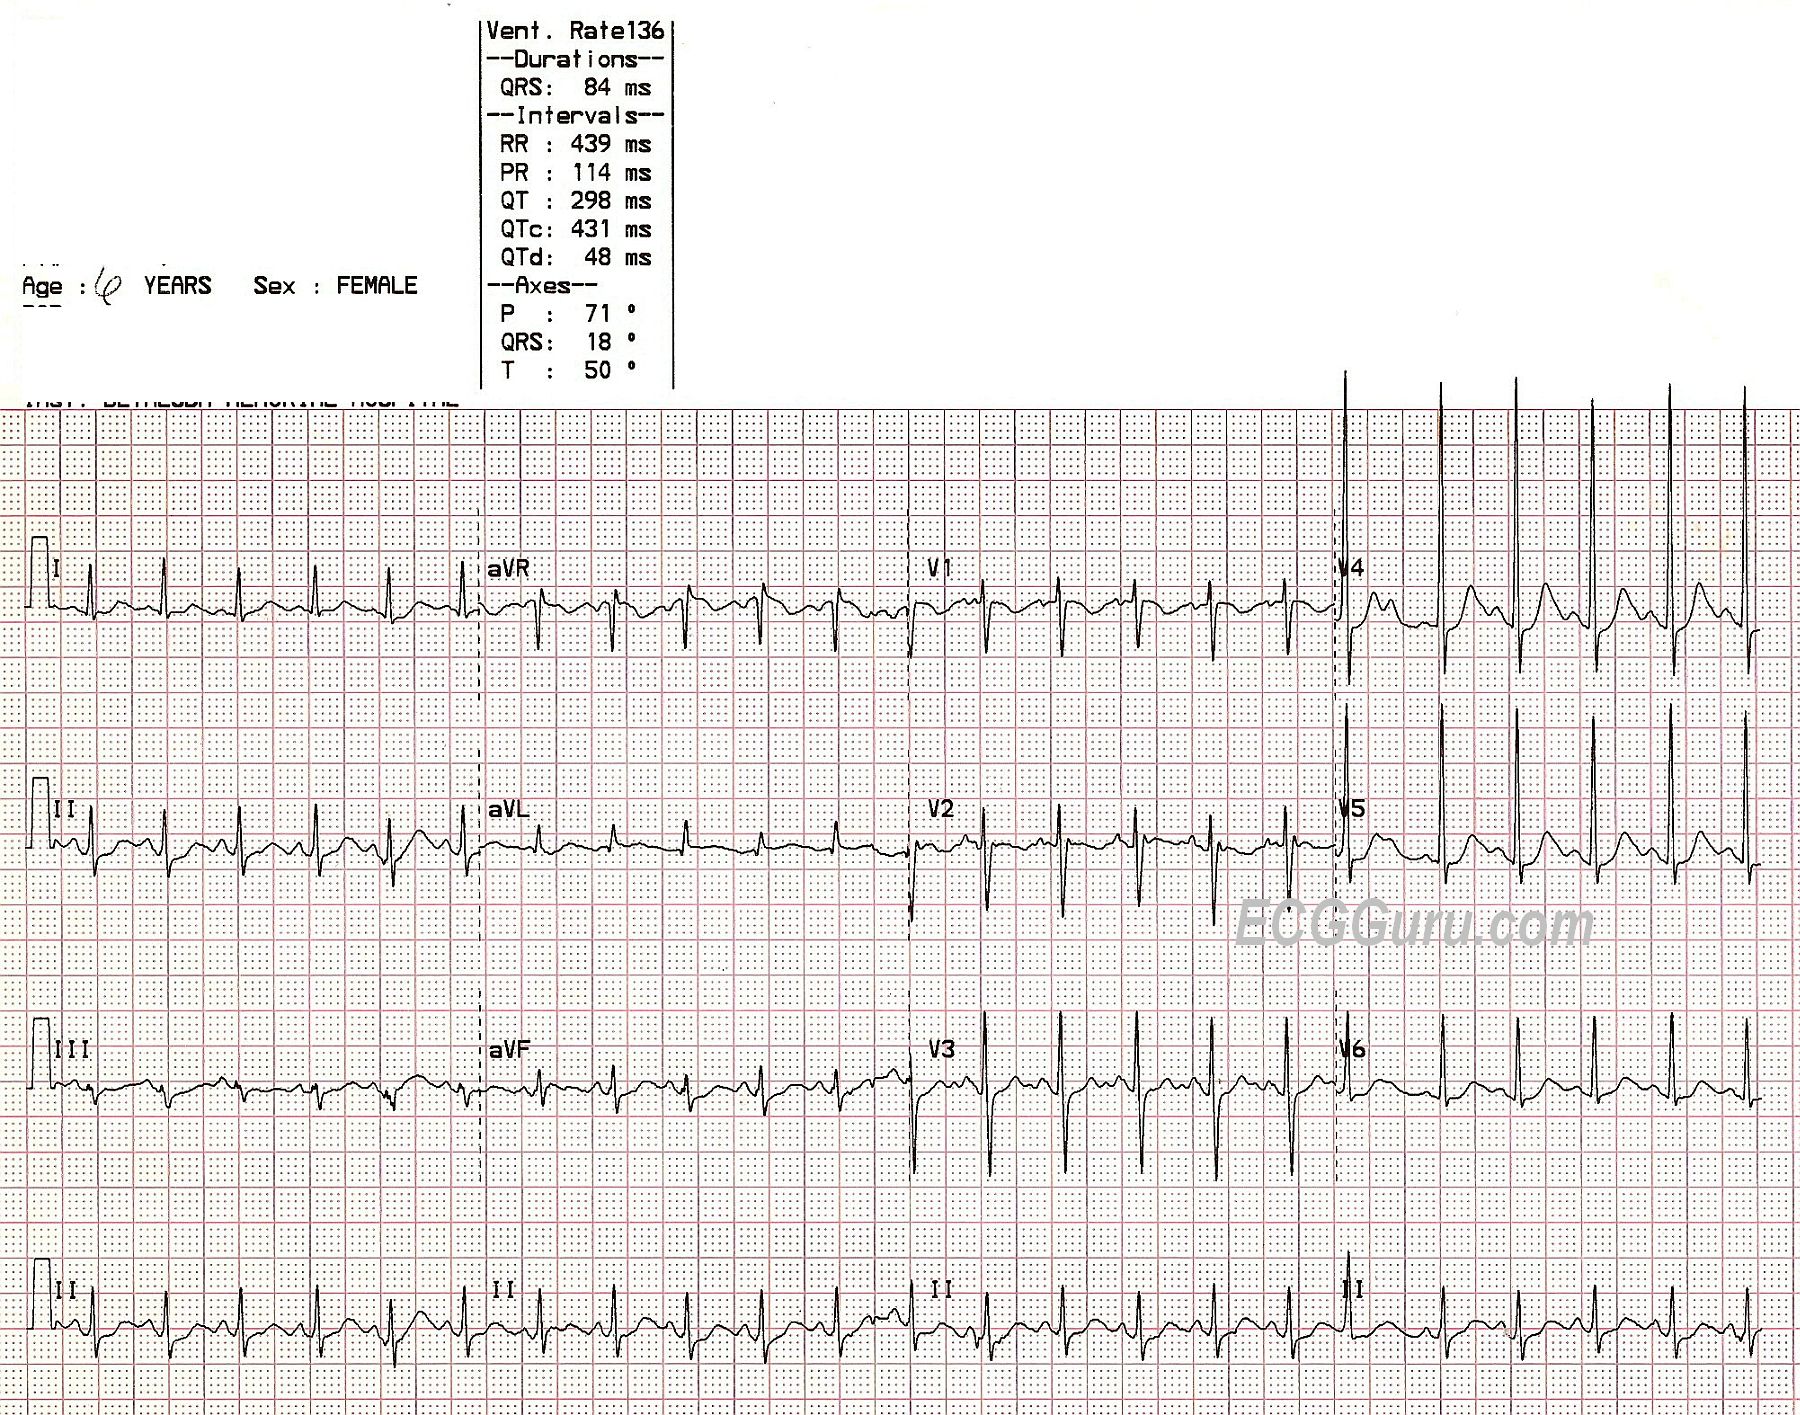
A six-year-old girl was found with her two younger siblings and her mother, unconscious, in a room filled with carbon monoxide.  The mother had been using a charcoal grill inside the house.  She managed to call 911 before losing consciousness, and the fire rescue paramedics broke into their house, saving them.  This six-year-old required treatment in the pediatric intensive care unit, but recovered completely.  The lesson for our students is to judge rate in the setting in which it is found.  The heart rate here is 136/min.  Normal for a child of six is usually between 80 and 100 at rest.  This child is severely hypoxic, and she has sinus tachycardia.  It would be a mistake to assume her rate is normal because "all children have fast heart rates".  Also, children with sinus tachycardia can be so fast, they appear to have PSVT.  The onset and offset can be excellent clues to the origin of the rhythm.  Sinus rhythms can be expected to speed up and slow down gradually, unlike PSVTs, which have sudden onset and offset.  The most important consideration is that sinus tachycardia usually has an APPARENT CAUSE:  exercise, anxiety, hypoxia, hypovolemia, fear ,,,, the list is a long one.  Once it is determined that the patient has sinus tachycardia, efforts usually focus on the elimation of the cause.


We welcome any comments on this ECG, perhaps taking the discussion to a more advanced level.

Rate this content: 
Average: 4.5 (4 votes)

Comments

CO high incidents of MI, T wave abnormal V1V2, lead III T Wave???

TWI is normal in V1. As is inverted P waves.

A very lucky family, to say the least. I'd be interested in seeing a post recovery ECG. No doubting this is a sinus tachy, but there are some curious changes which certainly would have had me worried when the ECG was taken. Starting with the QT interval - it appears prolonged, at greater than half the R-R interval, or am I seeing a U wave embedded in it? Secondly, some ST depression in the inferior and anterolateral leads - II, aVF, V3-V6, and there also appears to be a smidgen of ST elevation in aVR. I also note what appears to be either a PAC or junctional escape beat (18th QRS on the rhythm strip). Electrical criteria for LVH is also present. Certainly many of these changes can be attributed to hypoxia and CO poisoning, but I'd be interested to hear what others think about the QT and high voltage in V4-V5. Paed. ECG's are by no means my forte, so look forward to hearing from others.

ekgpress@mac.com's picture

Hello benant2. I am sorry for my delay in responding to your question about the QT interval - but I am somehow just seeing it now. The heart rate of this child is simply too fast to allow us to say much about the QT interval. The "not more than half the R-R interval" is a rule of thumb that works best at rates <90/minute - and does not do well at all beyond 110/minute ...  QT prolongation would seem low on the list of concerns about this unfortunate child - but given the marked tachycardia - we really can't comment on the QT in any meaningful way.

You may be interested in my brief on-line review of this topic - GO TO: https://www.kg-ekgpress.com/ecg_web_brain_DEMO_-_chapter_7_-_qt_interval/

Hope that answers your question.

Ken Grauer, MD  www.kg-ekgpress.com   [email protected] 

ekgpress@mac.com's picture

     Dawn's tracing for this week simply shows Sinus Tachycardia @ 135/minute in a 6 year old child. That said - IF you were teaching a group of intermediate (or even advanced) providers  there IS a lot you could talk about regarding this tracing. 

     To "test" your imaginative powers (as well as teacher mindset powers HOW MANY interesting aspects of this tracing might you discuss with others? (OR  if you are not a teacher  HOW MANY other interesting tidbits can you pick out on this tracing? ).
 
MY LIST follows below:
  • 1) We see the effect of respiratory variation on the long lead II rhythm strip. Note that the baseline is not completely horizontal  but it gradually goes up and down a bit. This IS relevant  because along with the baseline  such respiratory variation may affect ST-T waves. For example - Look in lead aVL. Obviously, we are not worried about acute MI in a 6-year old  but there looks to be subtle-but-real ST elevation in the tiny QRS complex in lead aVL in several of the beats  though not in the 1st beat in lead aVL. If the patient was older with chest pain  baseline movement might make it more difficult to assess ST-T wave changes. Lead III provides a more dramatic example. Note that ST segments vary in lead III from worrisome ST depression to what looks like a hyperacute T wave for the last ST segment we see in lead III.
  • 2) It's always a good idea to BEGIN assessment of any 12-lead by looking at a long Lead II rhythm strip. IF you do so  you'll note that P wave morphology is not completely the same. P waves vary a bit in size and some are more rounded than others. I think this is ALL due to baseline movement  but looking at this rhythm strip increases appreciation of how one often has to balance "What is real?" vs what is due to artifact/baseline wander.
  • 3) DID YOU NOTICE THE EARLY BEAT? The 6th beat from the end of this long lead II rhythm strip occurs early! This would be EASY to miss unless you disciplined yourself to ALWAYS begin assessment of any 12-lead by a focused 2-second look at the long lead II  letting your eye go beat-to-beat looking for P waves  ensuring P wave morphology is the same (and sinus and looking to see if there are any early beats.
  • 4) WHY is the QRS that occurs early (6th from the last beat in the long lead II ) different in shape from all other QRS complexes on this tracing? ANSWER  it is either a PAC or PJC that conducts with some aberration.
  • 5) DID YOU NOTICE that this early beat DOES look the same in simultaneously recorded leads V4,V5,V6 - it just looks different in lead II. This emphasizes the point that whenever you do have simultaneously recorded leads  they should be used. Something that may not be evident in one lead might be evident in another lead.
  • 6) Did you notice the rSr' in lead V2. Leads V1 and V2 are very close to one another. Although we typically depend on lead V1 to show us the rSr' complex  sometimes this is only seen in lead V2. This terminal r' indicates that the last part of the depolarization process is the RV outflow track. It is a common normal variant in children and young adults. Technically  it is not called an "incomplete RBBB" unless you also see a narrow S wave in left-sided leads I and V6. You actually DO see a terminal S wave in these leads  albeit a tiny one  so I could go either way as to whether this is an rSr' in lead V2 vs "incomplete RBBB". Realize that even if it did represent "IRBBB"  that this is also a normal finding in children and young adults. (And also realize that sometimes precordial lead misplacement may artifactually produce an "IRBBB" ... ).
  • 7) QRS amplitude looks to be increased (it is real tall in lead V4 ). Realize that the "norms" we use for amplitude in adults don't hold true in children with their smaller chests (and proportionately different chest wall-to-heart ratios). Most non-pediatric-specializing providers only uncommonly get to interpret pediatric ECGs. While not in the least pretending to be expert in pediatric ECG interpretation  I've made available some PDFs that summarize some basics about interpreting Pediatric ECGs/Arrhythmias. For example  instead of looking for 35mm for deepest S in V1,V2 + tallest R in V5,V6 as voltage for LVH - you need approximately 53 mm (the reverse of "35" ) in a child (children often have increased QRS amplitude so voltage in this example falls within the normal range for a 6 year old child. IF in doubt  voltage needs to be looked up in a Table based on age of the patient (I include a simplified pediatric voltage criteria Table at the above link).
  • 8) ST segments are not totally normal in this tracing. The T wave is inverted in leads V1,V2  which makes me glad I recognized that IRBBB earlier because T inversion like this is commonly seen with IRBBB. Even if the patient did not have IRBBB  T waves are often inverted in V1-thru-V3 or even V4 in young children as a "Juvenile T wave Variant"  so NO WORRY about the T inversion in V1,V2 (See my ECG Blog #5 for more on "Juvenile T Wave" syndrome). In addition  there are some nonspecific ST-T wave abnormalities (including subtle-but-real ST depression in multiple leads). This could be of concern if the patient was older and having chest pain. It is NOT of concern in a young child as tachycardic as we see here, as tachycardia itself may produce ST segment depression that will probably be gone once the tachycardia resolves (although, as per Dawn's history  the hypoxemia might have a role in the ST-T wave changes that we see).
BOTTOM LINE: Even a seemingly mundane sinus tachycardia tracing in a child can serve as subject for a fascinating discussion/learning experience.
 
Related PEARL: Are you aware of a syndrome known as IST? = Inappropriate Sinus Tachycardia. It is uncommon but clinically important to be aware of. 
=========================================
NOTE: I reference this tracing on my ECG Blog #72

Ken Grauer, MD  www.kg-ekgpress.com   [email protected] 

All our content is FREE & COPYRIGHT FREE for non-commercial use

Please be courteous and leave any watermark or author attribution on content you reproduce.