Dawn's picture

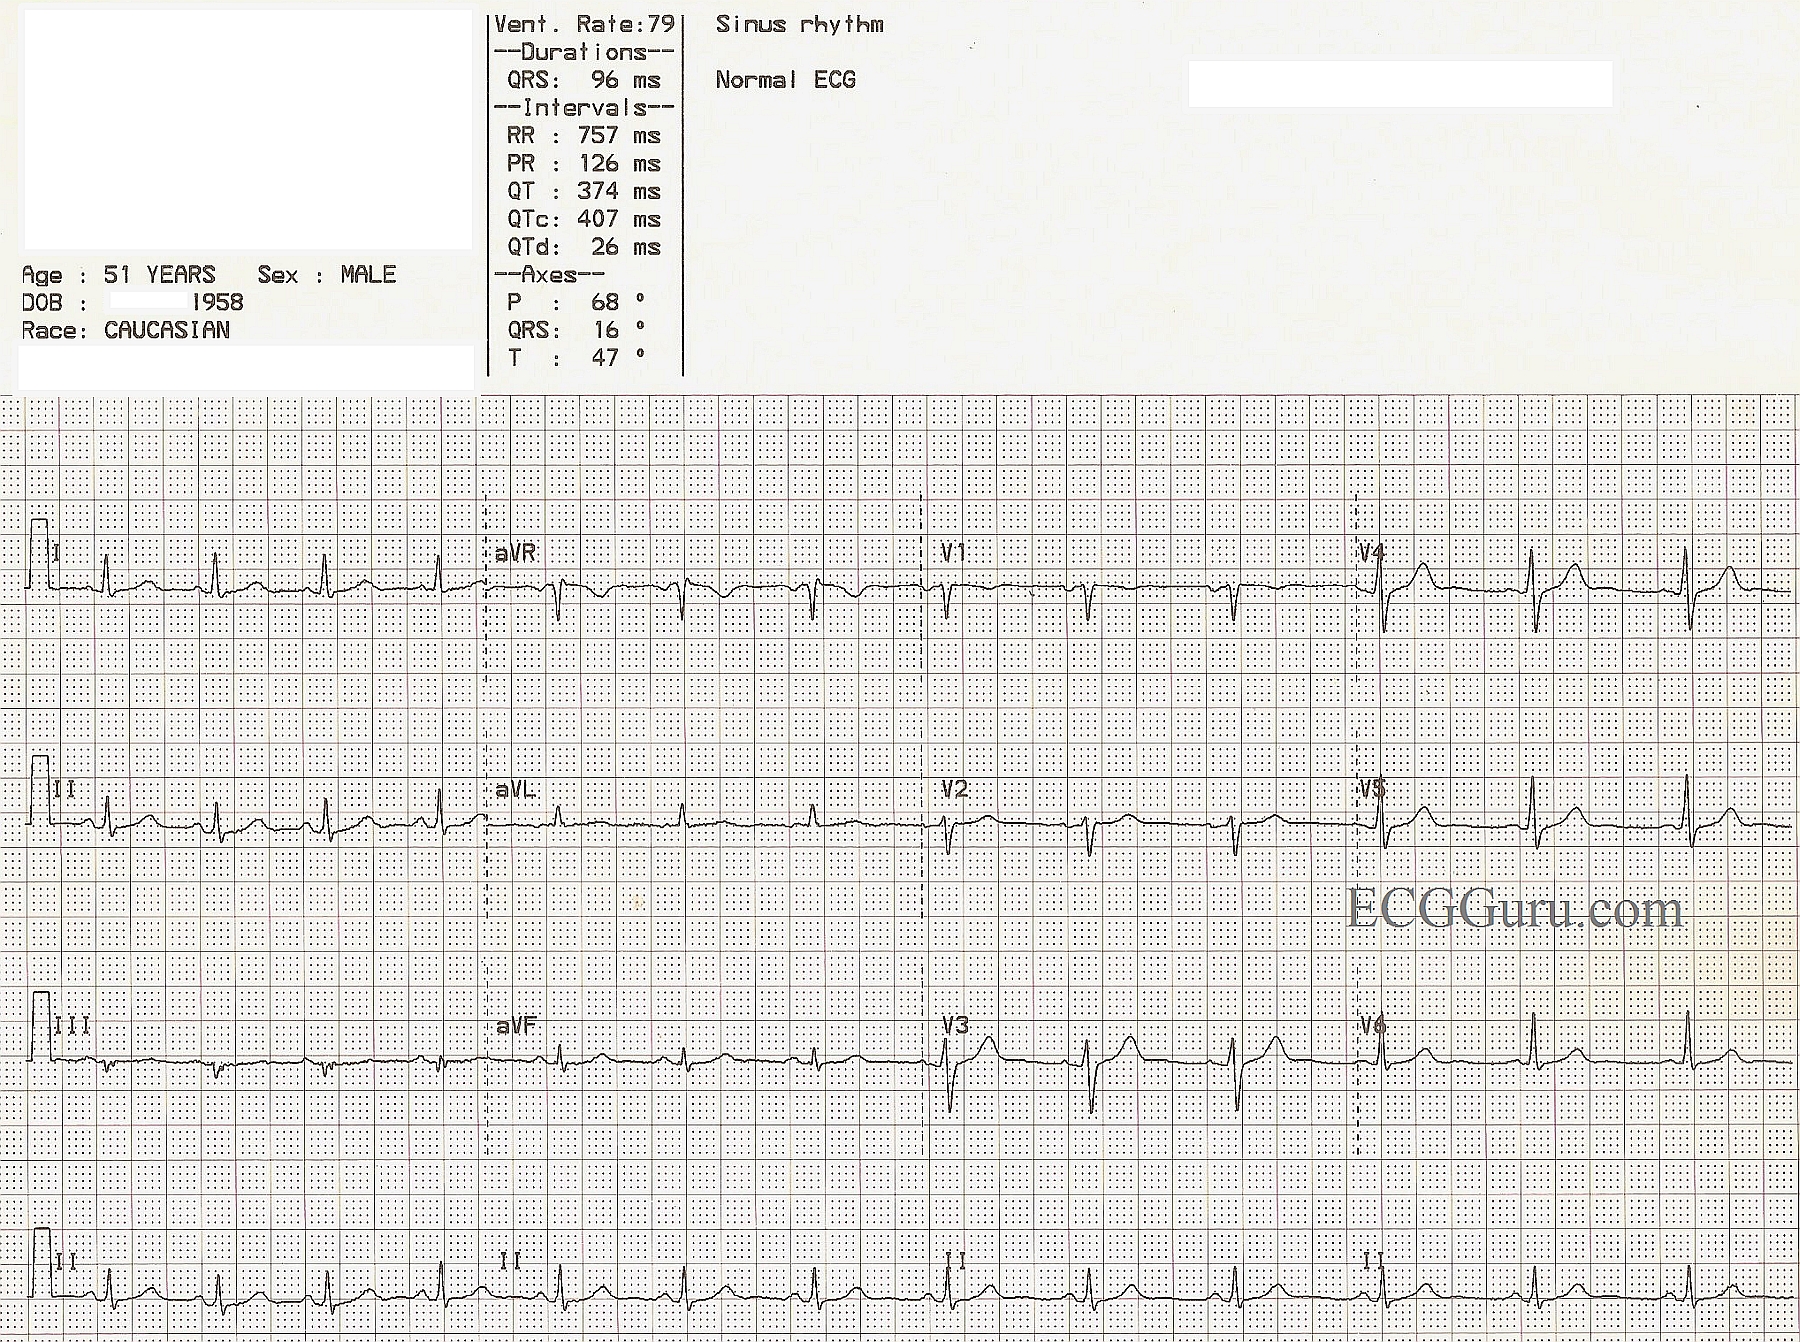
A nice, normal ECG for your collection.  It always helps to have a normal ECG for your students to compare to the abnormal examples you show them.  It pays to teach the characteristics of "normal" to your students so that they might readily recognize "abnormal".  One could argue that the voltage in this ECG is rather low, but that can be explained by body habitus.  Whether you are teaching basic rhythm interpretation, axis determination, R wave progression, or intervals, this ECG can be of help to you.  Remember, if you are teaching students who have not yet learned 12-lead interpretation, the bottom line of a four-channel ECG is usually a rhythm strip - most often Lead II.  It is easy to download this image, then crop it using any photo management program to include only the rhythm strip.  At the ECG Guru, we use Irfanview for the Instructors' Collection ECGs.

Rate this content: 
Average: 5 (2 votes)

Comments

ekgpress@mac.com's picture

Amazingly - I sometimes have to look extra hard to find the "normal tracings" in my collection - since many of us who teach get so used to collecting the variety of abnormals that we forget to save enough of the "normals" ... so NICE for Dawn to add a normal tracing for this week's Instructor's Collection. But - is this truly a "normal" tracing ... ?

The Answer is probably YES - but still with a number of "teachable moments" on the tracing. One might take full advantage of these by showing your group the tracing and asking: #1) Is this "normal"?; #2) What aspects of this tracing might be commented on?

I'd answer as follows:

  • Overall voltage is "rather low" as Dawn indicates. Strict criteria for "low voltage" in the limb leads is that NONE of the 6 limb leads exceed 5 mm in amplitude. The QRS in leads I and II in this tracing clearly are above 5 mm (counting the q plus R wave amplitude) - so technically, this is not "low voltage". I'm not aware of specific criteria for low voltage in the precordial leads - but sometimes for tracings like this in which QRS amplitude is relatively low I may note, "overall low voltage" as a descriptive finding. (NOTE: The standardization mark IS present and normal on this tracing - so this indicates that the voltage is not low due to half standardization). Even if present - low voltage is usually not diagnostic of specific conditions (although it may be consistent with COPD/emphysema, large body habitus - and on rare occasions may suggest hypothyroidism, pneumothorax and/or pericardial effusion).
  • There is some baseline wander on the lead II rhythm strip. This is commonly seen - and is often due to respiration.
  • Lead III is interesting and provides an excellent example of teaching when a Q wave is or is not present. There is NO Q wave for the first 3 complexes in lead III (because a tiny-but-real positive deflection precedes the S wave). There IS a Q for the 4th complex in lead III. First point - is that an isolated Q wave IS often a "normal finding" in leads III, aVF and aVL (For review - CLICK to download this PDF - with reminder of which leads may normally manifest isolated Q waves and/or T inversion on the 6th page of this pdf). It is interesting in itself that you will not infrequently see variation in QRS morphology from beat-to-beat in leads III and/or aVF. These are the two "diaphragmatic leads" - and with breathing as the diaphragm moves up and down you'll often see Q waves "come-and-go" in these leads, simply due to respiratory variation.
  • Note that both the P wave and T wave are negative in lead V1 of this tracing. This is normal. The finding of an upright P wave indicating sinus rhythm ONLY holds true for lead II. In lead V1 - the P wave may normally be either positive, negative or biphasic (with initial positive deflection due to RA depolarization - followed by small negative deflection indicating LA depolarization). There are some interpreters who would say the negative P in lead V1 of this tracing qualifies as "left atrial enlargement" because it is negative. Realize that sensitivity and specificity of the ECG for LAE is very poor - such that I undercall LAE my readings, and do not say LAE is present unless the negative component of the P wave in lead V1 is at least 1 full little box deep or wide (or a bit more negative than I see here). I'm also less inclined to call LAE in the absence of other abnormality on the ECG.
  • Finally - there are S waves present not only in all precordial leads (tiny but present in lead V6) - but also in leads I,II,III. As an isolated finding - this is very nonspecific - but I do mention it in my description because normally there should not be any S wave at all in leads V5,V6 (since the depolarization wavefront should be entirely traveling toward to left at this point). Persistence of S waves in leads V1-thru-V6 and/or in leads I,II,III is another marker of potential pulmonary disease (ie, in smokers) - though not as an isolated finding.

Isn't it interesting to find so much to talk about in a "normal tracing" ?

Ken Grauer, MD  www.kg-ekgpress.com   [email protected] 

All our content is FREE & COPYRIGHT FREE for non-commercial use

Please be courteous and leave any watermark or author attribution on content you reproduce.