
Submitted by Dawn on Mon, 05/23/2022 - 15:52
EDIT: Please refer to the comments below this text. The second ECG in this series shows unexpected QRS and ST-T morphology changes, which I tried to explain by way of the patient's long anterior descending coronary artery. However, Dave Richley, who is a very well-known cardiac physiologist and ECG Guru took the time to analyze these morphologies and realize they can be explained by an inadvertent ECG LEAD MISPLACEMENT. This patient does have a proximal lesion of the LAD, proven and repaired in the cath lab. But the inferior wall does not have the injury it appears to have in this second ECG. Thanks to Dave for reminding us to slow down and look closely when things don't look "right".
The Patient: These two ECGs, taken 26 minutes apart, were obtained from a 50-year-old man who complained of sudden onset of chest pain. He denied history of coronary artery disease. He was Covid-positive, and the rest of his medical history was unremarkable.
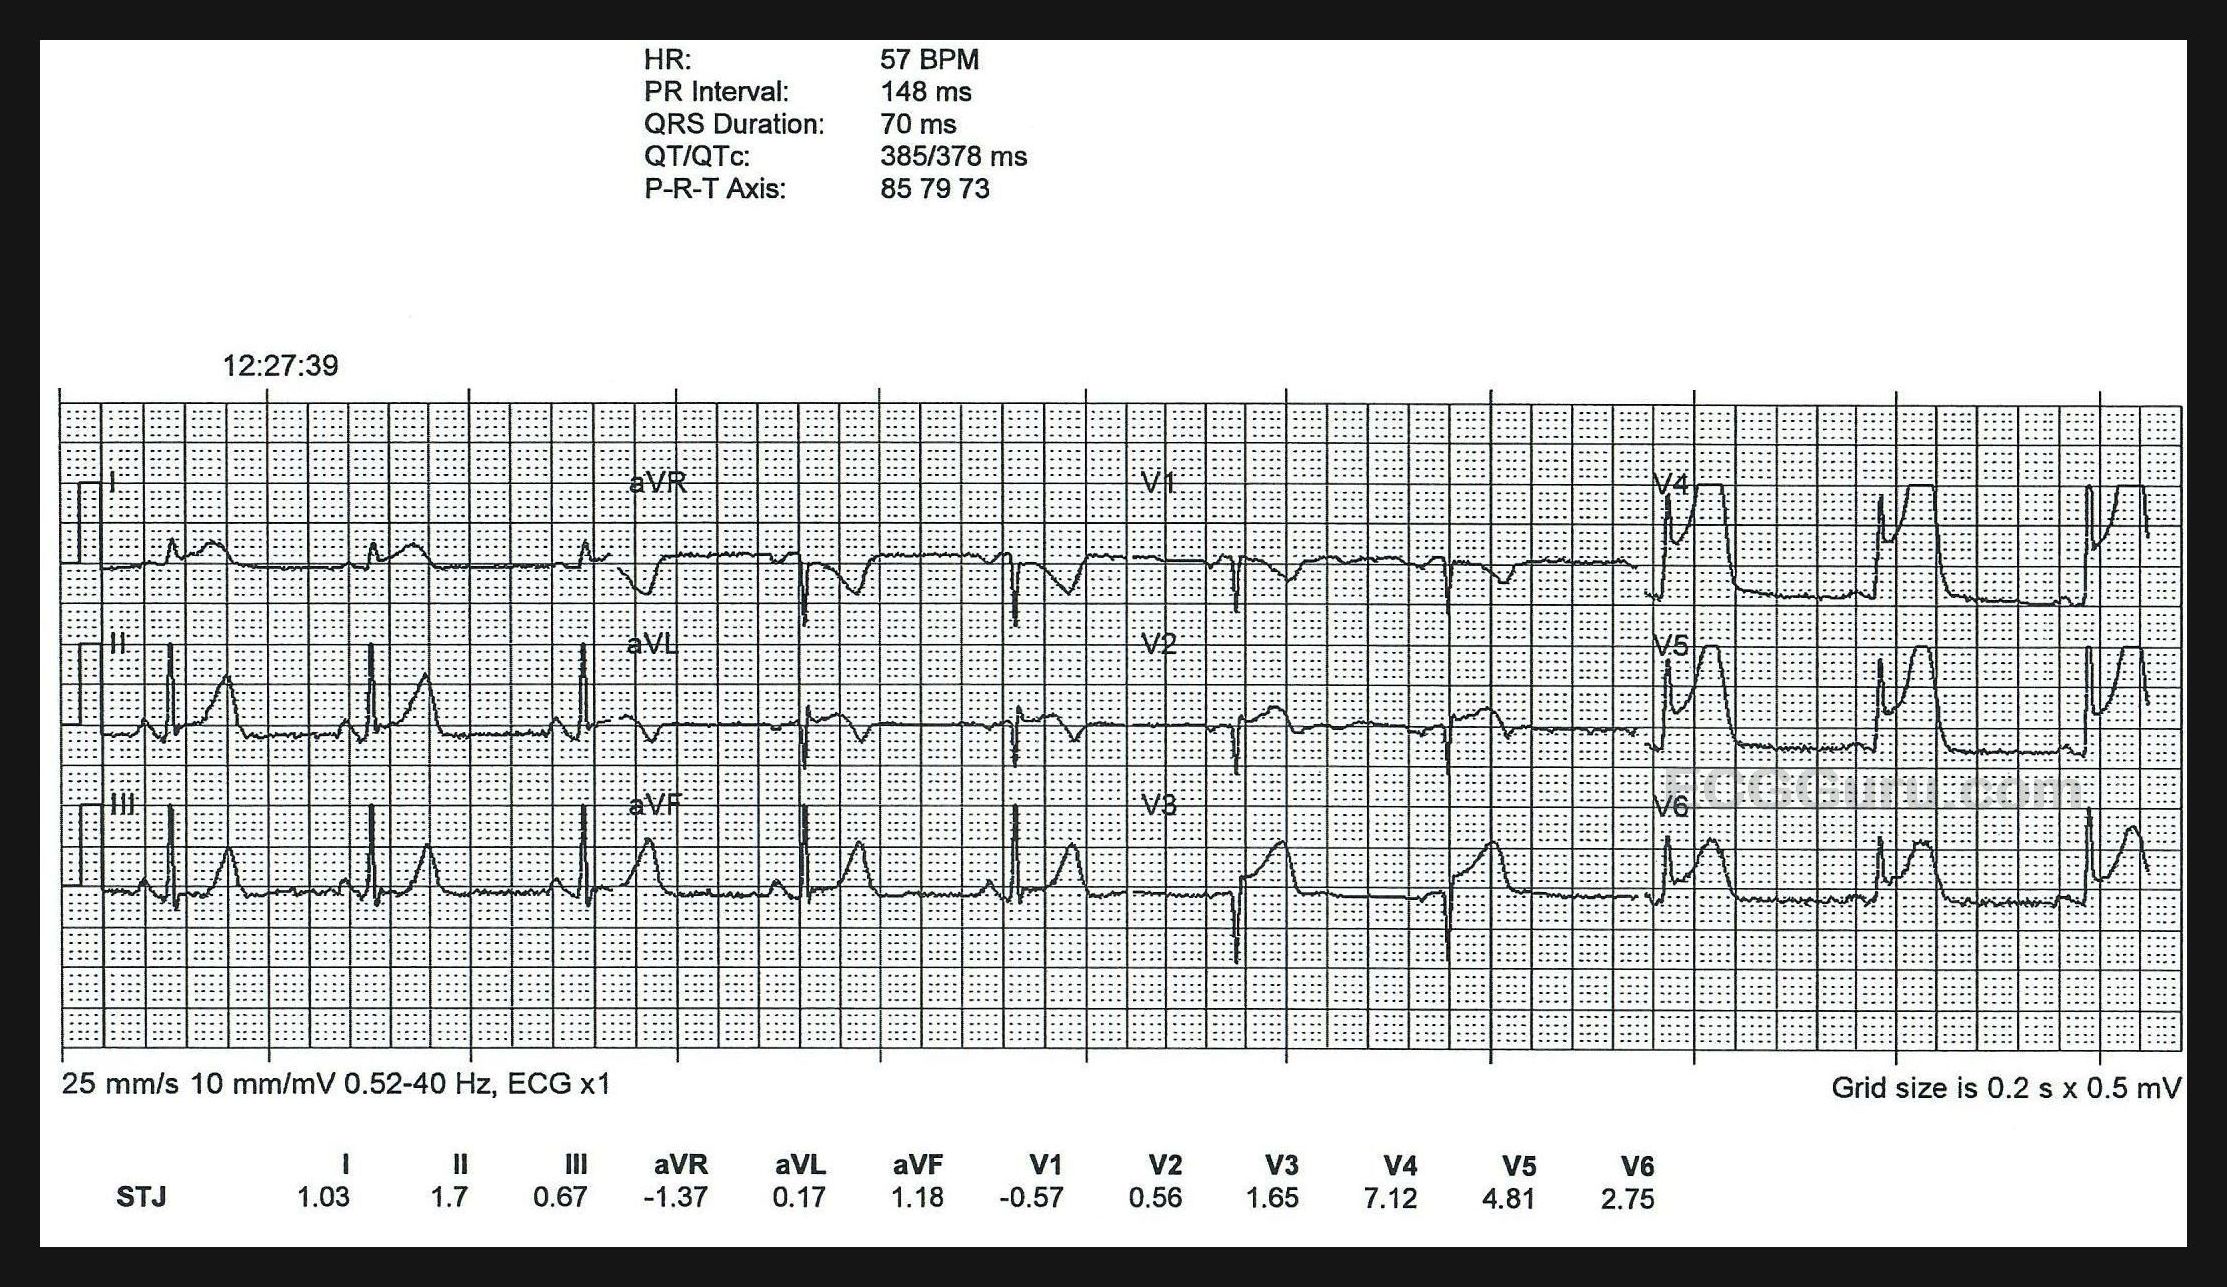
ECG No. 1: This ECG was obtained by paramedics enroute to the hospital. For your beginner-level students, it will be easy to demonstrate the large ST elevations in V3 through V6. The machine’s measurements at the bottom confirm that this ECG meets any field criteria for ST elevation M.I. “STEMI”.
But there is so much more to see! Taking a methodical approach, and starting with rate and rhythm, we see sinus bradycardia at 57 bpm. Intervals and frontal plane axis are within normal limits. R wave progression in the chest leads is stalled in V1- V3 due to loss of initial r waves (narrow QS). The transition to positive deflections in V4 – V6 is abrupt. These q waves in the V1 and V2 appear narrow, but V3 appears to have a Q wave that is almost wide enough to be considered pathological. Narrow Q waves may be a transient sign of injury, while wide ones (>40 ms) are an ECG sign of necrosis.
A very visible finding on this ECG is the hyperacute T waves. Hyperacute T waves are defined by comparison to the patient’s normal T waves, if possible. But a general description is broad-based, symmetrical T waves that are unusually tall in comparison to the QRS complex and to the patient’s previous T waves. In this tracing, we see hyperacute T waves in just about all leads. Hyperacute T waves are a very early sign of subendocardial ischemia in a patient with coronary artery occlusion, and the sign doesn’t last long.
This patient is already progressing to the next ECG stage of ischemia and injury: ST segment elevation. There is elevation in V2 through V6, I and aVL, and very slightly in Leads II and aVF. In addition to this J point elevation, many ST segments have a flat, horizontal shape, which is an abnormal sign, indicative of ischemia. Leads III and aVF are good examples of this abnormal ST segment shape. V1 has an inverted T wave. V2 shows the T wave transition to upright.
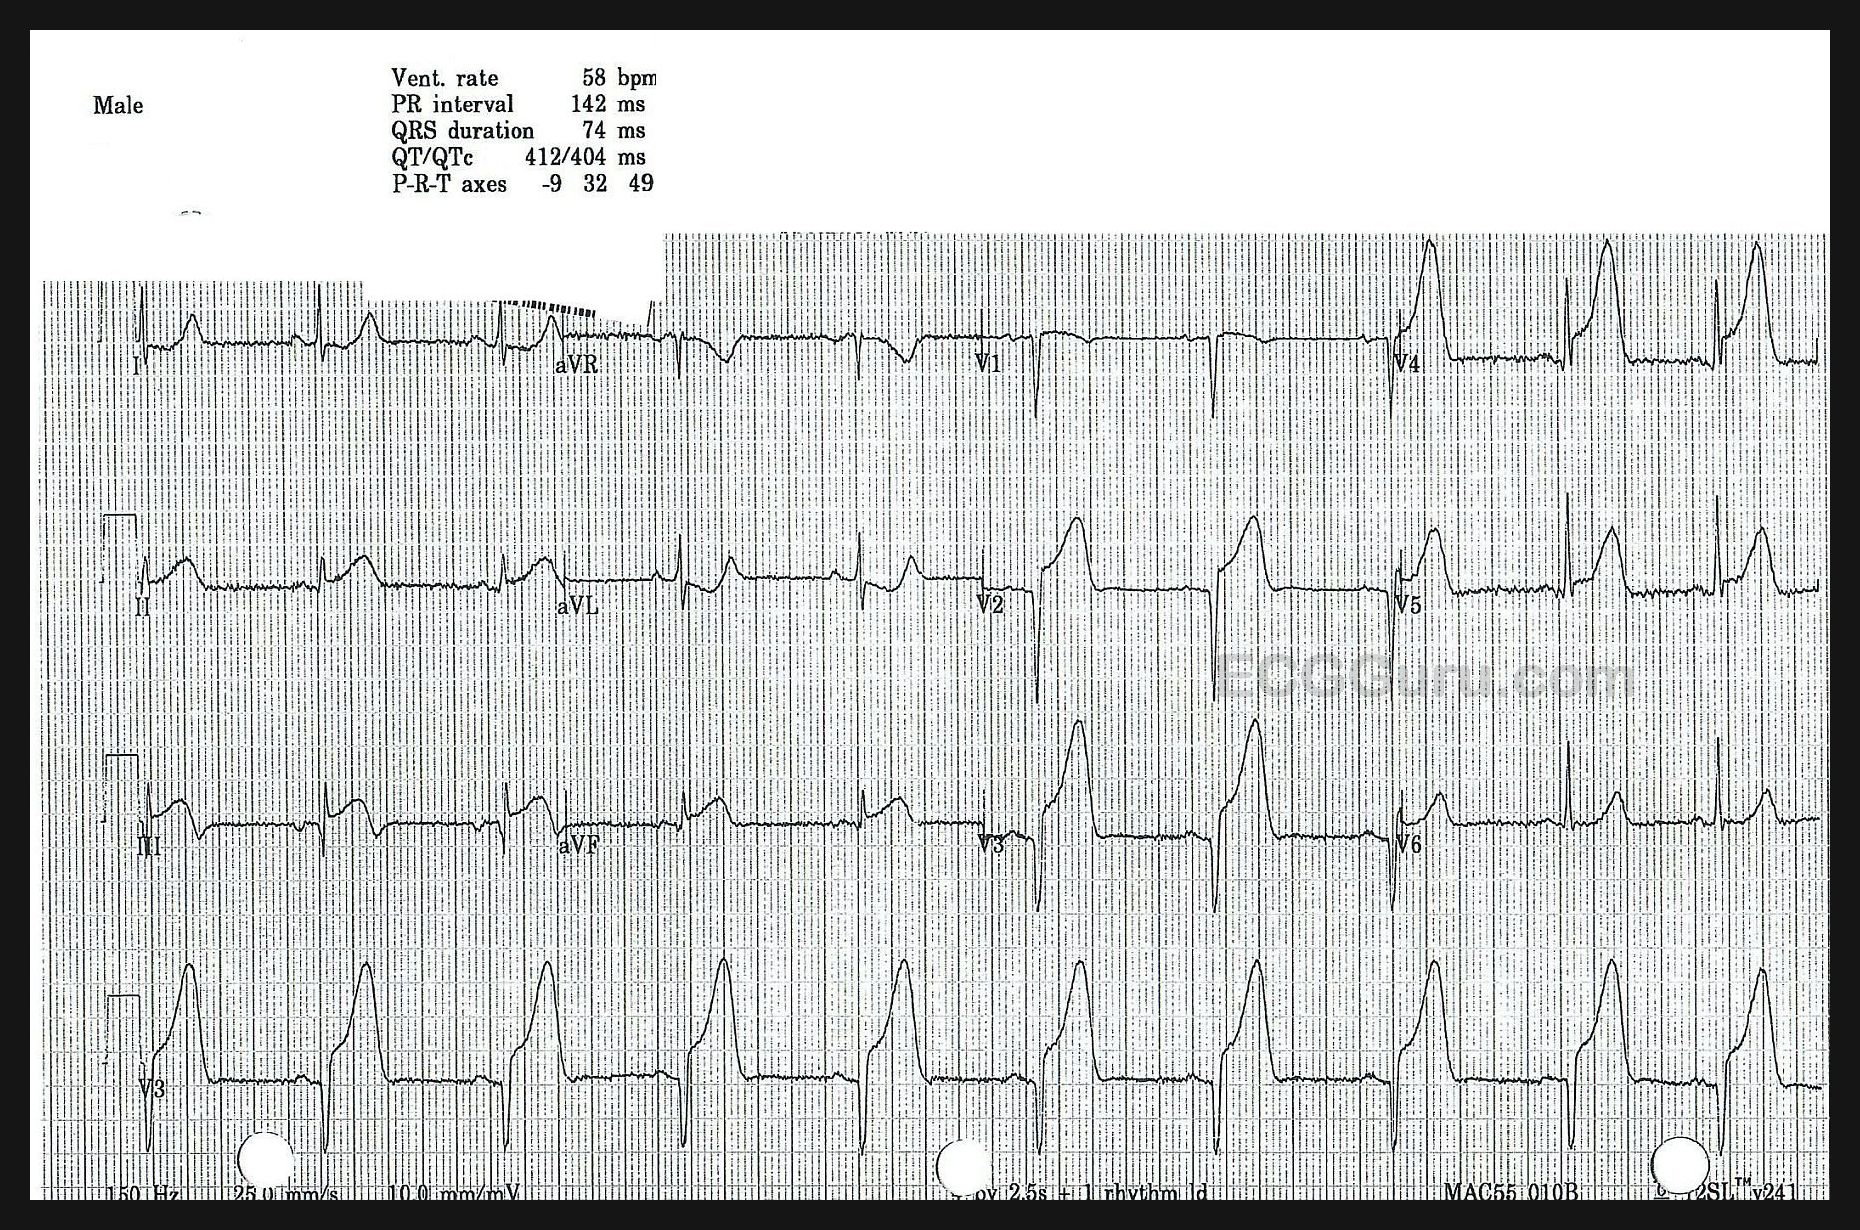
ECG No. 2: This ECG was taken in the Emergency Department, 26 minutes after the first one. The rate and intervals have not changed much. The QRS duration has lengthened by .04 seconds, the QTc has prolonged by 26 ms. The axis has shifted slightly to the left, but still within normal limits.
Leads II, III, and aVF (inferior wall) have lost voltage and gained quite noticeable ST segment elevation. Lead III has a narrow Q wave and biphasic T wave, which are new developments. Leads I and aVL are now so influenced by the STE in the inferior wall, they show ST depression, which is reciprocal to the elevation in the inferior leads. It has obliterated the ST elevation in those leads, but we remember it is there!
Lead V1 has developed concave-down elevation (the “frown”), and has a narrow Q wave. V2 and V3 have enhanced ST elevation, and the Q waves in those leads have widened to greater than 40 ms. Leads V5 and V6 have less ST elevation, possibly influenced by simultaneous reciprocal ST depression. We can say that this M.I. has definitely progressed, and it is VERY large.
Follow Up: The patient was taken very quickly to the cath lab, where it was found that he had a proximal LAD occlusion from a fresh clot. The other arteries showed no signs of CAD. You might be thinking, “that explains the changes in the chest leads (anterior wall), but how is the inferior wall involved in this M.I.?” This patient is one of the many people (up to 79% of the population) who has a wrap-around LAD. That is, it perfuses the apex of the left ventricle. Approximately one fourth of the population has an LAD that wraps around more than one fourth of the inferior wall. This type of LAD predicts additional risk of adverse clinical outcomes for M.I. patients because of the large amount of territory covered by this wrap-around artery. The patient arrived in the cath lab before his troponin levels went up, and had a successful procedure. He is lost to follow up after that.
Related Terms:
Rate this content:
All our content is FREE & COPYRIGHT FREE for non-commercial use
Please be courteous and leave any watermark or author attribution on content you reproduce.
Comments
Extensive STEMI with Successful Reperfusion
There is no "suspense" in reading the ECGs in today's case — as this extensive STEMI can be identified from across the room. I'd add the following comments regarding this case.
I was surprised to learn that despite large inferior and anterior Q waves, in association with marked ST-T wave changes — troponin was not elevated at the time this patient went to cath.
Unfortunately — the patient was lost to follow-up. Troponin elevation may take a little while. I would bet that despite successful PCI — that subsequent troponin levels were significantly elevated.
Regarding Q waves (including QS waves) — on occasion large Q waves may develop in as short of a period of time as 1-2 hours after the onset of symptoms. While true that the bigger and wider and more extensive Q waves are, the greater the likelihood of myocardial necrosis — Q waves can sometimes reverse! For this reason — it would have been insightful to see another ECG following successful PCI.
Hopefully this patient did well. On the positive side — what went well was rapid access to the cath lab — with successful reopening of the "culprit" artery. What we do not know is whether coronary reperfusion was timely enough to result in a positive longterm outcome.
Ken Grauer, MD www.kg-ekgpress.com [email protected]
What a really interesting set of ECGs!
Dawn...
Thank you for this great teaching example for anyone - from newbie to advanced!
As both you and Ken alluded - there is no question of what is happening here. This is a typical occlusion of a Type 3 ("wrap-around") LAD. Many of those new to ECG interpretation may not have been aware that ALL THREE coronary arteries (RCA, LCx, LAD) can cause an inferior MI (actually "acute epicardial ischemia"). And if you are thinking that this type of LAD is a "rare bird," think again. Eighty per cent of the population have a "wrap-around" LAD (I recently found out that I do!).
A proximal occlusion of a "wraparound" LAD can be a very tricky and dangerous situation because the person reading the ECG may be fooled into thinking that it is simply a distal occlusion of a Type 1 or Type 2 LAD, which is usually considered a small area at risk and not nearly as dangerous as a proximal LAD occlusion. That's because the injury current vector over the high lateral area of the left ventricle (covered by Leads I and aVL and now called the "basolateral" area) is directed opposite the injury current vector overlying the inferior wall, covered by Leads II, III and aVF. Those two vectors pointing in opposite directions can cancel each other and all that may show up on the 12-lead ECG is some ST elevation in Leads V5 and V6. Quite a different - but erroneous - picture!
But is this truly a proximal occlusion (as seen on the ECG) or an occlusion distal to the first diagonal branch? I ask that because there is something else very interesting and a bit puzzling here. Look at Leads I and aVL in the first ECG recorded by the paramedics. There is ST elevation in both leads. But just 26 minutes later, there is ST depression in both leads! What's happening here - in the span of just 26 minutes?
The basolateral ("high lateral") wall of the left ventricle is supplied with blood from two sources: the first diagonal branch of the LAD and the LCx (left circumflex). There are several possible explanations here ranging from probable to possible to outlandish (but still possible):
1. The occlusion was very near the ostium of the first diagonal branch but shifted just slightly more distally, opening the first diagonal and allowing circulation to the basolateral area but continuing to occlude the rest of the myocardium served by the LAD. (Probable)
2. Collaterals from the LCx opened and provided enough circulation to reverse the ischemia of the basolateral area and allow Leads I and aVL to react reciprocally* to the inferior ischemia. (Possible)
3. The ST elevation in the inferior leads became so great that it caused such a reciprocal change in Leads I and aVL that it reduced their ST elevation to ST depression, with ischemia of the basolateral area still persisting unchanged but hidden. (Outlandish, but definitely possible because I have seen it happen!)
* For an area of myocardium to react reciprocally to an ischemia opposite it, that area itself must not be ischemic.
So readers - do you have any other explanations to offer? All three of us will be glad to respond to your suggestions and/or questions. This is a site for learning how to read and interpret ECGs - you won't get any snide or curt remarks here. If you are a beginner, believe me when I tell you that I can remember not being sure whether I was holding the ECG rightside up or upside down! We all started at the very beginning.
Jerry W. Jones MD FACEP FAAEM
https://www.medicusofhouston.com
Twitter: @jwjmd
New explanation
Sorry, I’m late to the party but this is an interesting pair of ECGs and Jerry Jones, after his detailed analysis, asks if readers have any other explanations to offer. Well, I think I have!
My guess is that the left arm and left leg connections were inadvertently swapped for the 2nd ECG. This has the effect in the standard leads of swapping the lead I and lead II recordings and inverting lead III. The clue that this has happened is that the P wave is bigger in ‘lead I’ than in ‘lead II’ and the P wave is negative in ‘lead III’, and this is what we see here. If we compare the two ECGs we can see that lead II in the 2nd ECG is very similar to lead I in the first, and lead I in the 2nd ECG is similar to lead II in the first, but with evolution of the ST segments. If we invert the lead III recording in the 2nd ECG, the new Q wave disappears and the ST elevation becomes ST depression that is presumably reciprocal to the ST elevation in I and aVL that is seen in the 1st ECG. Turning to the augmented limb leads, the effect of the erroneous limb connections is that aVR is unchanged but aVL and aVF swap places. This would restore the ST elevation to aVL and show downsloping ST depression in aVF. One unexpected finding is that the deep Q wave in aVL that is present in the 1st ECG would not be seen in the corrected 2nd ECG but I would attribute this to a change in torso position (eg change from sitting to lying) or a change in limb electrode positioning (eg from torso to wrists). The Q wave in aVL in the first ECG never looked pathological, as it is sharply inscribed, narrow and not accompanied by a Q wave in lead I.
I think therefore that both ECGs show essentially the same pattern but with evolution of the ST segments in the 2nd ECG.
Corrected ECG
In relation to my comments above, I have re-arranged the 2nd ECG so that it appears as it would have done had the limb lead connections been correct.
On second thought, I agree with Dave Richley!
Dave...
What a very astute observation (and thanks for speaking up)! Your explanation certainly explains the change in the ST deviations in Leads I and aVL. I did not notice the P wave change (time for new glasses, I guess!).
Let this be a lesson to all - we LEARN when more voices are heard!
Jerry W. Jones MD FACEP FAAEM
https://www.medicusofhouston.com
Twitter: @jwjmd
Thank you, Dave Richley
Dawn Altman, Admin
More on LA-LL Lead Reversal ...
YES! — as per David Richley — there was LA-LL Lead Reversal. The most common type of lead reversal is LA-RA — and that one is EASY to spot, because there is global negativity (of P,QRS,T) in lead I. I still get “caught” on LA-LL Lead Reversal, which perhaps is the 2nd most common lead reversal. I was simply too quick in my initial interpretation … The frustrating part for me — is that I had just picked up and written about a case of LA-LL Lead Reversal that very week in My Comment on Dr. Smith’s ECG Blog of 5/26/2022. For illustrative purposes — I am posting here the illustration I made in that post, that synthesizes what happens with LA-LL Reversal — and what “correcting for this” looks like. (My detailed comment is at the bottom of the page in this 5/26 post — GO TO — https://hqmeded-ecg.blogspot.com/2022/05/does-single-troponin-below-99th... ).
As per David Richley — the KEY is to recognize that the P wave in lead I is larger than the P wave in lead II, which should not happen with a normal sinus rhythm.
BOTTOM LINE: I’ve preached to “Be Systematic” in one’s interpretation for decades. My oversight of LA-LL Reversal illustrates what happens when one let’s down one’s guard … THANKS (as always) to “Eagle Eye” David Richley for correcting this! — :)
Ken Grauer, MD www.kg-ekgpress.com [email protected]
TEST
This is a test to see if I can paste text with formatting.
• I have no idea if this will work.
We will see.
END of test!
Ken Grauer, MD www.kg-ekgpress.com [email protected]