
Submitted by Dawn on Fri, 02/05/2021 - 21:11
This pair of ECGs feature one of our recurring themes: wide-complex tachycardia (WCT). It is a fascinating topic, as tachycardia has many causes and many mechanisms, and wide QRS also has many causes, with the mechanism being slow conduction through the ventricles.
Sometimes, it is not possible to diagnose the true origin of a WCT from one ECG, or even serial ECGs. Is the tachycardia due to increased sympathetic activity (fear, dehydration, exercise, hypoxia, hypovolemia, etc.)? Or is the fast rate due to reentry, where one impulse gets “caught” in a loop, repeating itself rapidly, and depolarizing the myocardium with each pass? What is the location of the pacemaker that is responsible for the rhythm? Is it a supraventricular rhythm that has suffered an intraventricular conduction delay, widening the QRS? Or is the rhythm originating in a ventricular pacemaker, without the ability to travel on the fast highway that is the intraventricular conduction system?
If you or your students work in an acute care setting, such as pre-hospital or emergency department, you may not be with the patient long enough or be able to conduct enough tests to determine without a doubt the answers to the above questions. Some WCTs cause such severe symptoms that they must be dealt with quickly, to avoid rapid deterioration to ventricular fibrillation. For that reason, there is a widely-accepted rule for WTC treatment:
TREAT ALL WIDE-COMPLEX TACHYCARDIA AS IF IT IS V TACH UNTIL PROVEN OTHERWISE.
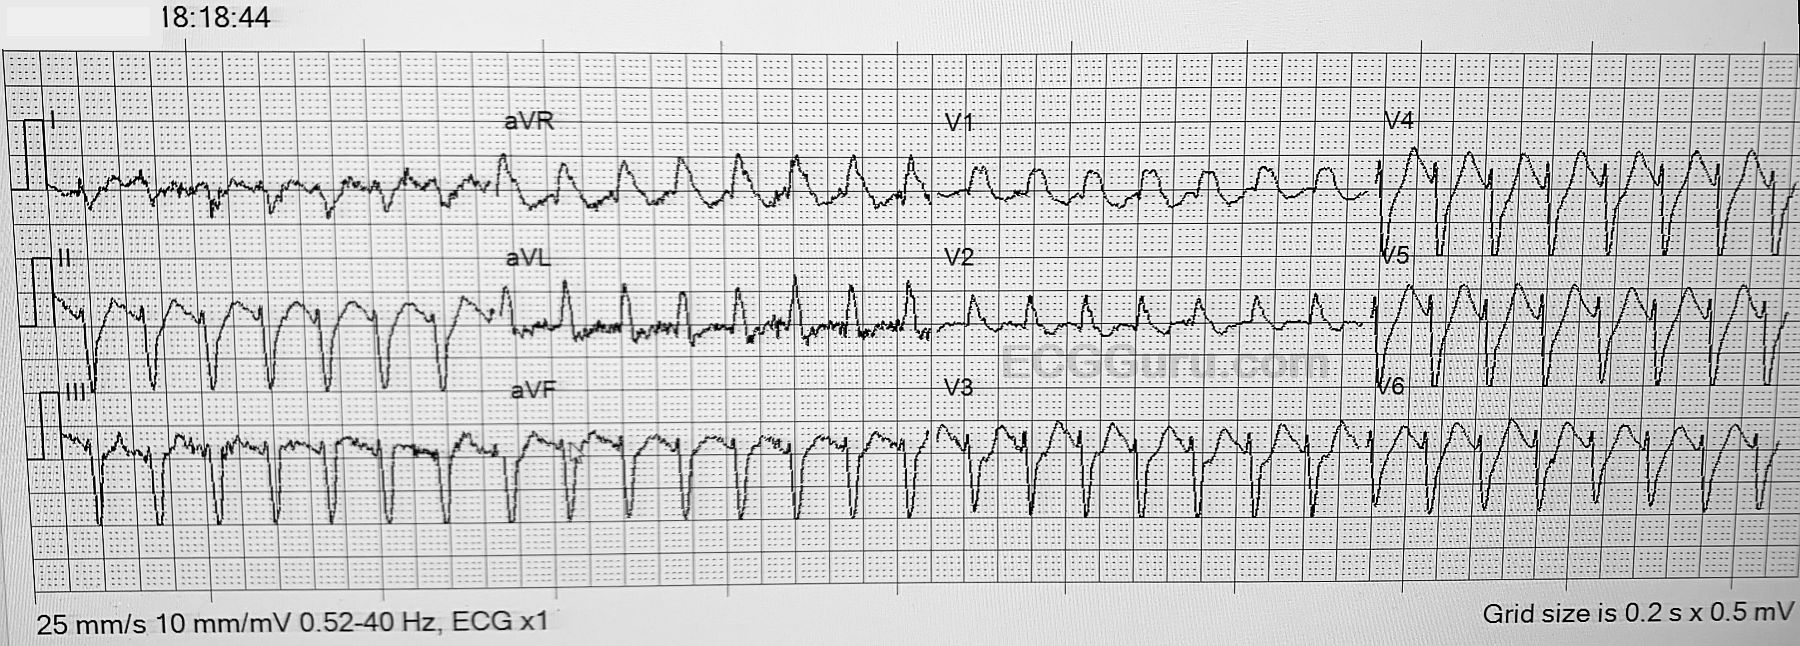
The Patient: These two tracings were taken from an elderly man who complained of feeling sick. He was found by paramedics to be alert, diaphoretic, tachypneic, and complaining of palpitations. His initial vital signs were: BP 80/60, Pulse 167 and regular, respirations 30/min. Pulse oximetry 96%.
ECG No. 1 at 18:18:44 The rhythm is regular at 167/min. The QRS width is about .12 seconds (120 ms). It is difficult to measure the QRS width with precision due to artifact and slurred terminal portions of most of the QRS complexes. No clear P waves are seen, possibly due to the rate causing P-on-T. Several features of the QRS morphology suggest VENTRICULAR TACHYCARDIA, including the extreme axis (almost vertical), and the negative deflection in Lead V6. When V tach has this pattern: a minimally-wide QRS with a right bundle branch block pattern, it is usually “fascicular ventricular tachycardia”.
Initial Treatment: Because of the patient’s hemodynamic instability and symptoms, the EMS crew elected to follow the above rule and treat this rhythm as VENTRICULAR TACHYCARDIA. He was administered Amiodarone 150 mg IV while the crew prepared to cardiovert him under light sedation. As soon as they were able, he was cardioverted with 120 j. The new rhythm is shown in ECG #2.
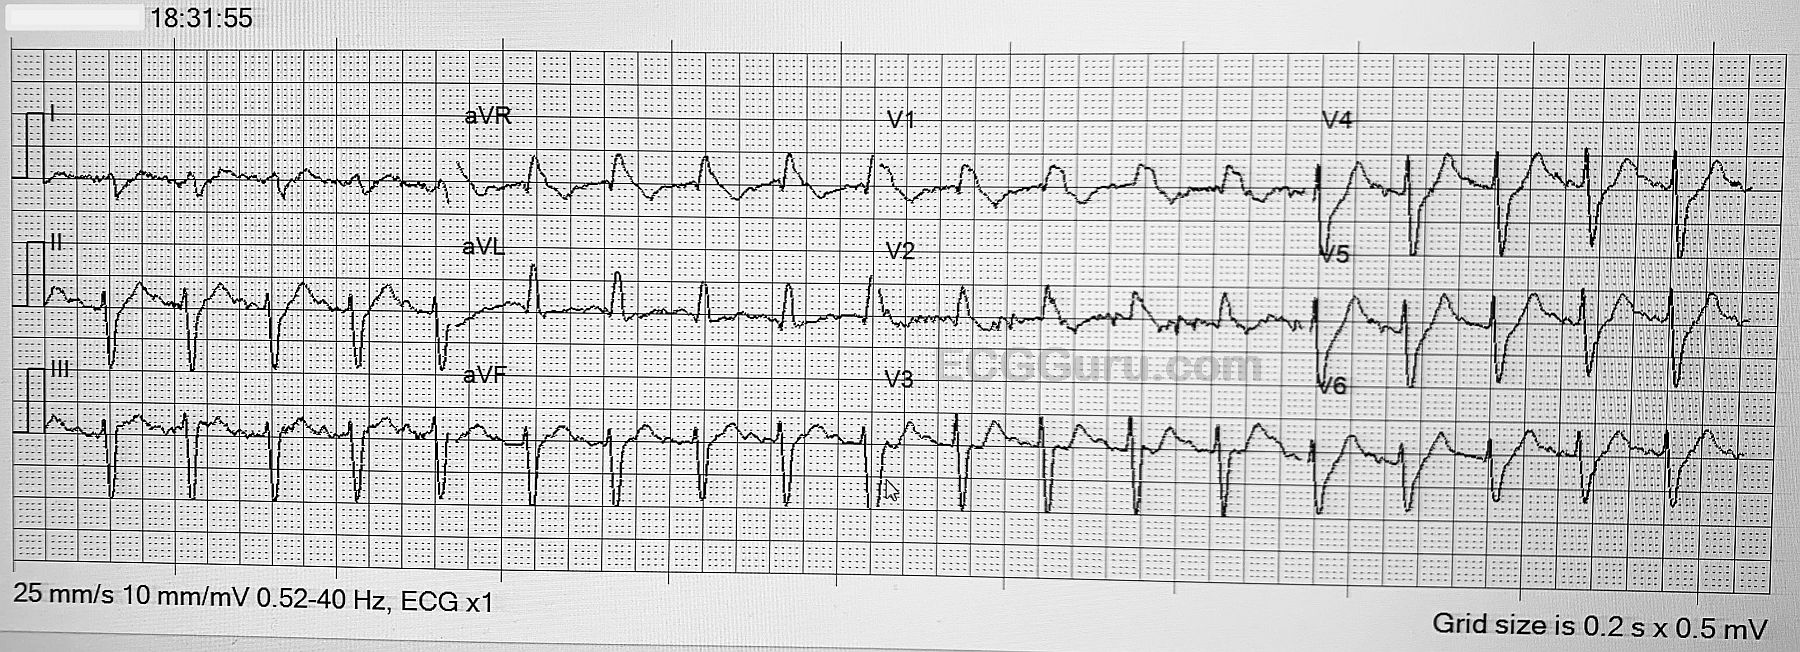
ECG No. 2 at 18:31:55 The patient’s rhythm remains regular at about 130 / min. Respiratory rate 20/min. and unlabored. BP 92/58. Pulse ox: 97% on nasal O2.
The most interesting finding is the QRS morphology has not changed. The width is still .12 sec., and the axis and other features of the QRS complexes are the same as they were in the faster rhythm. In addition, in spite of the artifact, I feel that P waves are present. A cleaner ECG might prove it, but I am confident of the P waves in Leads II, III and V3. I will readily admit that a clear, artifact-free ECG might prove me wrong. If this is SINUS TACHYCARDIA, the first ECG was most certainly not V Tach, because the QRS complexes haven’t changed. If we accept that there are P waves, the first rhythm was paroxysmal supraventricular tachycardia. The wide complexes would be due to right bundle branch block and anterior superior fascicular block (also called hemiblock). The RBBB causes rSR’ pattern in V1 and wide S waves in I and V6, and explains the slightly widened QRS.
The fascicular block causes the extreme left axis shift.
If you don’t see P waves, then we would have to explain how the cardioversion changed the rhythm from a “fast V Tach” to a “slow V Tach.”
Patient Outcome: The crew, by treating this WCT as V tach, obtained a quick improvement in the rate, which helped with the symptoms. Amiodarone and cardioversion are both appropriate treatments for V tach and PSVT.
The patient was diagnosed at the hospital with “arrhythmia due to an infection, combined with effects of a weight-loss medication”. He had a cardiac catheterization which was negative for significant coronary artery disease. We have no information on the diagnosis of the arrhythmia, or what his ECG looked like on discharge, one week later.
As always, we welcome your comments and opinions on this case.
Many thanks to Lt. Curtis Jepsen for donating these tracings.
Related Terms:
Rate this content:
All our content is FREE & COPYRIGHT FREE for non-commercial use
Please be courteous and leave any watermark or author attribution on content you reproduce.
Comments
Challenging Artifact-Laden WCT Tracing Without Definitive Answer
Fascinating case because of the difficulty in figuring out what is going on. This is what happens with “real life tracings” — in which acutely ill patients may not allow obtaining the artifact-free ECG that we seek.
My assessment mirrored Dawn’s throughout the case. I thought the initial ECG represented a regular WCT ( = Wide-Complex Tachycardia) at ~170-180/minute, without clear sign of P waves. Inability to define the limits of the QRS complex made me question a ventricular vs supraventricular etiology, without clear answer. The frontal plane axis was indeterminate (predominantly negative in leads I and in all inferior leads) — but the presence of a tiny-but-real initial r wave in all leads greatly reduced the diagnostic utility of this frontal plane axis deviation. It is only when the QRS complex in either lead I or lead aVL is entirely negative — that frontal plane axis becomes strongly predictive of VT.
QRS morphology in lead V1 is upright, which is consistent with RBBB (as are the terminal wide S waves in lateral leads) — but the QRS complex in lead V1 looks more like a “blob” than an RBBB pattern. And, the initial r wave deflections in leads V3-thru-V6 were narrow — which weighed against VT. Finally — I was undecided about how much of the seemingly widened S waves in leads V3-thru-V6 might actually reflect ST segment depression.
BOTTOM LINE: Given that this elderly patient had signs of hemodynamic instability — I agreed with the initial management approach of IV amiodarone and synchronized cardioversion.
I once again shared Dawn’s concerns on seeing the post-cardioversion ECG. As per Dawn — QRS morphology was virtually unchanged despite clinical improvement, reduction in heart rate — and what also looked to me despite the artifact, as probable sinus P waves in the inferior leads. This led me to the same conclusion as Dawn — that this patient was not adequately perfusing with his initial wide-complex rhythm because of AVNRT at ~170-180/minute — and that the result of amiodarone followed by synchronized cardioversion appears to have been restoration of sinus rhythm.
FINAL THOUGHT on the ECGs: I almost wonder if Brugada phenocopy was superimposed on underlying RBBB — as this might account for the bizarre QRS morphology we saw in lead V1. Alas, answers to my curiosity require the follow-up tracings that unfortunately are not available to us.
MORAL of Today’s Case: Definitive answers are not always possible with “real” cases. Sometimes clinical management decisions have to be made without being certain of the etiology of the initial rhythm, as was true in this case. IV Amiodarone and synchronized cardioversion were indeed appropriate measures in today’s case, even though we were in no way certain of the initial rhythm.
Ken Grauer, MD www.kg-ekgpress.com [email protected]
WCT mystery: How to diagnose and treat
I spent an hour tonight reading an old issue of "Heart Rhythm Journal (July 2010, Vol 7, Issue 7) plus some follow through on lifeingthefastlane.com, where the topic was R-Wave Peak Time in Lead II, to help differentiate VT & SVT. On ECG #1, the RWPT on Lead II is clearly less than .50 ms (which favors SVT). The patient was clearly unstable and acutely symptomatic thus guiding the EMT's to opt for amio and cardioversion; luckily achieving a slower heart rate looking like S. Tachycardia. My guess is that it was an Atrial Tachycardia but the quality of ECG's obtained in the field do often have a lot of artifact.
Great presentation!
Pete Hupp
Good observation
Thanks, Pete. They more we look at this, the more the consensus is "SVT". When I saw the QRS morphology unchanged after conversion to a new rate, I was convinced. But, it is always good for us to remember that it might require some investigation to determine the "real" interpretation. And we all agree that, in an EMS setting, it is best to assume the rhythm is VT. Nearly all EMS "VT" protocols are really "WCT" protocols. As you pointed out, the treatment for the unstable VT patient and the unstable SVT patient is the same, and it resulted in a good outcome for the patient.
Thank you so much for taking the time to add to this discussion.
Dawn Altman, Admin
specificity
Thiis today's case demonstreates that most criteria for VT are not perfect (low specificity) when the patient's baseline ECG (I assume that the ECG during sinus rhythm was patient's baseline tracing) shows conduction abnormalities.
Thanks for presenting!
Mario Parrinello
Thank you, Mario
Important point. Thanks.
Dawn Altman, Admin
Great "Real Life" Tracing!
Very interesting case, Dawn. I like seeing ECG tracings that are less than pristine because that is what you get in real life. I include them in my classes. My initial feeling was that this represented an SVT. There were a number of small r waves (as Ken pointed out) in left-sided leads which indicated an impulse traveling from right-to-left and less convincing of ectopy (in my experience ectopic depolarizations aren't likely to change directions 180 degrees!). The downslopes of the S waves were quite straight and relatively smooth. The cardioversion to the same QRS morphology indicated an AVNRT to me as well. Cardioversion would be very unlikely to work on an atrial tachycardia unless it were a very rare reentrant type (most are automatic and immune to cardioversion).
I agree with Mario in that all algorithms and methods have their shortcomings. Personally, I hesitate to use any single-step method because that is putting all the patient's eggs in one basket. And the Lead II R Wave Peak Time is slightly prone to diagnose v. tach as SVT - a very dangerous situation.
Keep up the good work and I enjoyed finally meeting you "in voice" during the webinar! (I'm still working on my ZOOM skills.)
Jerry W. Jones MD FACEP FAAEM
https://www.medicusofhouston.com
Twitter: @jwjmd