
Submitted by Dawn on Sat, 08/22/2020 - 15:33
The Patient: These tracings are taken from a 75-year-old man who became weak while playing golf on a very hot day. He was pale and diaphoretic. He was hypotensive, but we do not know his BP reading. He denies chest pain or discomfort. The patient reported a history of lung cancer and hypertension. We have no other history, and unfortunately, no follow-up information.
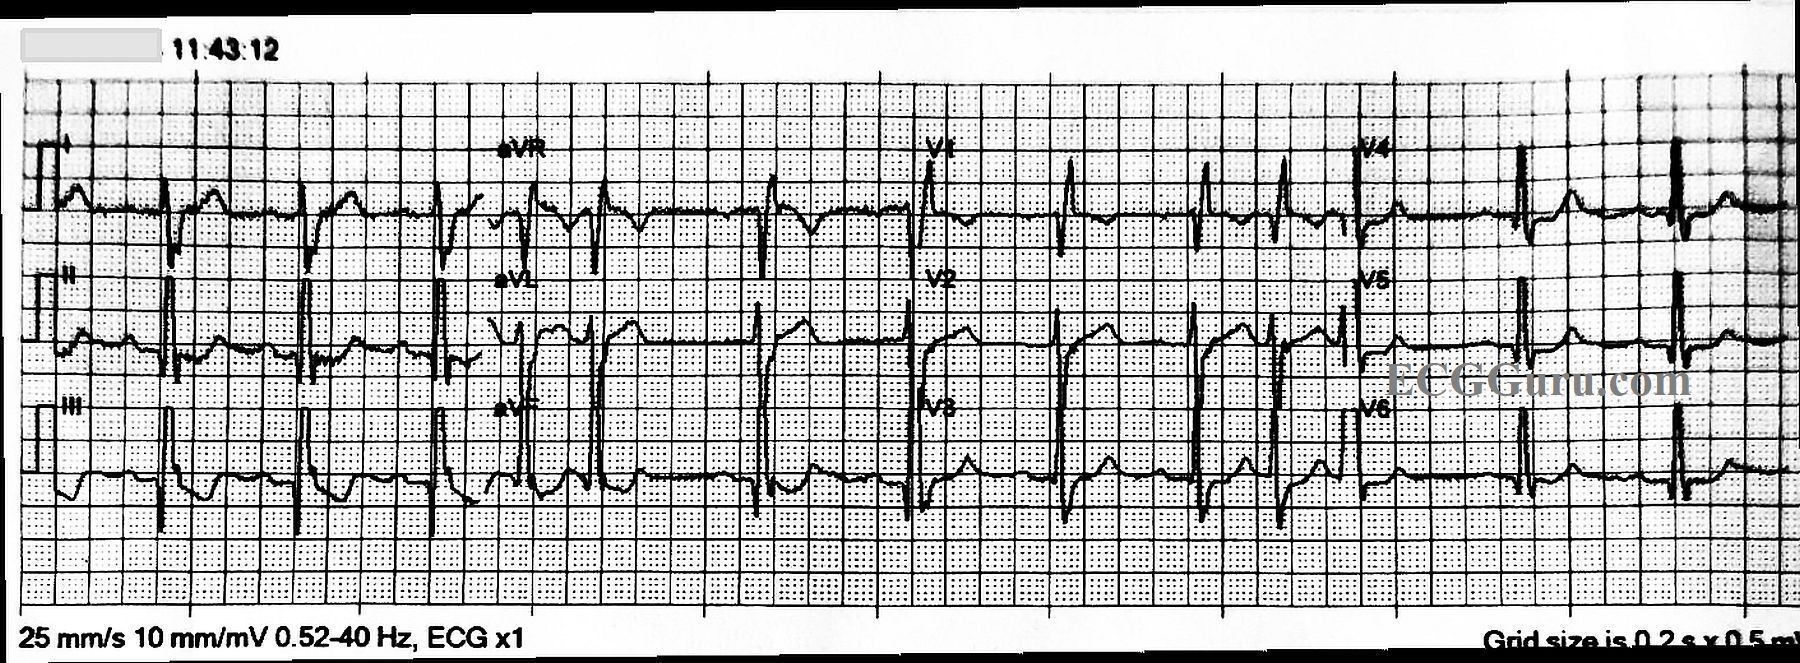
ECG Number 1: The first ECG shows the standard 12 leads. The rhythm is sinus with frequent appearances of PAC couplets. The sinus rate varies slightly from about 76 bpm to 68 bpm, tending to slow a bit after the premature atrial contractions. There is a right bundle branch block, and the QRS duration is about .12 seconds (120 ms). The PR interval is slightly log at 223 ms. We do not know what medications the patient is on, and we do not have an older ECG for comparison.
There are some interesting, if subtle, changes worth mentioning. The QRS complexes in most leads are fragmented. That is, they have notching in the terminal S or R waves that is not due to the bundle branch block. This can be a sign of scarring, and can also be considered an equivalent to a pathological Q wave. Speaking of pathological Q waves, they are seen in the inferior leads, II, III, and aVF. There are also prominent, though not large Q waves in V4 through V6, leads which normally do not have them. All this points to scarring and possibly long-term coronary artery disease, with possible old M.I. In addition, the ST segments are not entirely normal. There is ST depression in the inferior and low lateral leads, a little ST elevation in aVL. Also, the SHAPES of the ST segments tend to be straight throughout the ECG, instead of the usual curved (concave up) appearance.
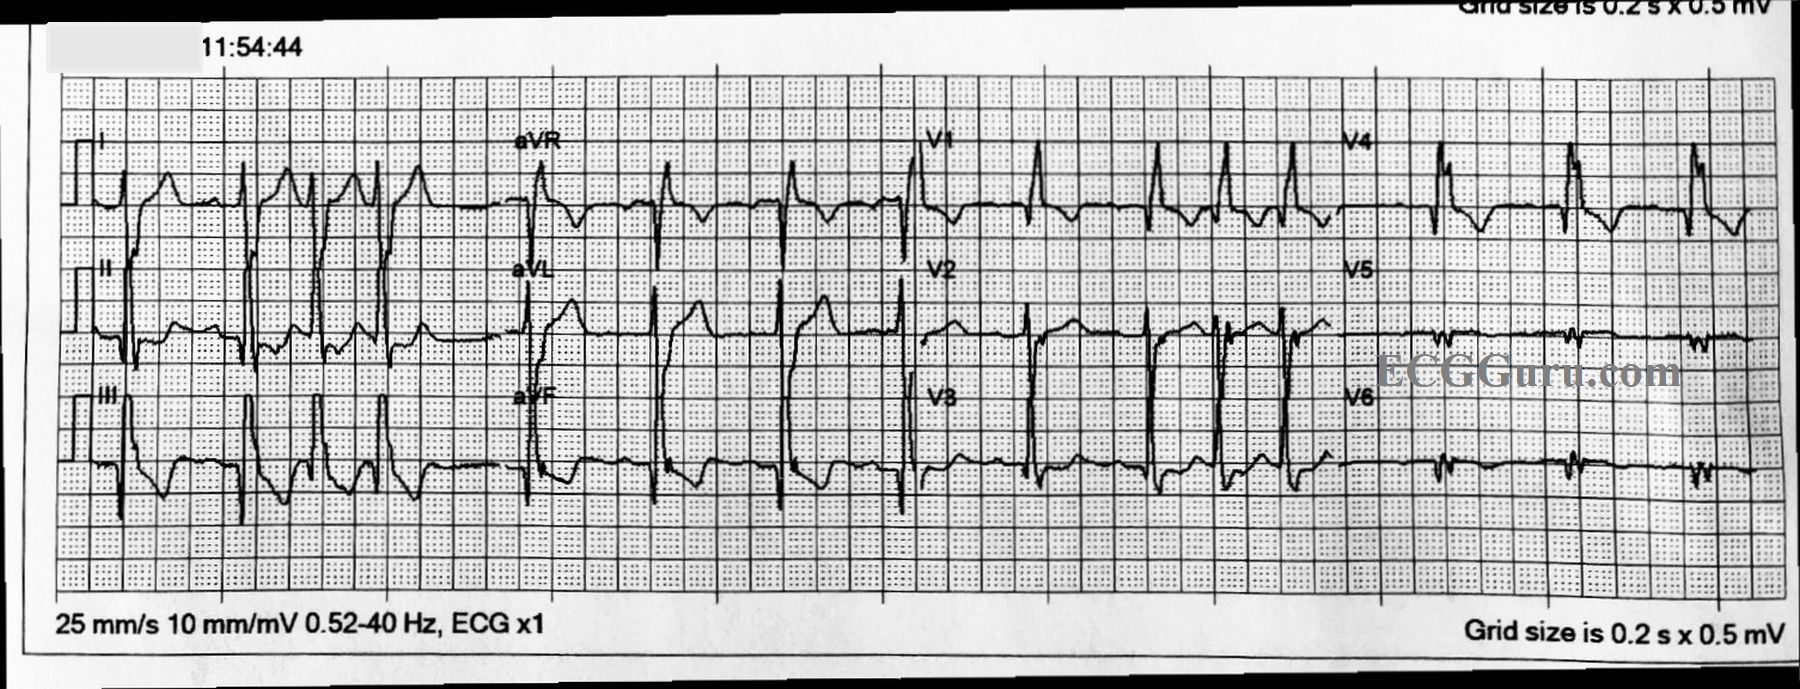
ECG Number 2: The second ECG was obtained with three additional leads, to search for ST elevation that might have been missed by the standard 12 leads. V4, Right has been added in place of V4. V8 and V9 have been added to the V5 and V6 positions on the print out. V4R shows us a pathological Q wave and fragmentation. The posterior leads do, too, and the ST segments are very flat and slightly elevated.
Conclusion: Without further evaluation of the patient, and comparison with previous ECGs, it would be very difficult to assign significance to these changes. Because of his symptoms, he was transported by EMS to a hospital. For teachers, this is a good example of PAC couplets for your beginner students, and a chance to discuss QRS fragmentation, pathological Q waves, and ST segment shape with your more advanced students. Also, the value of additional leads to rule out ST elevation M.I. should be emphasized.
Related Terms:
Rate this content:
All our content is FREE & COPYRIGHT FREE for non-commercial use
Please be courteous and leave any watermark or author attribution on content you reproduce.
Comments
No Chest Pain Despite a Worrisome ECG
I found this case interesting in several regards. The patient is a 75-year old man who presented with new weakness + hypotension — but no chest pain. Unfortunately, additional details and follow-up are lacking in this case — but it nevertheless makes for an illustrative ECG.
ECG #1 (TOP tracing in my Figure — Please SEE attached!) — As per Dawn, the initial ECG was obtained using the standard 12 leads. The rhythm is sinus with 1st-Degree AV Block (PR ~ 0.22-0.23 second) + PACs. There is RBBB (QR’ in lead V1 with wide terminal S waves in both leads I and V6). Dawn also noted infarction Q waves in a number of leads + ST-T wave abnormalities, including slight ST elevation in lead aVL. I’ll expand on these and some additional points below.
NOTE — Many of the leads on this tracing are truncated (SEE the separation between ascending and descending parts of the tall R waves — within the thin RED circles). Many EMS ECG monitors are limited in the amount of voltage that they are able to record. It is important to be aware of this technical finding — because you might otherwise think ST-T waves are disproportional (therefore hyperacute) with respect to the truncated dimensions of associated R waves in these leads (Please scroll down to the bottom of the page in the June 20, 2020 post of Dr. Smith’s ECG Blog for My Comment — in which I explain and illustrate this technical finding in detail).
In addition to RBBB and 1st-Degree AV Block — there is also LPHB (Left Posterior HemiBlock) — as defined by presence of a deep and very steep S wave descent in lead I in association with qR complexes in each of the inferior leads. In the absence of a prior ECG for comparison — we have NO idea as to which element(s) of these conduction defects are new vs old — but at the least, this establishes this patient as having a severe conduction defect of uncertain age.
As per Dawn — the presence of fragmentation (ie, extra “notching” in many of the QRS complexes) + large Q waves in the inferior and lateral precordial leads — tell us that this patient has had infarction(s) at some point in the past. I’d add to this what appears to be a large and wide Q wave in lead V1, which when present indicates septal infarction at some point in time as well as RBBB.
Although this patient does not have chest pain — there are some ST-T wave findings on this tracing that could indicate recent (subacute) MI. In addition to the subtle-but-real ST elevation in lead aVL (PURPLE arrow in this lead) — there is straightening of the ST segment in lead V2 (BLUE arrow in this lead). Finally — instead of slight J-point ST depression in lead V1 (as is usually seen with simple RBBB) — the ST segment in this lead is coved (“frowny”-configuration) and it “hugs” the baseline (YELLOW arrow in V1). In conjunction with slight ST depression seen in most other leads — these could be recent findings ...
My Impression of ECG #1 — My guess is that ECG #1 is not indicative of an acute event. That said — recent MI (perhaps superimposed on prior MIs) can not be ruled out on the basis of this single tracing, and further evaluation is indicated.
========================================
ECG #2 (BOTTOM tracing in my Figure — in which leads V4,5,6 have been replaced by leads V4R, V8 and V9). IF the times indicated in the upper left-hand corner of each tracing are accurate (ie, 11:43:12 and 11:54:44) — this would mean that 11:32 minutes passed in between these 2 tracings. This is important to note!
The reason it is important to note how much time has passed between obtaining these 2 tracings — is that there appears to be slightly more ST elevation in lead aVL (PINK arrow in this lead) in ECG #2 compared to ECG #1 — and slightly more ST depression in lead II (GREEN arrow in this lead). IF so — then this could be consistent with an acute ongoing event! (ie, 11 minutes is more than enough time for acute evolution on ECG to occur).
PEARL — It is important to be aware that the amount of ST segment deviation (both elevation and depression) may sometimes be accentuated by tachycardia unrelated to an acute evolving event. This could be the case in this patient (the multiple PACs serving to “increase” overall heart rate) — but, further evaluation would be needed to determine this.
Finally — I will comment on the use of additional leads. I have nothing against “more information” — and there clearly are times when getting one or more right-sided leads (such as a V4R lead) can prove diagnostic for recognizing acute RV involvement — which can be important, because treatment (ie, increased volume) may be very different than acute MI without RV involvement.
That said — UNLESS additional leads are likely to add to the clinical picture (ie, and change management of the EMS team prior to arriving in the ED) — I see little benefit in getting them (with potential downside of unnecessarily delaying EMS transport). Some EMS systems are equipped to obtain the 3 additional leads gotten here in minimal time (ie, in less than 1 minute). But others are not — and IF getting the 3 additional leads we see in ECG #2 is the reason for much of the 11:32 minute delay between recording ECG #1 and ECG #2 — then it would have been better (in my opinion) not to get these additional leads! Instead — GET the patient ASAP to the hospital!
Lead V4R only helps to diagnose acute RV MI. While possible for there to be isolated RV MI — it is rare to see this without ECG evidence of acute inferior MI due to acute RCA (Right Coronary Artery) occlusion — and there is no inferior lead ST elevation on either tracing here. If anything — the ST elevation in lead aVL + those subtle changes in leads V1, V2 would suggest LAD (and not RCA) occlusion.
I am less positive about posterior leads (such as the V8 and V9 leads obtained here). In my experience — I do not recall having seen any case in which posterior leads told me anything not already evident from using the Mirror Test on anterior leads (Please SEE my ECG Blog #80 for more on the Mirror Test). Lack of maximal ST depression in leads V2,V3 tells us that posterior MI is highly unlikely here. And, the question of potentially acute ST elevation in lead aVL has already told us all we need to know. So, we admittedly do not know details of today’s case — but I would not have delayed transport at all in this case to obtain the 3 extra leads we see in ECG #2.
Wish we had follow-up for this case!
Ken Grauer, MD www.kg-ekgpress.com [email protected]