
Submitted by Dawn on Wed, 04/24/2019 - 21:29
The Patient This ECG was obtained from an 80-year-old man with a past medical history of hypertension, diabetes, chronic obstructive pulmonary disease, hyperlipidemia, chronic kidney disease, and heart failure with preserved ejection fraction (HFpEF).
He presented to the hospital with a complaint of shortness of breath, and was determined to have an exacerbation of his COPD in the setting of a viral infection. He was treated with breathing treatments and steroids, and was discharged home in improved condition.
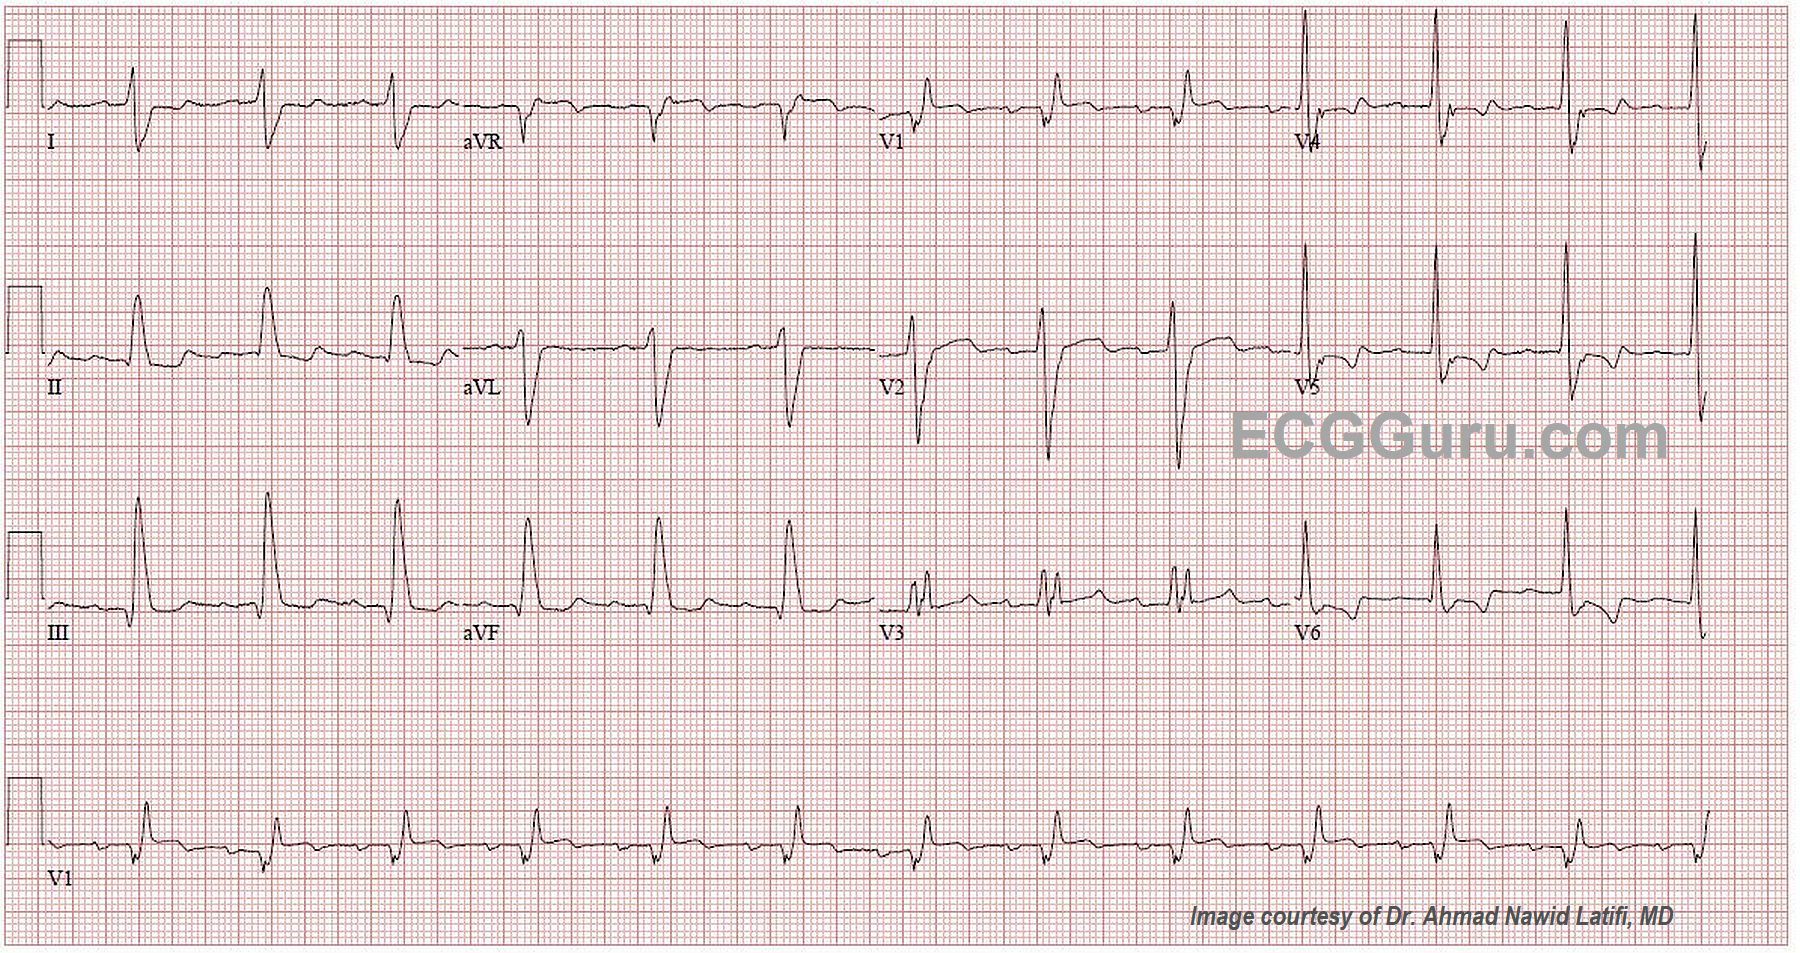
The ECG There is a sinus rhythm at 80 bpm. The QRS complex is wide at .18 seconds (180 ms). The PR interval is slightly prolonged at .24 seconds (240 ms), which is first-degree AV block. There is right bundle branch block (QR in V1 and rS in Leads I and V6 with a wide QRS). There is also a left posterior fascicular block (also called hemiblock), recognized by the right axis deviation (III is taller than aVF ). This is bi-fascicular block, which can be chronic or acute. There is very slight ST elevation with flattening in V1 and possibly V2. In RBBB, “normal” T waves are directed opposite the terminal wave of the QRS. V3 should, then, have inverted T waves. So, the upright T wave in this patient could be considered to be equivalent to an inversion in a normal ECG. V4 through V6 have biphasic T waves, which is not normal for RBBB. Because we do not have an old ECG, we don’t know which, if any, of these changes are chronic. With this patient’s past medical history, it is possible for any of them to be pre-existing.
I will admit that, when I first saw this ECG, the V1 rhythm strip at the bottom looked as though there were regular P waves at a rate of about 220-240, with one buried in each QRS and one in each T wave. In scrutinizing all the other leads, I cannot find evidence for an underlying atrial tachycardia or atrial flutter, so it is probably a coincidence that the P and T “march out” with the assumption of a hidden P wave in the QRS.
The Conduction Blocks AV conduction blocks (AVB) can occur in any part of the conduction system from the AV node through the fascicles of the bundle branches. The ECG can offer valuable insights into what type of block is present, and even the location of the block, but often an EP study is needed to actually pinpoint the conduction defect.
AV blocks can cause slowing or failure of conduction. They can be chronic, permanent, temporary, intermittent, or even rate-related. A block of one of the left fascicles is called a “hemiblock” or “fascicular block”. A “bifascicular block” is a block of two of the three fascicles. A left bundle branch block is a bifascicular block, because the left bundle has two main fascicles. A common bifascicular block is right BBB with left anterior hemiblock, because those two fascicles share a blood supply. There are
This patient has a more unusual bifascicular block: right bundle branch block and left posterior hemiblock. He also has first-degree AVB. It has become customary to call this combination “tri-fascicular block”, but this is a misnomer. One would have to assume that the first-degree block is in the anterior fascicle for this to be “tri-fascicular”. If the conduction delay is actually in the AV node, this is still have a bi-fascicular block. One example of true tri-fascicular block would be second-degree AVB, Type II, which is a bi-fascicular block with an intermittent block in the third fascicle (intermittent tri-fascicular block). Another example of tri-fascicular block is complete heart block (third-degree) as a result of blocks in all three fascicles. Third-degree AVB caused by fascicular blocks would result in a ventricular escape rhythm, as opposed to an AV node complete block, which might have a junctional escape rhythm. An EP study, with H-V intervals measured, would be necessary to be sure of the levels of the blocks. The important thing here is that this patient has very significant chronic illness, is elderly, and has demonstrated bi-fascicular and possibly tri-fascicular disease. His likelihood of progressing to complete heart block is significant. Should he develop a complete tri-fascicular block, he would require a pacemaker. Remember, atropine will not work on infra-Hisian blocks (fascicular blocks). Another important clinical pearl is that any fascicular block which develops during an acute M.I. is much more likely to progress.
Fortunately, this patient’s ECG remained stable, and his condition improved with treatment, and he was able to be discharged home.
We would like to thank Dr. Ahmad Nawid Latifi, MD for providing this ECG.
https://www.ajconline.org/article/0002-9149(74)90024-1/fulltext
http://hqmeded-ecg.blogspot.com/2016/07/
Related Terms:
Rate this content:
All our content is FREE & COPYRIGHT FREE for non-commercial use
Please be courteous and leave any watermark or author attribution on content you reproduce.
Comments
Bi- vs Tri-Fascicular Block. Are Both Terms still Valid?
The ECG in this case was obtained from an 80-year old man who presented for an exacerbation of his COPD. There was no documented history of coronary disease — and apparently no chest pain at the time he was seen. Dawn has brought up the most salient points about the tracing. I’d add the following thoughts:
I had the same concern Dawn initially did about the rhythm — namely questioning whether there were extra P waves, because it looks like there are 2 very similar negative deflections in the long lead V1 rhythm strip. Suffice it to say (after trying multiple caliper-measured combinations) — I could not get a consistent relationship in any one lead to march out in any one lead. So, I strongly suspect this is simply a sinus rhythm at ~75/minute, with a slightly long PR interval (I measure 0.22 second). This does qualify as “1st-Degree” AV Block.
As per Dawn — QRS duration is clearly prolonged. QRS morphology is consistent with RBBB + LPHB (Left Posterior HemiBlock), with a few qualifications: i) There is a wide and deep and fragmented Q wave in lead V1. This strongly suggests there has also been prior septal infarction at some point in time; and, ii) The straight portion of the S wave descent in lead V1 is not quite as steep as it typically is when there is LPHB in addition to RBBB. That said — the expected qR pattern of LPHB in leads II and III is seen — so I agree that the best descriptor for the conduction defect here = bifascicular block = RBBB/LPHB.
According to 2009 AHA/ACCF/HRS Recommendations from an international Expert Panel — the term, “trifascicular” block is no longer recommended “because of the great variation in anatomy and pathology producing this pattern”. Instead, the expert committee recommended description of the conduction defect separately in terms of the individual defects — which in this case = RBBB + LPHB + 1st-Degree AV Block. As per Dawn — it would take EP study to determine if the reason for delay in PR interval conduction is the result of a problem in the remaining left anterior hemifascicle (as it would have to be to qualify as true “trifascicular” involvement), or of something more proximal to this.
Additional points of interest regarding this tracing include the following: i) The Q wave we see in leads III and aVF is both wider and deeper than usual. This is accompanied by a small-but-present q in lead II. This suggests prior inferior infarction at some point in time; and, ii) There is clearly abnormal ST elevation in lead V1 + ST coving in lead V2 — and, in lateral chest leads, more ST coving + some J-point ST depression + plus a shape to the biphasic T wave that clearly suggests ischemia. That said, in the absence of any chest pain — I suspect all of these ST-T wave abnormalities are probably old (Prior tracings for comparison and clinical correlation of course needed to confirm this).
Finally — the question arises as to whether the upright T wave in lead V3 is abnormal or not. In my experience — the direction of the ST-T wave with “simple” LBBB or RBBB will be opposite to the last QRS deflection only in what I call the 3 “KEY” leads ( = leads I, V1 & V6). No “blanket statement” can be made for the other 9 leads. That said, I believe the shape of the small but peaked positive T wave in lead V3 is abnormal — but for a different reason = because of the ST-T wave abnormalities just described for each of the lateral chest leads (V4, V5, V6). The shape of this positive T wave in lead V3 looks virtually the same as the shape for the 2nd part of the biphasic T waves in leads V4 and V5, and those are clearly “not normal”. That said — these ischemic changes look like they are probably longstanding (clinical correlation pending …).
P.S. I would not be at all surprised if one or more of the anterior chest leads were malpositioned. This is especially true for lead V3 — since QRS morphology for this lead looks a bit “out-of-place” considering the appearance of neighboring leads V2 and V4. That said, I doubt repeat ECG with verified chest lead electrode placement would change my overall impression of this tracing — so I might not immediately request a repeat ECG.
================
FOR MORE on the ABOVE POINTS:
— For “My Take” on a user-friendly approach to ECG diagnosis of the BBBs — CLICK HERE ( = my 17-minute ECG Video).
Ken Grauer, MD www.kg-ekgpress.com [email protected]
An ECG With a Treasure Chest of Findings
Thanks, Dawn, for a very expert analysis of this complicated ECG. And thanks to Dr. Grauer for his expert comments (Ken: this time she didn't leave too much for us to talk about!).
In my experience, a qR complex in V1 can be a very problematic finding because a number of conditions can result in this morphology. There are times when a qR morphology actually represents an rSR' in which the r wave is isoelectric. But I agree with you here - I think this is indeed a qR.
I agree with everything else that both of you have discussed and I thank you both for an excellent analysis and learning experience.
Regarding the direction of repolarization abnormalities in bundle branch block, the question often arises: "Is the T wave opposite the LAST deflection of the QRS or the MAIN deflection of the QRS?"
When you read fairly extensively on this topic you find that there ARE distinctions made as well as differences of opinion. I take this approach: The QRS represents TWO ventricles - even when there is a bundle branch block. The repolarization abnormality (and hence the T wave) should be opposite the portion of the QRS that represents the blocked ventricle. THAT is where the abnormal depolarization occurs and thus THAT is also where the abnormal repolarization is occurring. You don't have to see very many bundle branch blocks before you have a good feel for which leads should have which type of repolarization abnormality. The issue arises mostly when the terminal deflection happens to be very small and also in distinguishing primary from secondary changes.
Jerry W. Jones MD FACEP FAAEM
https://www.medicusofhouston.com
Twitter: @jwjmd
Thank you, Dr Jones and Dr Grauer.
I always have such a feeling of accomplishment when Dr. Grauer (the ECG Guru Consulting Expert) confirms my findings. And now, I'm really feeling pretty good With Dr Jones's affirmation. Mostly, I really cannot say enough how generous you both are to give your time to comment on my content. I also very much appreciate the generosity of Dr Ahmad Nawid Latifi for providing this case
People all over the world have the chance to learn from two bonafide ECG gurus, and I always learn so much from you both.
BTW Dr Jones - Did the V1 rhythm strip look at first like a tachycardia with a physiologic block? It seemed to jump out at me, but then I had to abandon the idea after closely scrutinizing the other leads. If you hear hoofbeats, look for horses, not zebras!
Dawn Altman, Admin
The V1 Rhythm Strip
Thanks, Dawn...
To answer your question, yes it did - and it still does! It really resembles a left-sided peri-mitral atrial flutter except for the fact that the "flutter waves" in this ECG are negative in V1 when they should be positive. Left-sided atrial flutters are among the "atypical atrial flutters" and are really intriguing because in many (if not most) cases the only flutter waves you see are in V1 and they are upright. The kicker is that all the other leads will have flat baselines between deflections - no sawtooth patterns anywhere! This can make it look more like a regular atrial tachycardia coming from a low atrial focus. The inverted P waves in V1 (probably really biphasic with a near-isoelectric first half), however, pretty much rule out a left-sided flutter with block.
You see rhythms like this from time to time in which the timing between deflections is coincidental, but it certainly gives you pause to think. Another similar situation is the T-U-P phenomenon in which a T wave, a U wave and a P wave are present and all about the same amplitude. It can easily be mistaken for atrial fibrillation.
My thanks also to Dr Latifi for contributing this very interesting ECG.
Jerry W. Jones MD FACEP FAAEM
https://www.medicusofhouston.com
Twitter: @jwjmd
Thanks!
Thanks! Sometimes, I’m too quick to call “atrial tach” or “atrial flutter”. But, in my defense, I have caught some others have missed. :-)
Dawn Altman, Admin
All Turns Good With Very I'll Patient
Despite his "past medical history of hypertension, diabetes, chronic obstructive pulmonary disease, hyperlipidemia, chronic kidney disease, and heart failure with preserved ejection fraction (HFpEF)." Wow, that's a lot. Good thing, he still cope with his health and be able to discharge from the hospital.
I learned a lot today with your post. Keep posting post that many can benefits from the information and thoughts you shared. Health is wealth.
From:
Good Teaching Case
Thanks, Gregory, we agree! What an excellent teaching case. Glad you found it helpful.
Dawn Altman, Admin