
Submitted by Dawn on Sun, 01/13/2019 - 22:32
The patient: This ECG is taken from a 55-year-old man whose wife called 911 because he had a syncopal episode. When the paramedics arrived, he was conscious and alert, and denied any symptoms. He gave a history of "cardiac", diabetes, and opiate abuse. We do not know the nature of his cardiac history or his medications.
It is difficult to pinpoint a definite diagnosis with this lack of information and a clearly abnormal ECG. We will limit our discussion to listing the abnormalities seen:
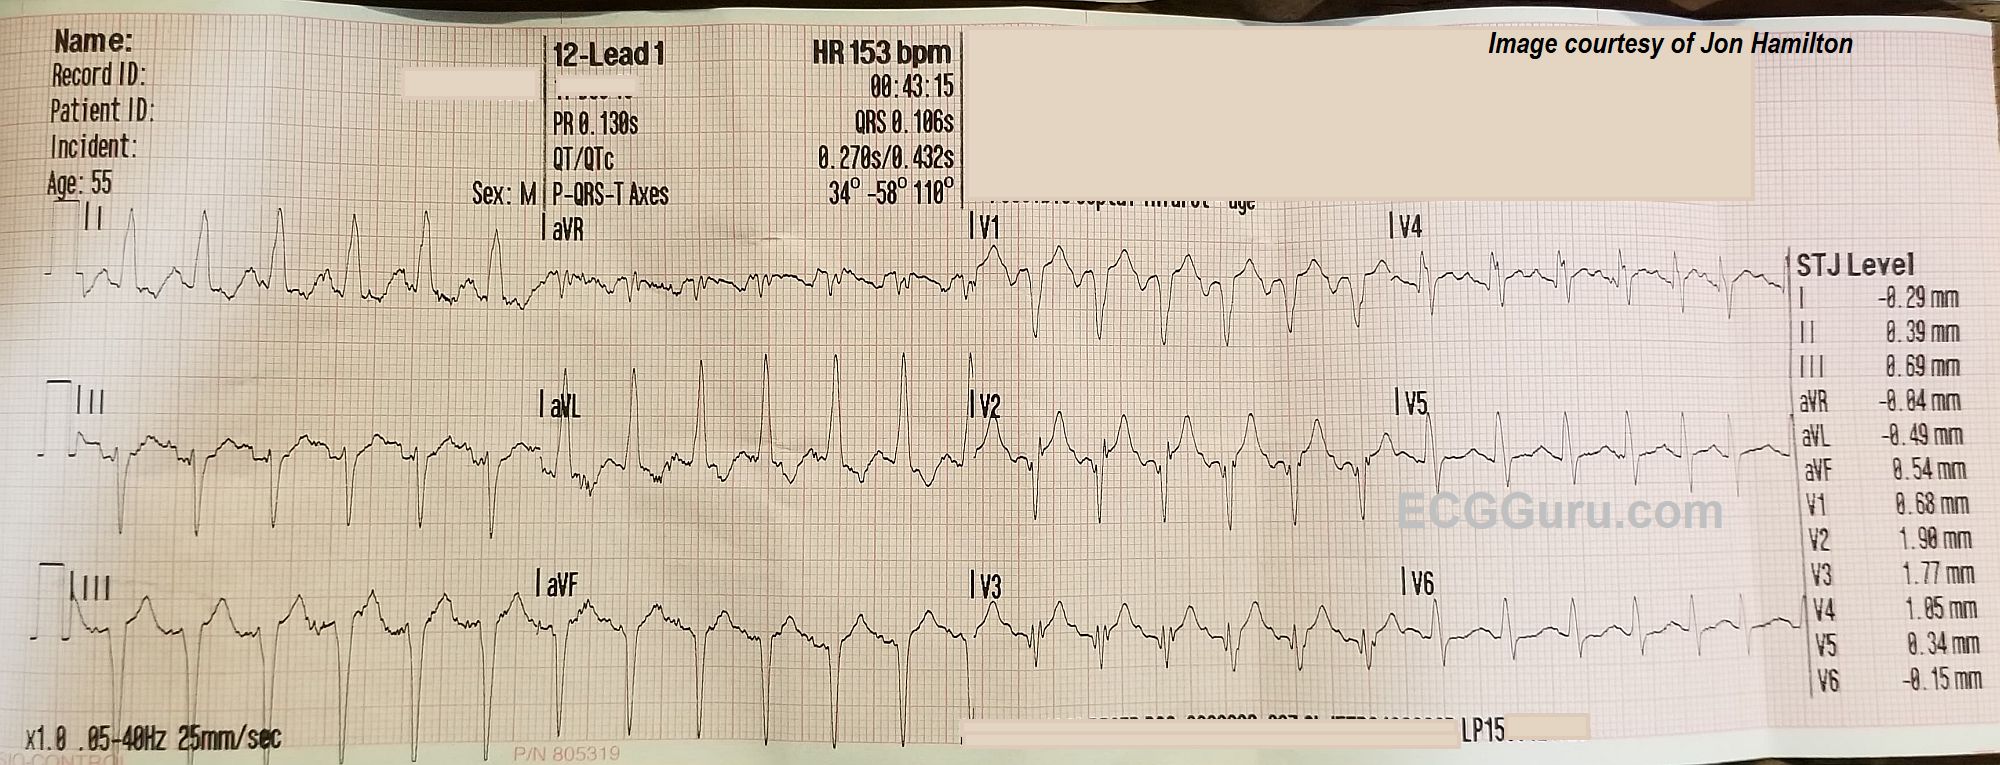
The ECG rhythm: There is a fast, regular rhythm that is supraventricular in origin (there are P waves). When a supraventricular rhythm has a rate of about 150 per minute, we should ALWAYS consider ATRIAL FLUTTER WITH 2:1 CONDUCTION. Atrial flutter produces P waves (flutter waves) at approximately 250-350 per minute. The normal AV node is able to conduct half of these, at a rate of about 150 per minute. Atrial flutter with 2:1 conduction is the most common presentation of new-onset atrial flutter. It is often missed by people who expect to see several flutter waves in a row, producing the "sawtooth pattern". That being said, atrial flutter is usually discernable in at least a few leads if it is present. We do not see any signs of flutter waves in this ECG.
That leaves us with a differential diagnosis of sinus tachycardia vs. one of the regular supraventricular tachycardias like reentrant tachycardias or atrial tachycardia. Sinus tachycardia can be recognized by several features. If we are fortunate enough to witness the onset or offset of the fast rhythm, will will recognize sinus tachycardia by a "warm up" or gradual speeding up of the rate, and a "cool down", or gradual slowing. On the other hand, SVTs often have abrupt onset and offset. Sinus tachycardia often has a very obvious cause, such as hypovolemia, fever, pain, anxiety, vigorous exercise, or hypoxia. Sinus tachycardia usually has a distinct, upright P wave in Lead II, and a clearly-seen, often negative, P wave in Lead V1. This ECG does not show the onset of the tachycardia, and is not long enough to evaluate for rate changes. Lead II appears to have upright P waves on the downslope of the previous T waves. V1 has deeply negative P waves, and V4 has the most clearly-seen P waves. Without being positive, this looks more like sinus tachycardia than a reentrant tachycardia. It would help to know more about the patient's condition.
The QRS complexes: The QRS complexes are slightly wide at .106 seconds. This is not wide enough to consider bundle branch block. Other conditions can cause widening, such as left ventricular hypertrophy and hemiblock, as well as some drug and electrolyte effects. The frontal plane axis is abnormally leftward, which supports a left anterior hemiblock (left anterior fascicular block) diagnosis. There is not a distinct qR pattern in Lead I or rS in Lead III, however. Lead aVF appears to have a pathological Q wave - could this be why Lead III does not have a distinct r wave?
While the chest leads do not show increased voltage that would indicate left ventricular hypertrophy, the left axis and the tall QRS in aVL do meet the criteria for LVH. LVH is not diagnosed by ECG, but it does cause changes on the ECG, such as increased voltage in left-sided leads and a "strain" pattern. Leads I and aVL demonstrate the strain pattern of downsloping ST segments and T wave inversion, but the chest leads do not.
The QRS complexes in V2, V3, and V4 are fragmented, which is an equivalent to pathological Q wave. This may indicate a prior anterior wall M.I. There is very slight J-point elevation in the right-sided chest leads, but may be due to LVH.
Without knowing more about this patient's past medical history, or the results of his physical exam, it is difficult to assign meaning to all these abnormal findings. It is unfortunate that he refused transport to a hospital, and we can only hope that he later found his way there for treatment.
Many thanks to Jon Hamilton for donating this ECG to the ECG Guru
Related Terms:
Rate this content:
All our content is FREE & COPYRIGHT FREE for non-commercial use
Please be courteous and leave any watermark or author attribution on content you reproduce.
Comments
55yo Man with Syncope and Tachycardia
We are told the patient whose ECG is shown in the Figure is a 55-year old man with a “cardiac history”, whose wife called EMS because of a syncopal episode. No chest pain, and the patient denied symptoms at the time EMS arrived. His ECG shows a number of interesting findings:
— The rhythm is a regular tachycardia, at a rate of ~150/minute. The QRS complex appears to be slightly widened (The computer says 0.106 sec; I read it as ~0.11 second). That said, QRS morphology “looks” supraventricular (See below).
— Recognition of a regular SVT rhythm at a rate close to 150/minute should always prompt consideration of the following: i) Sinus tachycardia; ii) A reentry SVT rhythm (such as AVNRT or AVRT); iii) Atrial flutter; and, iv) Atrial tachycardia.
— Although AFlutter is by far (!) the most commonly overlooked rhythm — I do not see any evidence in any of the 12 leads of 2:1 AV conduction that is the most common presentation of new AFlutter. I highly doubt flutter is present here.
— Sinus tachycardia is most often identified by the presence of conducting upright P waves in lead II. However, due to the rapid rate and the presence of baseline artifact — it is not at all clear whether or not there are distinct upright P waves in lead II ...
— The next best lead for identifying sinus activity is lead V1. It is important to appreciate that the P wave will not always be upright in V1 with sinus rhythm — but whenever you see a distinct negative deflection in lead V1 that precedes each QRS complex with a constant (and not overly long) PR interval (as we see here) — this usually means that the rhythm is sinus! Confirmation that this IS sinus tachycardia is forthcoming from: i) the presence of definite sinus P waves in lead V4; and, ii) QRS morphology that is consistent with the deep negative P wave in lead V1 that suggests either left atrial enlargement or increased left atrial pressure.
======================
Now that we have diagnosed a sinus mechanism — I’ll note the following additional findings:
— There is LVH — as determined by the presence of a tall R wave ≥12mm in lead aVL. The shape of the ST-T wave depression in leads I and aVL is highly consistent with LV “strain”.
— There is LAHB (Left Anterior HemiBlock) — as diagnosed by the predominant negatively ( = markedly leftward axis) that is present in all 3 inferior leads.
— The presence of LVH and LAHB may explain the slight QRS widening that is seen — as either condition may widen the QRS by 0.01-0.02 second (ie, it takes longer to traverse a thicker ventricle; and it takes longer to traverse the ventricles when there is a hemiblock conduction disturbance).
— LVH & “strain” + LAHB + tachycardia are all common findings seen in association with LAA (= which is suggested by that deep negative P wave in lead V1).
— Looks like there is a QS in lead aVF, as well as in some beats in lead III. This suggests the likelihood that this patient has both LAHB + prior inferior infarction.
— There is a QS complex in lead V1 — and, fragmented multiphasic QRS complexes in leads V2 and V3 (each of which begins with a Q wave). In addition, there is a small-but-real q wave in lead V4, but NO Q wave in V5 or V6. This strongly suggests that there has been prior anterior infarction at some point in time.
— T waves are quite peaked in leads V1,V2,V3 — but my “hunch” is that this does not reflect an acute change. I think it more likely that this reflects the rapid heart rate + LVH + perhaps some ischemia … Therefore — I do NOT think the cath lab should be activated at this time for this patient (who also does NOT report any chest pain!). That said — I don’t think we can completely rule out the possibility of an acute event from this single tracing … Sounds like this patient refused transport (hopefully he was deemed competent enough to render this decision) — which means we’ll never find out what happened … But hopefully this tracing still provided LOTS of important teaching points!
Ken Grauer, MD www.kg-ekgpress.com [email protected]
Great Teaching ECG!
This is an excellent ECG and an equally excellent presentation by Dawn with very informative and supportive comments by Dr. Grauer.
I don't have much to add other than a comment about LVH and LAFB in the same tracing. Left axis deviation is a sine qua non for anterior fascicular block and it generally needs to be -45 degrees or more. However, left axis deviation is NOT part of the definition for LVH as it is for right ventricular hypertrophy. It can be difficult or even impossible, at times, to make the call of concurrent LVH and anterior fascicular block in the absence of voltage criteria in the precordial leads. Left axis deviation of this degree will typically cause a clockwise rotation in the precordial leads with a delayed transition and more S wave than usual in V5 and V6 - which we see here.
Dr. Grauer diagnoses both conditions here - and correctly so. The reason is the repolarization abnormality in leads I and aVL. There is no repolarization abnormality in LAFB and there is usually no left axis deviation in LVH (though there certainly CAN be in some cases). If there IS left axis deviation in LVH, it certainly will NOT be to the extent that we see it in LAFB. And repolarization abnormalities are not present in LVH until the disease becomes more advanced. So we have the two reasons Dr. Grauer is able to make this diagnosis of BOTH LAFB and LVH: the axis is too far left for LVH alone and there is a repolarization abnormality which is not a part of LAFB. I read a journal article a while back that stated that any increase in R wave height over 14 mm in aVL indicated LVH even when LAFB was present.
Thanks again to both of you for a rewarding discussion.
Jerry W. Jones MD FACEP FAAEM
https://www.medicusofhouston.com
Twitter: @jwjmd