
Submitted by Dawn on Sat, 07/21/2018 - 17:29
The Patient This ECG was obtained from a 51-year-old man who presented to EMS with acute chest pain. He had a history of hypertension, 40 pack-year smoker.
Hospital Course He was diagnosed with anterior wall STEMI and taken to the cath lab. He was rated Killips Class 1 (no evidence of congestive heart failure), TIMI risk score 4 (14% risk of all-cause 30-day mortality). He underwent primary percutaneous coronary intervention (PCI) of the proximal left anterior descending coronary artery (LAD).
Ten days post PCI, the patient had ventricular arrhythmias and went into cardiac arrest, but was resuscitated. He continued to have occurrences of non-sustained ventricular tachycardia (VT), progressing to sustained VT. Electrolytes were monitored and corrected when necessary. The patient expired before any further diagnosis was made.
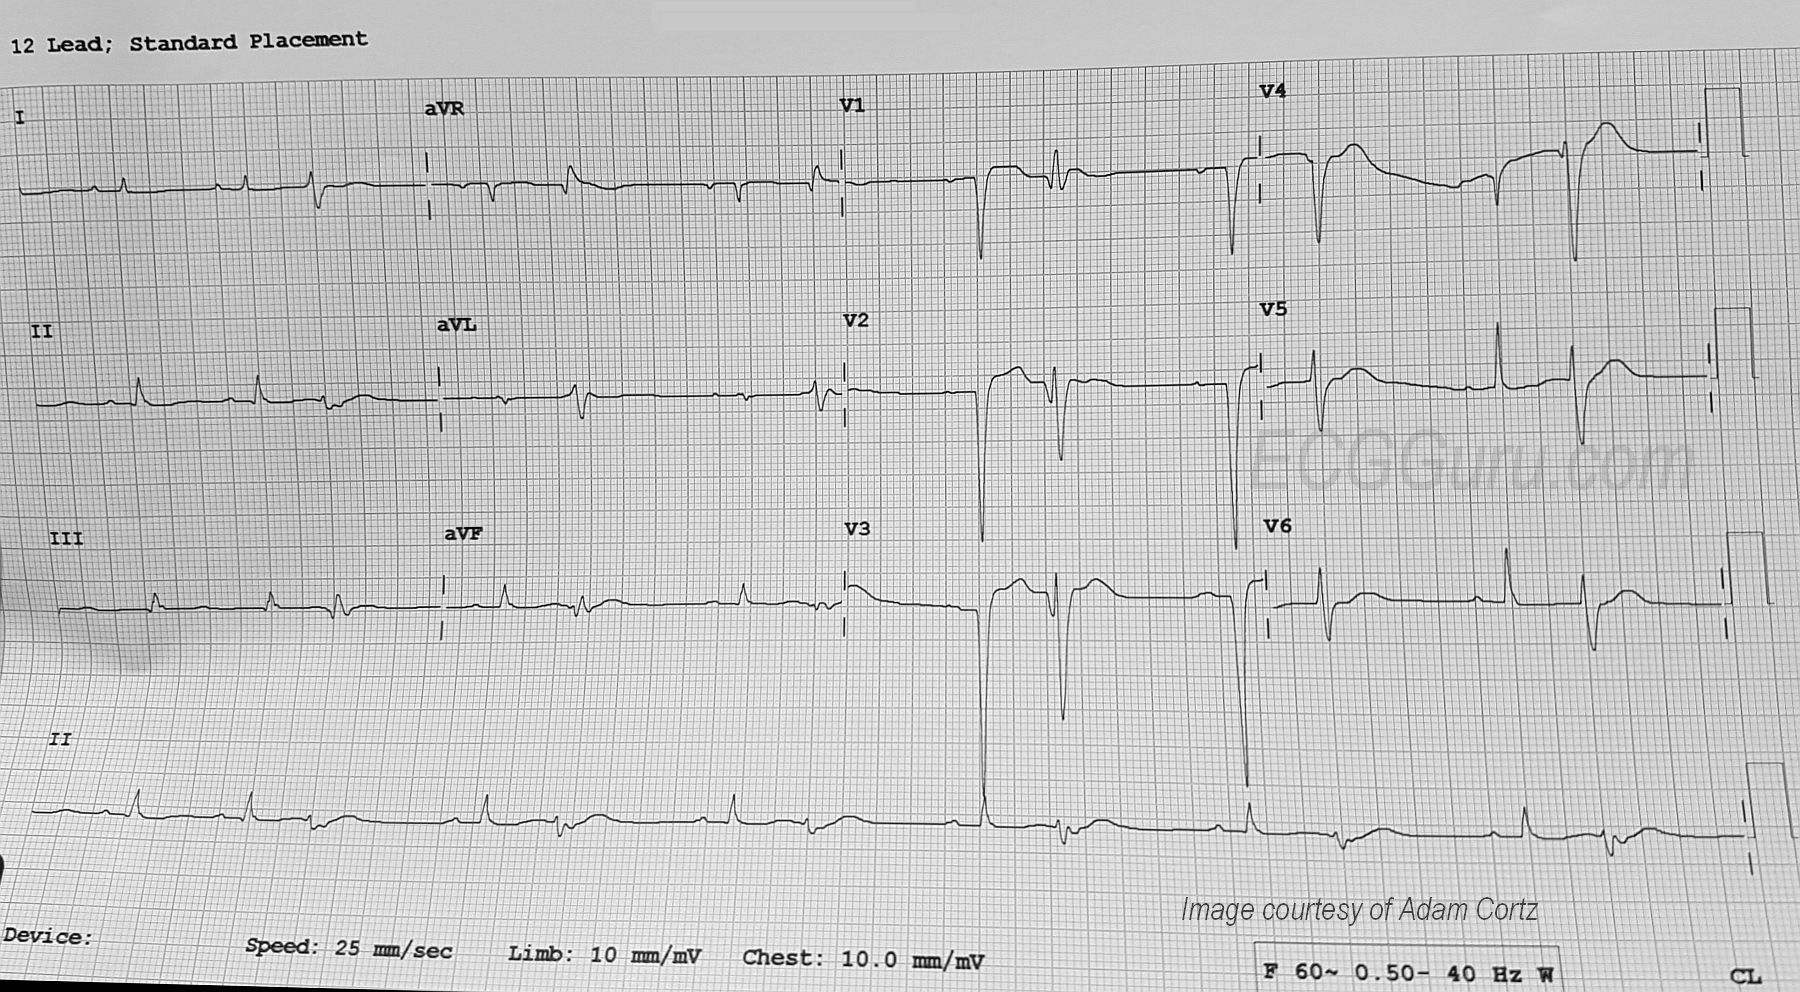
ECG Interpretation The rhythm is sinus at a rate of about 80 bpm (first two beats). The PR interval is about .18 seconds. The QRS duration is about .10 seconds. After the second sinus beat, ventricular bigeminy occurs. Every other sinus beat is obscured by the PVCs. By the end of the strip, the underlying sinus rhythm has slowed slightly.
The ECG signs that the ectopic beats are ventricular are: lack of P waves associated with the premature beats, QRS width about .16 seconds, and compensatory pauses. The axis of the sinus beats is around 60 degrees (normal), but the axis of the premature beats is difficult to determine due to the low voltage and biphasic QRS complexes in the frontal plane leads. It is also difficult to determine ST and T wave changes in the PVCs for the same reason.
Leads V1 through V4 have well-developed pathological Q waves (a sign of necrosis and usually permanent damage). The ST segments are flat in Leads V5 and V6, as well as in all the limb leads. The ST segments are elevated in V1 through V3, and possibly in V4 (difficult to measure due to artifact). We do not have information about how long after the acute STEMI this ECG was obtained.
Additional Considerations Sadly, this relatively young patient did not survive. There is always a possibility of mortality after myocardial infarction, even though chance of survival has improved greatly in recent years. One consideration in any patient who has persistent ST elevation after STEMI is ventricular aneurysm. It is presumed this patient was evaluated for that condition (we do not have complete information). ECG signs of ventricular aneurysm include:
* ST elevation that persists beyond two weeks after acute M.I. (commonly in anterior leads).
* Often associated with well-formed Q waves, or QS pattern.
* Small-amplitude T waves.
* Absence of reciprocal ST depression.
LV aneurysms can spontaneously rupture, causing almost instant death. Also, scar tissue is arrhythmogenic. The pathological Q waves on this ECG indicate scar tissue has formed. This can be the cause of the persistent PVCs and ventricular tachycardia. Damage to the left ventricle can also lead to congestive heart failure, with or without LV aneurysm. Mural thrombi can form at the site of the STEMI and embolize.
Our thanks to Adam Cortz for donating this ECG.
Related Terms:
Rate this content:
All our content is FREE & COPYRIGHT FREE for non-commercial use
Please be courteous and leave any watermark or author attribution on content you reproduce.
Comments
More Questions than Answers (Ant STEMI + Ventricular Bigeminy)
Interesting tracing, that unfortunately raises more questions than it answers ... We are told that the ECG in the Figure was obtained from a 51-year old man who presented to the ED with new-onset chest pain. He was diagnosed with acute anterior STEMI, and then underwent PCI in an attempt to reperfuse his proximal LAD. The patient subsequently developed progressively longer runs of sustained VT — and ultimately expired. From an ECG interpretation standpoint — We have NO IDEA as to when during the above course of events this ECG was obtained. That said, we can still make a number of educational points about what this ECG shows with the limited information that we do have.
i) As per Dawn — the rhythm begins with 2 sinus beats (beats #1 and #2 in MY FIGURE attached Below) — and is then followed by ventricular bigeminy (every other beat a PVC). As per Dawn — the rate seems to slow a little bit toward the end of the tracing. Sinus-conducted beats are preceded by RED arrows (ie, beats #1,2; 4, 6, 8, 10 and 12). It is of interest that the QRS complex of the PVCs does not look overly wide in the long lead II rhythm strip. That’s because a portion of the QRS for these PVCs occurs on the baseline. One could easily misinterpret this, and think beats # 3,5,7,9,11 and 13 were supraventricular — if one only assessed QRS duration from the single lead II monitor strip.
ii) I believe there is evidence of alternate retrograde conduction from the PVCs. Note that YELLOW arrows highlight a small area of negativity after the PVCs of beats #3, 5, 9 and 13. This small negative deflection is NOT seen following PVCs #7 and 11. While such retrograde conduction does not have clinical implications for this particular case — it may have relevant clinical implications in other cases, which is my reason for pointing this phenomenon out. Alternate retrograde conduction out of PVCs may indicate retrograde 2:1 VA block.
iii) As per Dawn — we need to focus on sinus beats in simultaneously-obtained leads in order to interpret this ECG. The BLUE dotted rectangles highlight such sinus-conducted beats in all 12-leads. The QS complex in leads V1-thru-V4 clearly suggests anterior MI has taken place at some point... And, there is at least 2-3mm of ST elevation in leads V1-thru-V3. However the shapeof this anterior ST elevation does not look acute to me. A less acute (if not, frankly longstanding) explanation for these findings is supported by lack of acute change in other leads. Whether the ECG picture we see here is the result of recent antero-septal MI — and/or LVH with strain (as it might appear in anterior leads) — and/or LV aneurysm (of unknown duration) — is a matter of speculation that cannot be resolved by this single ECG. Similarly, frequent ventricular ectopy could well be longstanding in a patient with a large prior anterior infarction and impaired LV function. The important clinical point is to BE Aware of the differential diagnosis of these chest lead findings. Finally — limb lead voltage is low. Whether this is incidental, due to body habitus — or due to pericardial effusion — is a matter for additional speculation.
Ken Grauer, MD www.kg-ekgpress.com [email protected]
Very perplexing ECG, Dawn.
Very perplexing ECG, Dawn.
What perplexes me is the part of the history that states the patient was taken to the cath lab and a stent placed. I'm not sure when this ECG was taken relative to the stenting but it certainly appears to have been much later. The PVCs can be very informative. These PVCs originate in the left ventricle and have Q waves. Activation of the two ventricles out of synch allows areas of the LV to depolarize without competing forces from the other ventricle. They will sometimes show the Q waves of a remote MI and also the STE of an acute MI that isn't revealed in the regular beats.
Ventricular bigeminy is a reentrant phenomenon and while it is usually benign clinically, there is always the possibility that the reentry can become self-sustaining.
Jerry W. Jones MD FACEP FAAEM
https://www.medicusofhouston.com
Twitter: @jwjmd