
Submitted by Dawn on Sat, 10/28/2017 - 18:36
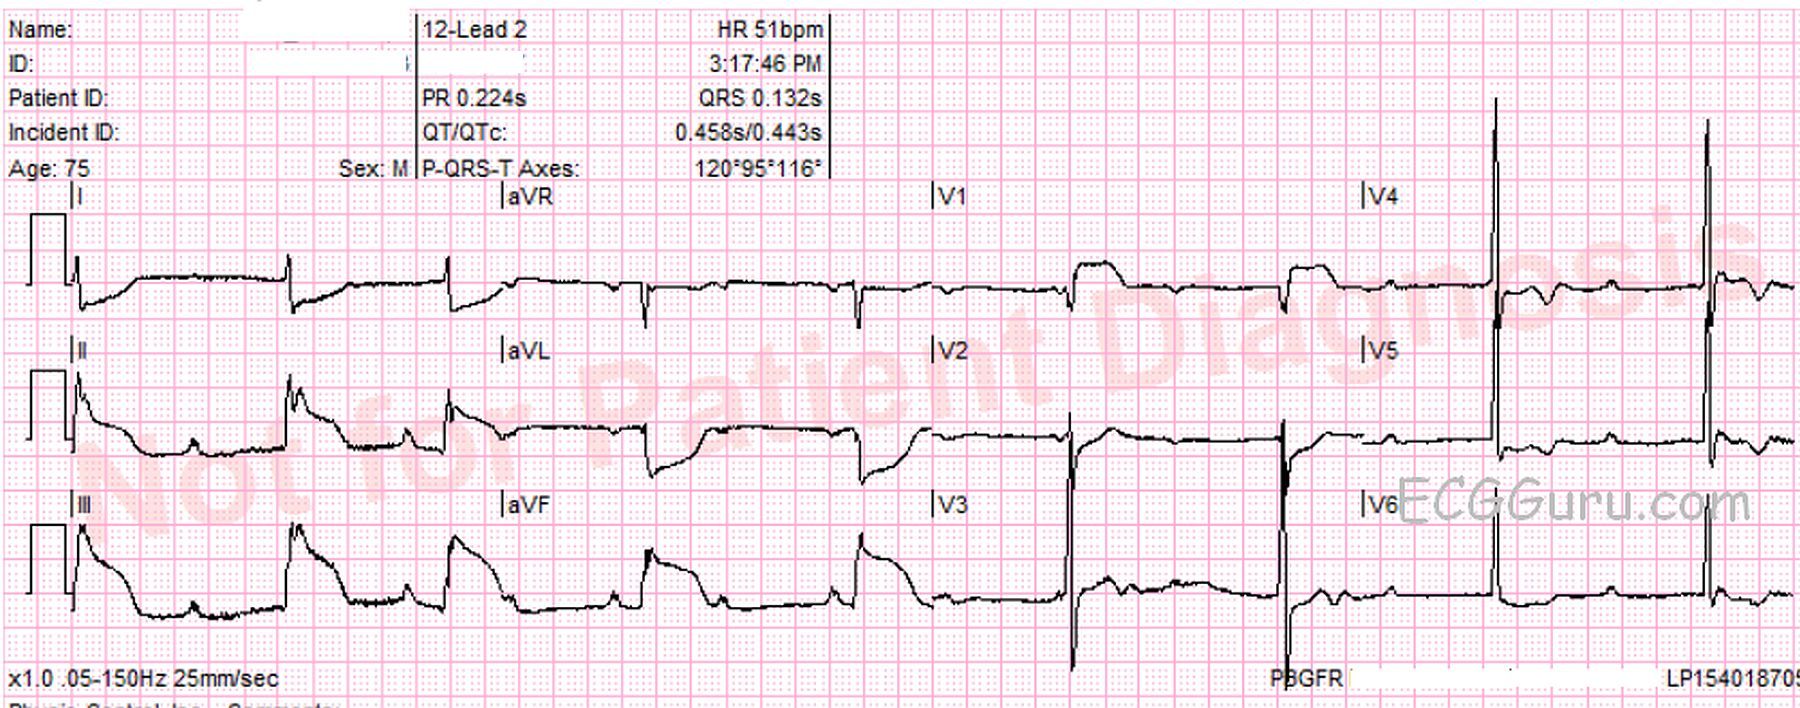
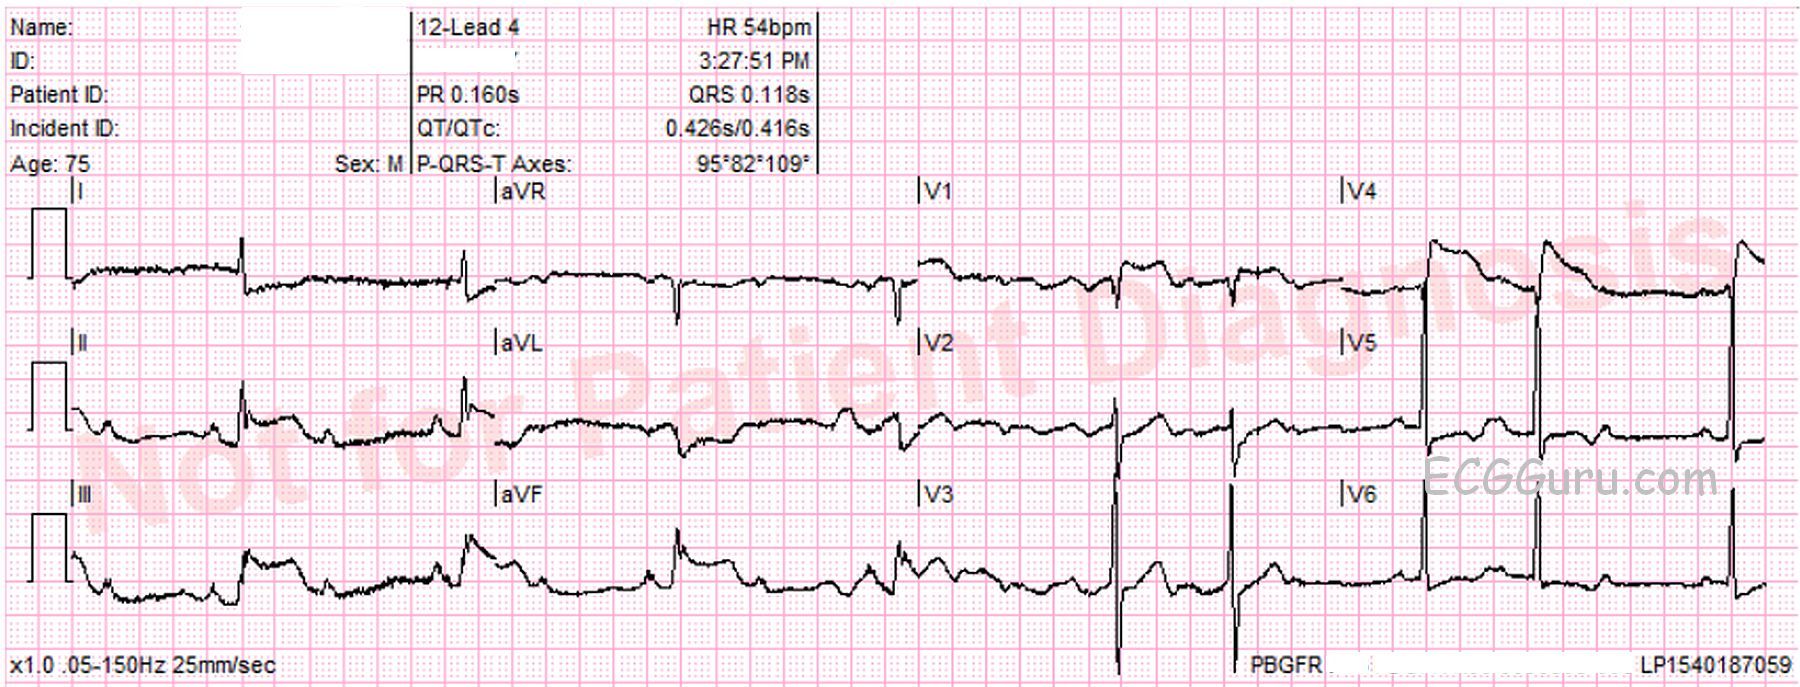
This ECG was recorded from a 75-year-old man with substernal chest pain and diaphoresis. It shows a pretty classic picture of acute inferior wall M.I. The second ECG is a repeat tracing with the V4 wire moved to the V4 Right position, and it is positive for right ventricular M.I. The patient was found to have a 100% occlusion of the right coronary artery, which was opened and stented in the cath lab.
There are several other examples of IWMI with RVMI in our archives, so we will confine this commentary to the ECG signs that make these tracings so typical of right coronary artery occlusion. Once you are familiar with the typical pattern of IWMI / RVMI, it is easy to see, even when the ST elevation is subtle (as this one certainly is NOT).
Signs of IWMI in these ECGs are:
· ST elevation in inferior leads II, III and aVF.
· Reciprocal ST depression in leads I and aVL.
Signs of RVMI in these ECGs are:
· ST elevation in V4 right.
· ST elevation in V1 without ST elevation in V2.
· ST elevation in lead III is greater than ST elevation in lead II.
Other common findings in right coronary occlusion that are seen in these ECGs:
· ST depression in V2. If not for the RVMI causing elevation in V1, there would be ST depression in V1 also. This is a reciprocal ST depression, reflecting STE in the posterior wall. The posterior wall is called the lateral wall by some because it is oriented behind the anterior wall, but toward the patient’s left side. This area across from V1, V2, and sometimes V3 can have ST elevation if an inferior wall M.I. is large enough to extend up toward the base of the heart. Electrodes placed on the left side of the back might show the STE.
· Bradycardia and heart block. Sinus and AV node blocks often occur in IWMI because the two nodes usually have the same blood supply as the inferior wall and right ventricle. AV blocks are usually of the “Type I” variety. There may be varying amounts of first-degree AVB, second-degree AVB, Type I (Wenckebach), and even third-degree, or complete heart block. In the first ECG, at 3:17, we see some 2:1 AVB. There are also some periods where there is AV dissociation with junctional escape, or possibly very long PR intervals (beats 1,5,6). In the second ECG, at 3:27, we see a slight increase in the sinus rate with Wenckebach periods (beats 5-8).
· Bradycardia, even if caused by AV block, might actually be helpful to the M.I. patient, as a rapid rate could use up the heart’s resources and hasten heart failure. The rate should be evaluated in light of the patient’s hemodynamic condition: blood pressure, skin color and temperature, and mental status.
Being able to quickly and confidently recognize the patterns produced by RCA occlusion will help when you are confronted with a symptomatic patient whose ECG has minimal ST elevation.
Our thanks to Palm Beach Gardens, FL Fire Rescue for donating these ECGs.
Related Terms:
Rate this content:
All our content is FREE & COPYRIGHT FREE for non-commercial use
Please be courteous and leave any watermark or author attribution on content you reproduce.
Comments
Acute RV MI (with Inf STEMI and AV Block)
Interesting tracing. For clarity, I’ve labeled beats and have added arrows for atrial activity. Unfortunately, due to baseline artifact — atrial activity is not always easy to make out (there are some instances in the figure where there is confusion between U wave vs P wave …) — but overall, the underlying sinus rate appears fairly regular (at ~100/minute). Knowledge of the clinical setting helps immeasurably in such instances to “intuit” what the rhythm almost certainly is. By this I mean to emphasize the points Dawn made — namely that there is obvious acute inferior STEMI — and that is a situation in which when one sees definite P waves with an irregular narrow-complex ventricular rhythm showing grouped beating and changing PR intervals — that 2nd-degree AV block ( = Mobitz I or AV Wenckebach) is almost always present, often with some junctional escape beats mixed in. In such situations, as the “electrocardiographer” — my main task is greatly simplified, since all I have to do is “intuit” where are the periods of progressively increasing PR interval, and where are the likely junctional escape beats (since the “answer” = AV Wenckebach, is already almost certain to be the underlying cause of the rhythm disturbance).
NOTE: Unfortunately, we lack a long lead rhythm strip … As a result, we have to look at the “bottom line” in both 12 leads — in which QRS morphology changes because we switch from leads III to aVF to V3 to V6 … That said, we still CAN interpret the rhythm.
Of note, ECG #2 (Bottom) was obtained 10 minutes after ECG #1 (Top). ECG #2 is easier to look at first. This begins with 2:1 AV conduction (Mobitz I) for the first 4 beats in ECG #2. Note that the PR intervals preceding beats #1,2,3,4 appear to be normal and constant. There are then two 3:2 Wenckebach cycles at the end of the tracing (beats #5,6; and 7,8 in ECG #2) — and this confirms our diagnosis!
Things were a bit more complex 10 minutes earlier in ECG #1 (Top). I believe there probably are two 2:1 cycles (beats #4 and 5) — since the PR intervals preceding beats #4 and #5 are similar to the PR intervals preceding what we KNOW are 2:1 cycles in ECG #2. But for beats #2 and 3 in ECG #1 — there is variation in the PR interval preceding these QRS complexes. So one wonders if there is higher-grade AV block at this point? Once again, knowing the clinical context is invaluable — since it is NOT uncommon to go back-and-forth between Mobitz I 2nd-degree AV block and complete AV block with narriow QRS escape during the early hours of acute inferior STEMI. This may be what we see here. Toward the end of ECG #1 — the R-R interval becomes more regular — so this probably reflects junctional escape. But because the R-R interval between beats #2-3 is LESS than the R-R interval between beats #6-7; 7-8; and 8-9 toward the end of the tracing — it is unlikely that complete AV block was present, but rather some “higher-grade” 2nd-degree. And as we see in ECG #2 — 10 minutes later, a much clearer pattern of Mobitz I with 2:1 and 3:2 AV conduction emerges.
As to the 12-lead ECGs — I’ll add to Dawn’s comments by suggesting that although ECG #2 with right-sided lead V4 confirmed the diagnosis of acute RV infarction — this additional tracing was NOT needed for diagnosis given what we already see in ECG #1. There is obvious acute inferior STEMI in ECG #1. The presence of more marked ST elevation in lead III > II suggests acute occlusion of the RCA ( = Right Coronary Artery). What is unusual about ECG #1 is the very marked ST coving and elevation in lead V1! There is ST depression in lead V2, but only minimal. Putting the clinical situation together — the relatively limited amount of ST depression we see in lead V2 reflects associated posterior involvement. In this setting, isolated ST elevation in lead V1 almost certainly indicates acute RV (right ventricular) involvement, perhaps already with some RV dilatation. That’s because lead V1 is a “right-sided” lead — and whenever you see a flat or slightly elevated ST segment in lead V1 in a patient with acute inferior ST and obvious ST depression in V2, V3 — you can suspect RV involvement. Those are the patients for whom right-sided leads DO benefit — because you can then confirm acute RV involvement with ST elevation in V2R, V3R, V4R. But when you see dramatic isolated ST elevation in lead V1 (as we do in ECG #1 here) — you already KNOW you are dealing with acute occlusion of a proximal RCA lesion. Especially in view of the associated rhythm disturbance — urgent cath/PCI is essential for optimal outcome.
Ken Grauer, MD www.kg-ekgpress.com [email protected]