
Submitted by Dawn on Fri, 12/16/2016 - 18:57
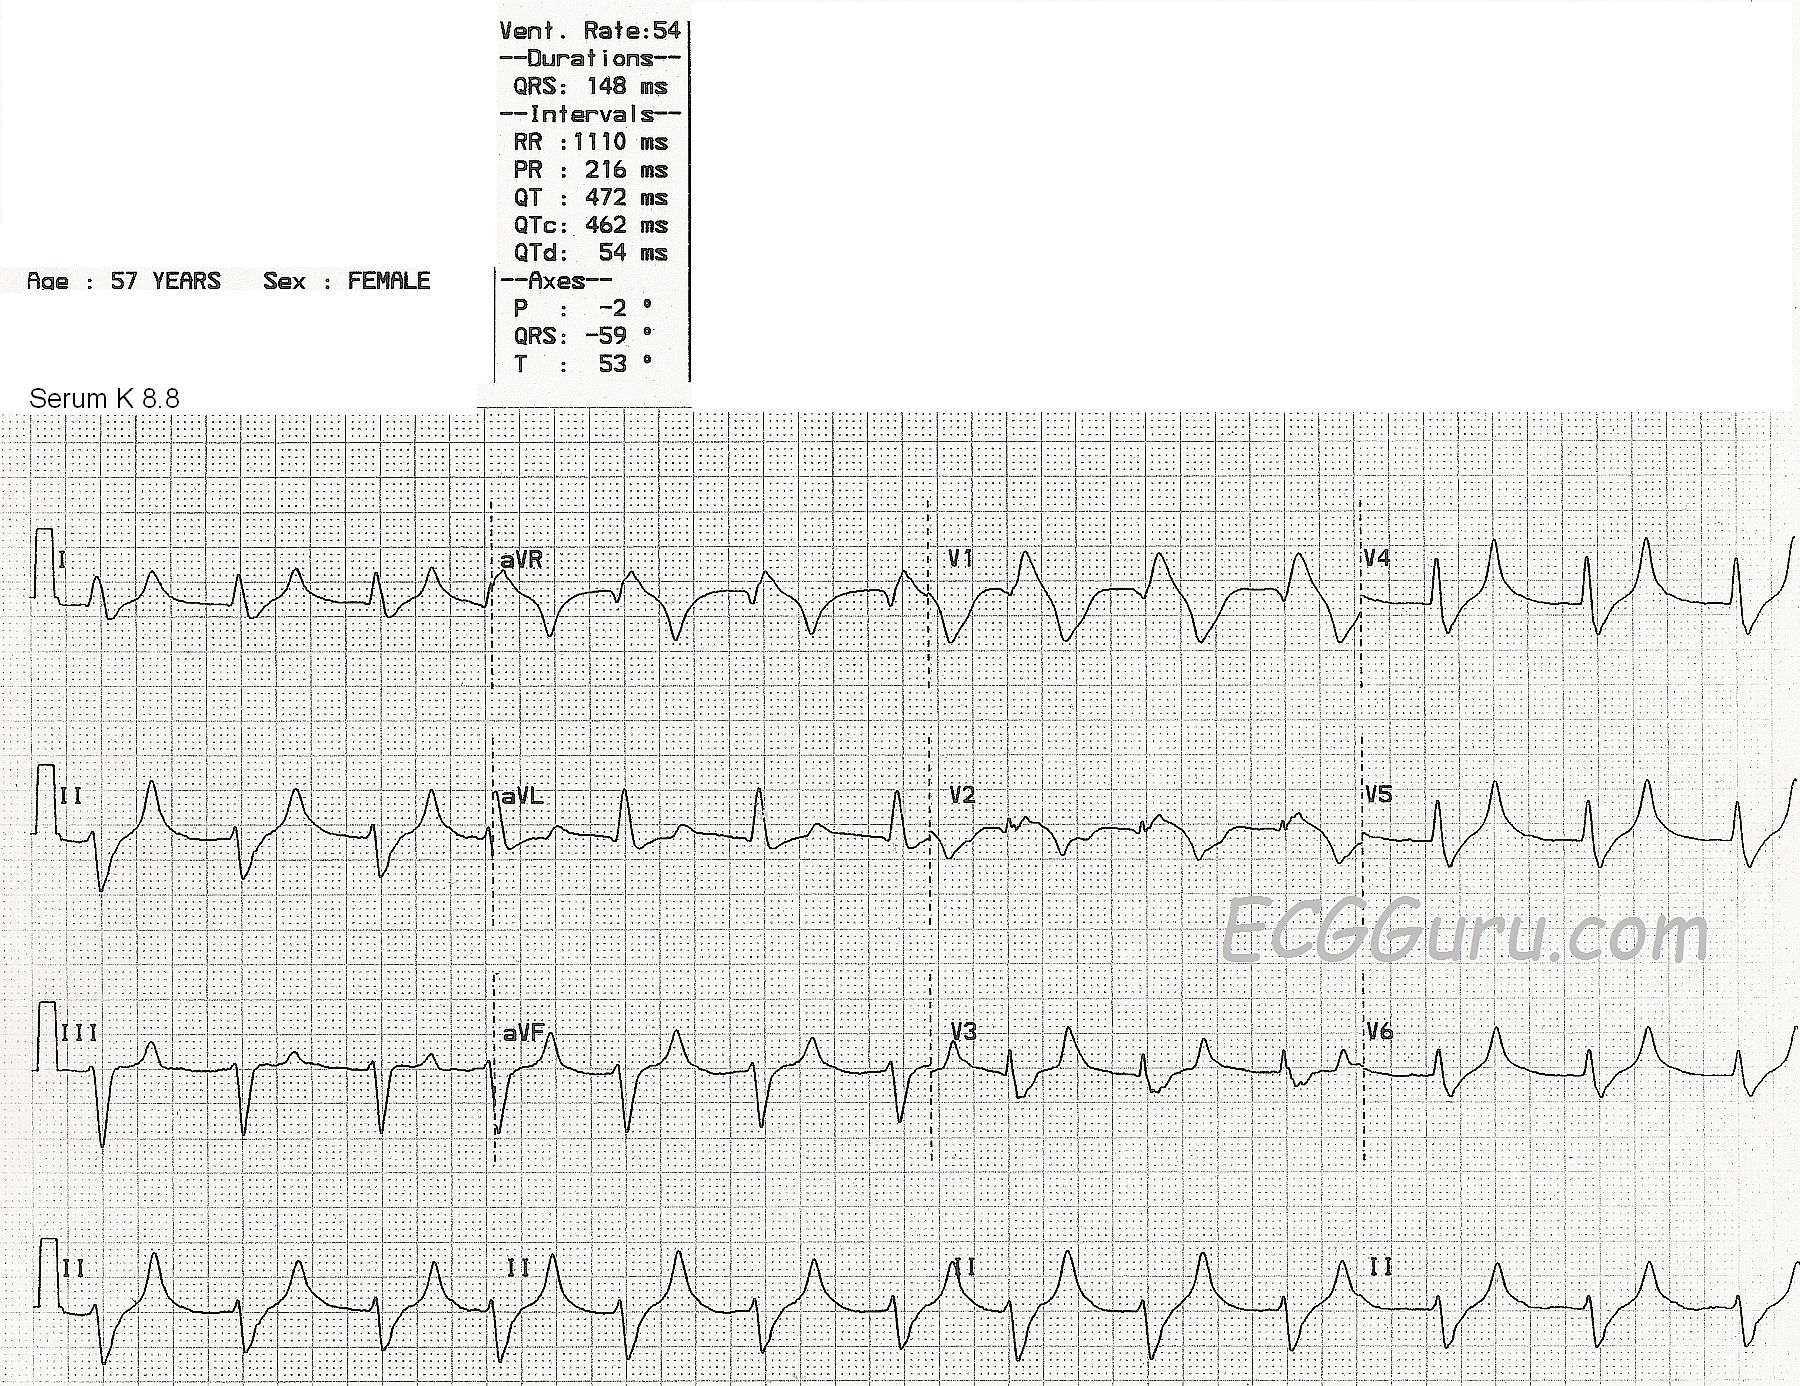
This ECG is from a 57-year-old woman with extreme weakness. We do not know her medical history or complete lab results, except that her serum potassium level was 8.8 mEq/liter at the time of this ECG.
This ECG shows a fairly regular rhythm at about 75 bpm, with a few early beats raising the rate slightly. (Even though the machine's interpretation lists the rate as 54 bpm. The QRS duration is listed at 148 ms (.148 seconds), but it appears wider. It is difficult to see the excact location of the J point because the QRS slurrs into the ST segment. Even though the ECG machine reports a P wave axis and a PR interval, P waves are not visible.
The QRS morphology appears to be an atypical right bundle branch block and left anterior hemiblock pattern. The T waves in leads I, II, aVF, and V3 through V6 are narrow, tall and peaked.
Potassium is primarily an intracellular electrolyte. It is necessary for proper electrical functioning of the heart. Extracellular serum potassium can rise due to renal failure, or taking potassium supplements, potassium-sparing diuretics, or ACE inhibitors. Occasionally, serum K levels may be artificially elevated by drawing the blood with too much syringe pressure, or using too small a needle, as the red blood cells can be damaged and release intracellular K into the serum.
ECG signs may vary among people with hyperkalemia, but in general:
Serum K levels of 5.5 mEq/L or greater can cause repolarization abnormalities like tall, peaked T waves.
Serum K levels of 6.5 mEq/L or greater cause progressive paralysis of the atria. The P waves will lose amplitude, widen and flatten. The PR segment will lengthen. Eventually, the P waves will disappear.
Serum K levels of 7.0 mEq/L or greater can cause conduction abnormalities. The QRS will widen and the rate will slow. There may be bundle branch blocks or fascicular blocks. The QRS morphology will be bizarre - not necessarily showing a typical bundle branch block pattern. AV blocks may occur, with either ventricular or junctional escape rhythms.
As the patient's condition worsens and the serum potassium rises, the QRS and T waves lose amplitude, widen, and may seem to blend together.
At levels above 8.0 mEq/L, we may see what looks like a bizarre idioventricular rhythm, or a sine wave pattern. This sine wave pattern signals cardiac arrest is imminent.
For a comprehensive discussion of hyperkalemia on the ECG with many examples of the different phases, go to Life In The Fast Lane. Ed Burns has compiled a very instructive collection of ECGs that illustrate the progression of this deadly condition.
Dr. Steve Smith's blog has several very good discussions on the subject. For a comparison of tall T waves caused by several factors, including hyperkalemia, go to Dr. Smith's Blog.
Related Terms:
Rate this content:
All our content is FREE & COPYRIGHT FREE for non-commercial use
Please be courteous and leave any watermark or author attribution on content you reproduce.
Comments
Hyperkalemia on ECG
This tracing is virtually diagnostic of hyperkalemia (until such time that lab values prove otherwise). Dawn has indicated the key points. There is a regular wide rhythm at ~ 75/minute. Although QRS morphology in lead V1 superficially resembles RBBB — the QRS in this lead is almost amorphous. T waves are tall and peaked in multiple leads, with a disproportionately narrow base that is characteristic of hyperkalemia. There are no P waves. This combination of findings strongly suggests marked hyperkalemia (level probably > 8.0 mEq/L) — which as Dawn indicates was precisely within the range revealed by the serum potassium level.
-----------------------
Ken Grauer, MD www.kg-ekgpress.com [email protected]
Don't Underestimate the Danger of "Low Level" Hyperkalemia
Dawn...
Thanks for the excellent analysis of this tracing. There are a few more things to be mentioned here:
First of all, I have seen some students in my classes interpret the morphology in V1 as a Brugada Syndrome. While there is a similarity, it is NOT the same! If you compare the two side-by-side, the difference becomes much more apparent.
Second, it has also been interpreted as an acute anteroseptal MI or right ventricular MI. There CAN be STE in hyperkalemia (especially in V1) and, although it looks very similar to this, there is usually a bit more prolongation of the ST segment. However, it's still hyperkalemia and failure to immediately recognize that fact could result in a very bad outcome.
Third - and most importantly - I wouldn't spend a lot of time trying to match the ECG appearance with the serum potassium level. I think it's sort of de rigueur these days to minimize the risk to the patient when the hyperkalemia is in the lower range. I have even read articles that state you don't need to worry about it until it reaches a much higher level and that there are no complications when the potassium level is in the lower range of hyperK+. That is simply not true and here is why: the repolarization change ("hyperkalemic T") is, at least in the initial stages (and sometimes later), not uniform throughout the myocardium. This introduces a dispersion of the repolarization process throughout the myocardium and the potential for a reentrant dysrhythmia such as ventricular tachycardia that could degenerate into v-fib. Even in the ECG presented here (with a serum K+ of 8.8), you can see that some T waves are not what one would call "hyperkalemic." Compare the T waves in Leads III and aVL with those in Leads I or aVF. Even with the difference in lead axes, there is still a fundamental diference in those T waves. I strongly believe that one should take action at the first sign of the ECG changes of hyperkalemia in a patient with no history of renal failure. Certainly, dialysis patients can tolerate much higher levels of serum potassium and may show no changes on their ECG until the level is quite high. But I wouldn't assume that there is "ample time" to address the ECG signs of hyperkalemia in a patient with no history of renal failure.
While complications in the range of 5.5 to 6.0 are, admittedly, not frequent, just how much risk are you willing to take with your patient?
Thanks for a great blog!
Jerry W. Jones MD FACEP FAAEM
https://www.medicusofhouston.com
Twitter: @jwjmd