
Submitted by Dawn on Sun, 06/26/2016 - 15:33
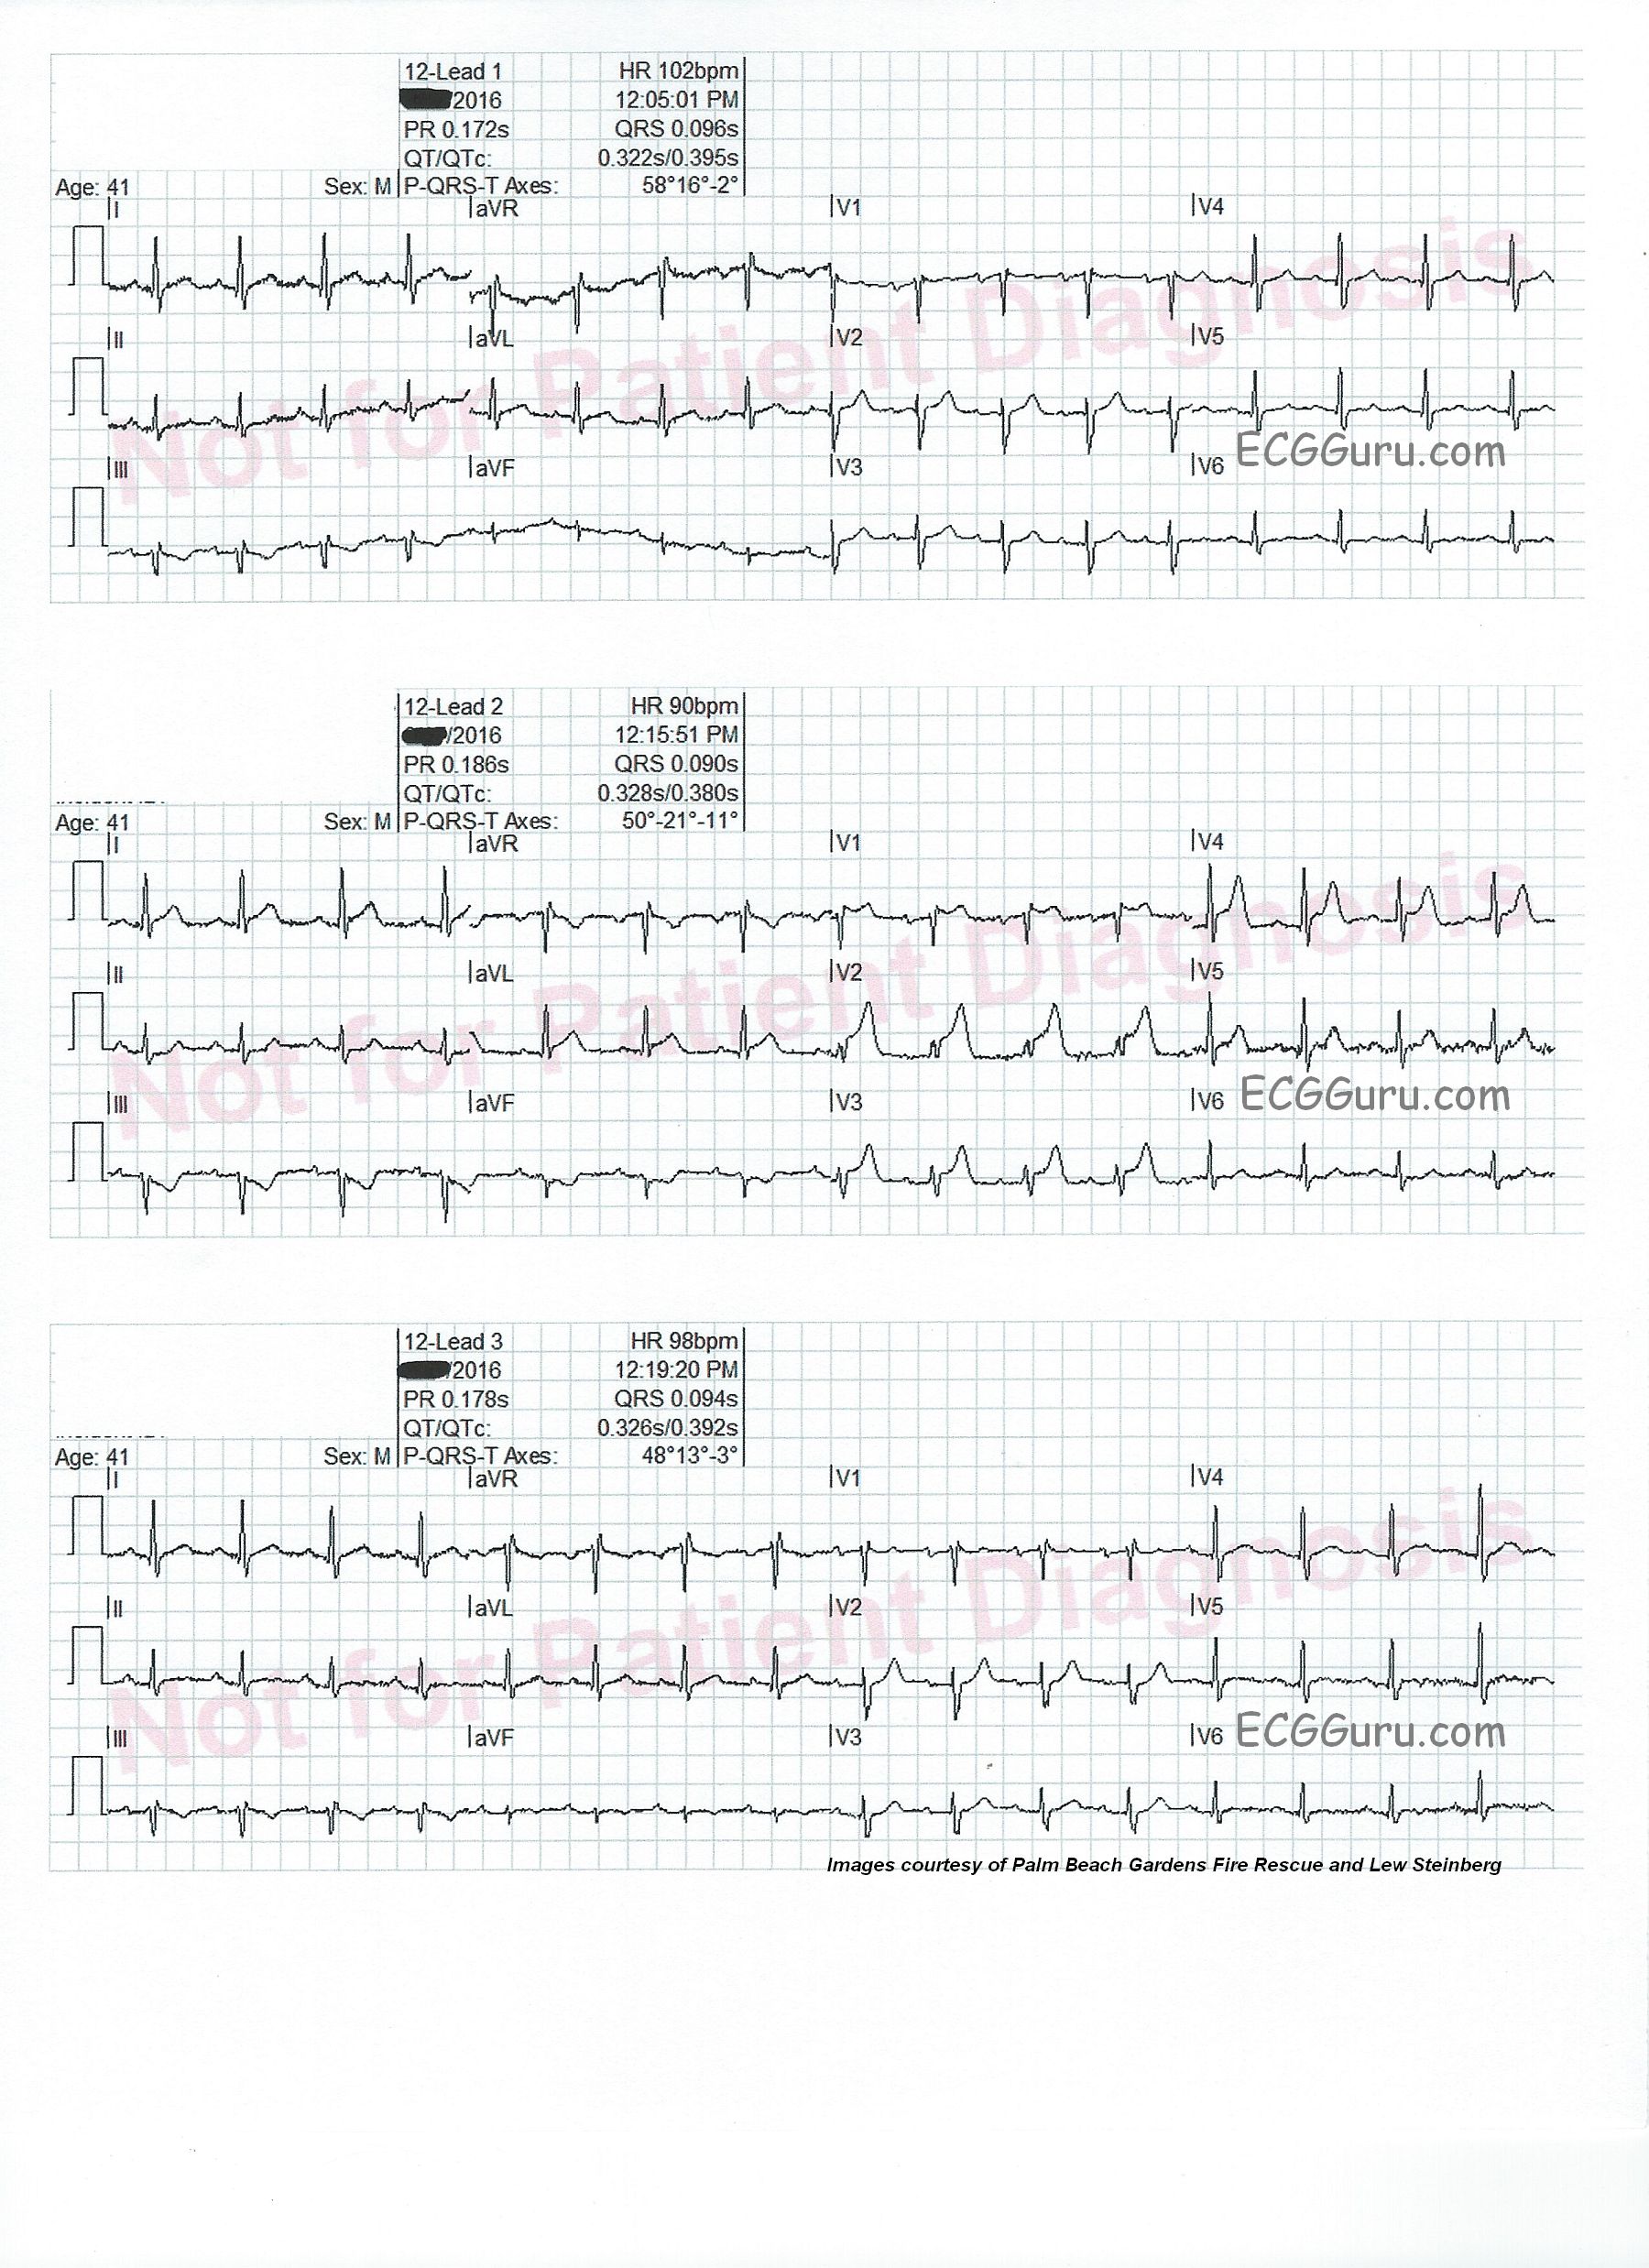
Intermittent chest pain. This series of three ECG were taken from a 41-year-old man with a two-week history of intermittent chest pain. At the time of the first ECG, 12:05 pm, he was pain-free. We see a sinus tachycardia at 102 bpm, and has just come under the care of paramedics. There is a very subtle ST sagging and T wave inversion in Lead III, and no other ST changes. He had an uneventful trip to the hospital.
On arrival at the Emergency Department, just before he was unloaded from the ambulance (12:15), he experienced chest pain. An ECG was obtained, which shows ST elevation in V1 through V4, as well as in Leads I and avL. There are reciprocal ST depressions in Leads III and aVF.
The patient was taken into the ED, where his symptoms abated, and a third ECG was obtained (12:19). The third ECG looks very much like the first one. V5 and V6 have T waves that appear flat, or even inverted, but there is some baseline artifact making it hard to see them.
Diagnosis confirmed Based on the patient’s presentation, and the second ECG, he was taken immediately to the cath lab. A 100% occluding lesion with a clot was discovered in the mid LAD. The clot was removed with suction, and the lesion stented. A 40% narrowing was discovered in the RCA.
Repeat ECGs whenever possible This series of ECGs offers a compelling argument for performing repeat ECGs. This can be especially important when symptoms are waxing and waning. Sometimes, a clot can completely occlude an artery, then “float” to another position, allowing blood flow to resume. Sometimes, the artery constricts around the lesion, causing occlusion, then relaxes. Had the rescue crew not repeated the ECG at 12:19, there may have been a delay in this young patient receiving interventional care.
Related Terms:
Rate this content:
All our content is FREE & COPYRIGHT FREE for non-commercial use
Please be courteous and leave any watermark or author attribution on content you reproduce.
Comments
Acute Anterior STEMI - What a Difference 10 Minutes Make …
Highly insightful series of 3 ECGs obtained from this 41-year old man with a history of intermittent chest pain over the preceding 2 weeks. Hard to believe there is just 10 minutes time difference between ECG #1 (Top) and ECG #2 (Middle) — and then just 4 minutes between ECG #2 and ECG #3 (Bottom). Knowing the answer (ie, 100% mid-LAD occlusion on cath) then allows us to put the pieces together, though it would be really nice if we had a slightly earlier ECG recorded shortly before ECG #1 …
Beginning with ECG #2 (Middle tracing) — Sinus rhythm with obvious acute anterior STEMI. Tall and peaked T waves (most notably in lead V2) are seen beginning in V1 and extending to V5. One would surmise a more proximal LAD occlusion than cath results showed, given onset of ST elevation in V1 — maximal ST elevation as early as V2 — ST elevation in lead aVL — and, reciprocal ST depression in each of the inferior leads. All of these ECG features are typical of a more proximal (rather than mid- or distal) LAD occlusion. The terminal QRS distortion (ie, lack of an S wave that descends below the baseline in V2) is diagnostic of an acute event.
ECG #3 (obtained just 4 minutes after ECG #2) — There is virtual resolution of almost all acute findings from ECG #2. There is also some return of R wave amplitude, and the S wave in lead V2 now easily descends below the baseline in this lead. These ECG findings, together with relief of chest pain both strongly suggest spontaneous reperfusion of the infarct-related artery. Without such spontaneous return of coronary flow, the ST elevation seen in ECG #2 would doubtlessly be much more profound over the ensuing minutes.
Retrospective Review of ECG #1 (obtained just 10 minutes prior to ECG #2) — Even knowing the dramatic ST-T wave changes about to occur with ECG #2, I am hard-pressed to find any definitive changes in ECG #1. There is straightening of the ST segment in lead aVL, but no real ST elevation in this lead. There is subtle-but-real ST segment flattening in each of the inferior leads with a small q wave in lead II and shallow T wave inversion in leads III and aVF — and, shape of the ST-T wave in lead III is the mirror-image of the positive ST-T wave in lead aVL. But J-point displacement is minimal in these limb leads, and negligible in the chest leads. ST-T wave flattening in V4, V5, V6 is nonspecific — and neither the slightly positive T wave in lead V1 nor the T wave slightly taller than the R wave in V2 are disproportionate enough to portend what is about to follow. That is why I would LOVE to see an ECG obtained a little bit earlier than ECG #1 — because some of the nondiagnostic features just described might have portended what is about to follow IF the ECG picture we see in tracing #1 was evolved from what might have been seen in an even earlier tracing …
LEARNING Points — The course of acute STEMI may be stuttering. Symptoms began in this patient 2 weeks earlier. One can only wonder how many times there was obstruction (or near obstruction) with spontaneous reperfusion occurring (and reoccurring) during this time period. Once complete obstruction of the “culprit artery” does occur — ST-T wave changes may dramatically evolve over a period of minutes (the difference between ECG #2 and #3). Serial ECGs obtained during this stage of rapid evolution may be revealing, as they were in this case (in which catching the changes seen in ECG #2 provided major impetus for immediate catheterization). ECG changes of acute STEMI may resolve as quickly as they develop when there is spontaneous reperfusion. Finally, careful clinical correlation of the history in association with serial ECG changes tells a much better “story” than is possible from isolated examination of any single tracing alone.
Ken Grauer, MD www.kg-ekgpress.com [email protected]