Dawn's picture

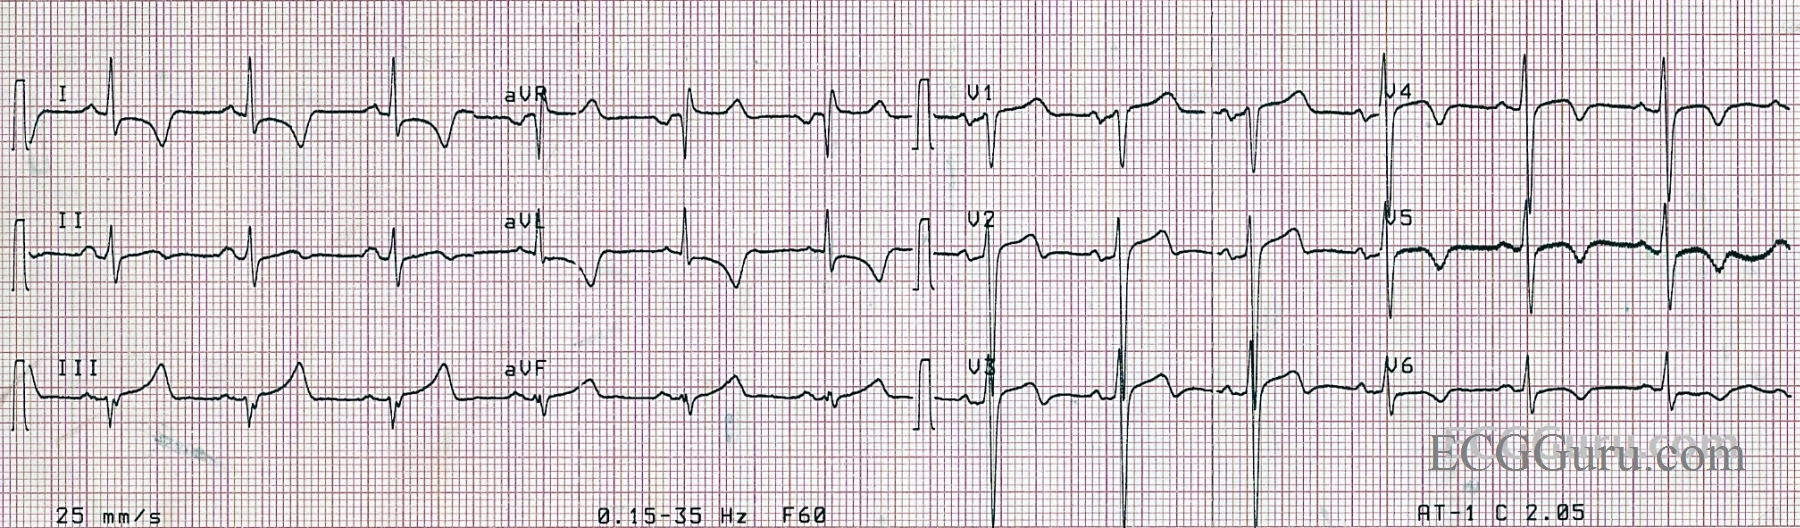
This is a very interesting ECG taken from an acute M.I. patient.  Your basic level students will be able to appreciate the ST elevation in V1 through V3. Although the elevations are not very high, there are plenty of other abnormalities that point to acute STEMI: the ST segments are flat and there are marked ischemic T waves in the lateral leads: V4 through V6 and I and aVL.  The patient was suffering an acute episode of chest pain.

It is also noticeable that R wave progression in the precordial leads (V1 through V6) is not optimal, as there is still a significant S wave in V6.  We do not know if this is an electrode placement issue or not.  The QT interval is just at the high limit of normal.  
For your more advanced students, aVR has ST elevation.  It is not reciprocal of an ST depression in Lead II.  Research has shown that ST elevation in aVR and V1, especially when the ST elevation is greater in aVR, is a strong indication of proximal LCA or a Left Main occlusion.  Unfortunately, we do not have cath results for this patient.  In acute M.I. patients,  higher mortality rate has been associated ST elevation in aVR.

For more information about ST elevation in aVR, click here: https://login.medscape.com/login/sso/getlogin?urlCache=aHR0cDovL3d3dy5tZWRzY2FwZS5jb20vdmlld2FydGljbGUvNTg5Nzgx&ac=401

and here:  http://content.onlinejacc.org/cgi/content/full/38/5/1355


Rate this content: 
Average: 4 (2 votes)

Comments

ekgpress@mac.com's picture

 
VERY interesting tracing presented by Dawn. Unfortunately, cath results and details beyond that this patient had chest pain and was ultimated diagnosed as having had an acute MI are unknown ... Nevertheless — I’ll make a number of relevant comments.
  • My Interpretation: The rhythm is sinus at ~80/minute; the PR and QRS intervals are normal; the QT is borderline (as per Dawn). There is LAD (Left Axis Deviation) of approximately -30 degrees. There is LVH (very deep negative S wave in lead V2). QRST Changes — show no Q waves — delayed transition (the R wave becomes taller than the S wave only between V5-to-V6) — and marked diffuse ST-T wave changes.
  • Looking closer — ST segments are coved with fairly deep, symmetric T wave inversion in leads I,aVL; and V4,5,6. There is slight-but-real ST elevation in leads III and V1,2,3 — with disproportionately tall and peaked T waves in leads III and aVF (hyperacute changes). In addition, there is a biphasic T wave (with termination negativity) in leads V2,V3. Finally — there is clear ST elevation in lead aVR.
BOTTOM LINE: In a patient with new chest pain — these changes are clearly of concern. The rapid downsloping terminal portion of the T wave in leads V2,V3 that merges into terminal negativity resembles the ST-T wave appearance of Wellens Syndrome.
  • That said — Wellens’ Syndrome is a “pre-infarction” diagnosis, and we are told here that this patient has already infarcted … so uncertainty about the time sequence of the ECG changes we see raises questions about this ECG diagnosis. With acute reperfusion of a recently occluded coronary artery — you may see identical ST-T waves as are described in Wellens’ Syndrome. Moreover, the presence of LVH complicates ECG recognition of Wellens’ Syndrome — such that many more details about this case would need to be known before determining if true Wellens Syndrome is present. Nevertheless — my guess would still be that the infarct resulted from a tight LAD (Left Anterior Descending coronary artery) lesion that ultimately occluded.
  • Technically, an LAD axis that is not more negative than -30 degrees does not qualify as “LAHB” (Left Anterior HemiBlock). That said — this general rule might not hold when the competing condition of inferior infarction is present … And although technically there do not appear to be inferior q waves (I see a tiny-but-present initial r wave in both leads III and aVF ...) — the notching (fragmentation) present in both leads III and aVF suggest the likelihood of scarring and possible infarction at some point. Whether this reflects an LAD “wraparound” lesion (in which the occluded LAD is a long vessel that extends to the undersurface = inferior wall of the heart) or some prior event is uncertain.
P.S. Regarding the ST elevation in lead aVR — my bet given the overall picture seen here is that the occlusion was of the LAD rather than of the LMain coronary artery.


Ken Grauer, MD  www.kg-ekgpress.com   [email protected] 

Dave Richley's picture

I think this is an interesting and difficult ECG. As Ken says, there is evidence of LVH and this makes interpretation of the ST segments and T waves a little more complicated: some - though certainly not all – of the ST depression/elevation and T wave inversion may be attributed to LVH. I agree with Ken that the terminal T wave inversion is Wellens-like, so perhaps the patient had a partial LAD occlusion or tight LAD stenosis, rather than a complete occlusion, with widespread subendocardial ischaemia. Dawn’s assertion that the ST elevation in aVR is not reciprocal is interesting to consider because I find it very difficult to say whether it is the ST depression or the ST elevation in the limb leads that is the primary change. My suspicion is that the ST depression in I and aVL is the primary change, representing ischaemia, and that the ST elevation in III (1 mm) and aVR is reciprocal to this. It is a mathematical necessity that if on average there is ST depression in I and II, there will be ST elevation in aVR. On the other hand, as Ken points out, there may have been an occluded ‘wraparound’ LAD with consequent anterior and inferior infarction. Although it widely held that ST elevation in aVR is indicative of left main occlusion, I know that Dr Stephen Smith states that that this feature is actually due to left main insufficiency, not occlusion, with consequent global subendocardial ischaemia (and widespread ST depression). I believe he says that patients with a completely occluded left main rarely live long enough to have an ECG recorded, but when they do it shows widespread ST elevation. It’s a great shame that we don’t have cath results here because I think there are a few plausible interpretations of this very interesting ECG.

Dave R

ekgpress@mac.com's picture

GREAT comments Dave! The most difficult thing for me about formulating my prior Comment about this ECG was addressing the fact that there had been an “acute MI”, without any indication of the timing of this ECG and the patient’s chest pain, nor of the results of cardiac cath. I never meant to suggest that ST-T wave changes in leads III and aVF looked to be primary — since legitimate Q waves are lacking, and lead II looks nothing like what I’d expect for an established inferior MI. Instead, I felt “caught” between the information that “there was acute MI” and being given an ECG to interpret that looked more like the “before” picture (or perhaps the “after” picture) — than the "during" picture ...

I submitted the link to my section about ST elevation in aVR from my book, because in it I emphasize: i) that rather than LMain occlusion — diffuse ST depression (except for ST elevation in aVR — and possibly in V1) was suggestive of possible LMain narrowing (since most patients with true acute LMain "occlusion" die promptly — and those who survive generally manifest diffuse ST elevation, which is completely unlike the picture here); ii) that ST elevation in aVR + diffuse ST depression was in no way specific for LMain disease (it could also reflect proximal LAD narrowing, or severe coronary disease); and iii) that the picture of diffuse ST coving with fairly deep, symmetric T wave inversion + clear mirror-image reflection of this pattern in leads III, aVR, aVF looks very different morphologically than the straighter, sagging ST segments without T peaking that is characteristic of severe coronary narrowing. Add to this a pre-infarct snapshot of Wellens (as we see in leads V2,V3) in a patient with obvious LVH about whom we are told there has just been an acute MI — and, the findings just don’t quite fit unless: i) lots of what we see is due to established to LVH; and/or ii) we are seeing acute reperfusion ST-T waves …

Bottom Line: More information + specific cath findings are needed to truly make sense of all that we see here ...

Ken Grauer, MD  www.kg-ekgpress.com   [email protected] 

Dave Richley's picture

Ken - I agree with all you say! It's all very intriguing.


Dave R

Dawn's picture

Thanks, Dave and Ken, for the great discussion. I regret that I have so many great ECGs in my collection that don't have good clinical information. This is a "field" ECG that was given to me by a paramedic, and, unfortunately, I only recorded that it was from a "chest pain" patient who was diagnosed with an M.I.  Considering the fact that it is an EMS ECG (only 3 channels) we know it was taken earlier than the diagnosis. 

I have a very bad habit of using the word "occlusion" when I mean "lesion" - which could result in partial or complete occlusion. I completely agree with you, Ken, that a total LM occlusion would provide a much more dramatic ECG (briefly) or none at all, as that is usually a rapidly fatal lesion. I really need to work on this bad habit. 

Thank you both for the stimulating discussion. I always learn a lot from both of you. 


Dawn Altman, Admin

All our content is FREE & COPYRIGHT FREE for non-commercial use

Please be courteous and leave any watermark or author attribution on content you reproduce.