Submitted by Dr A Röschl on Thu, 04/24/2025 - 01:13
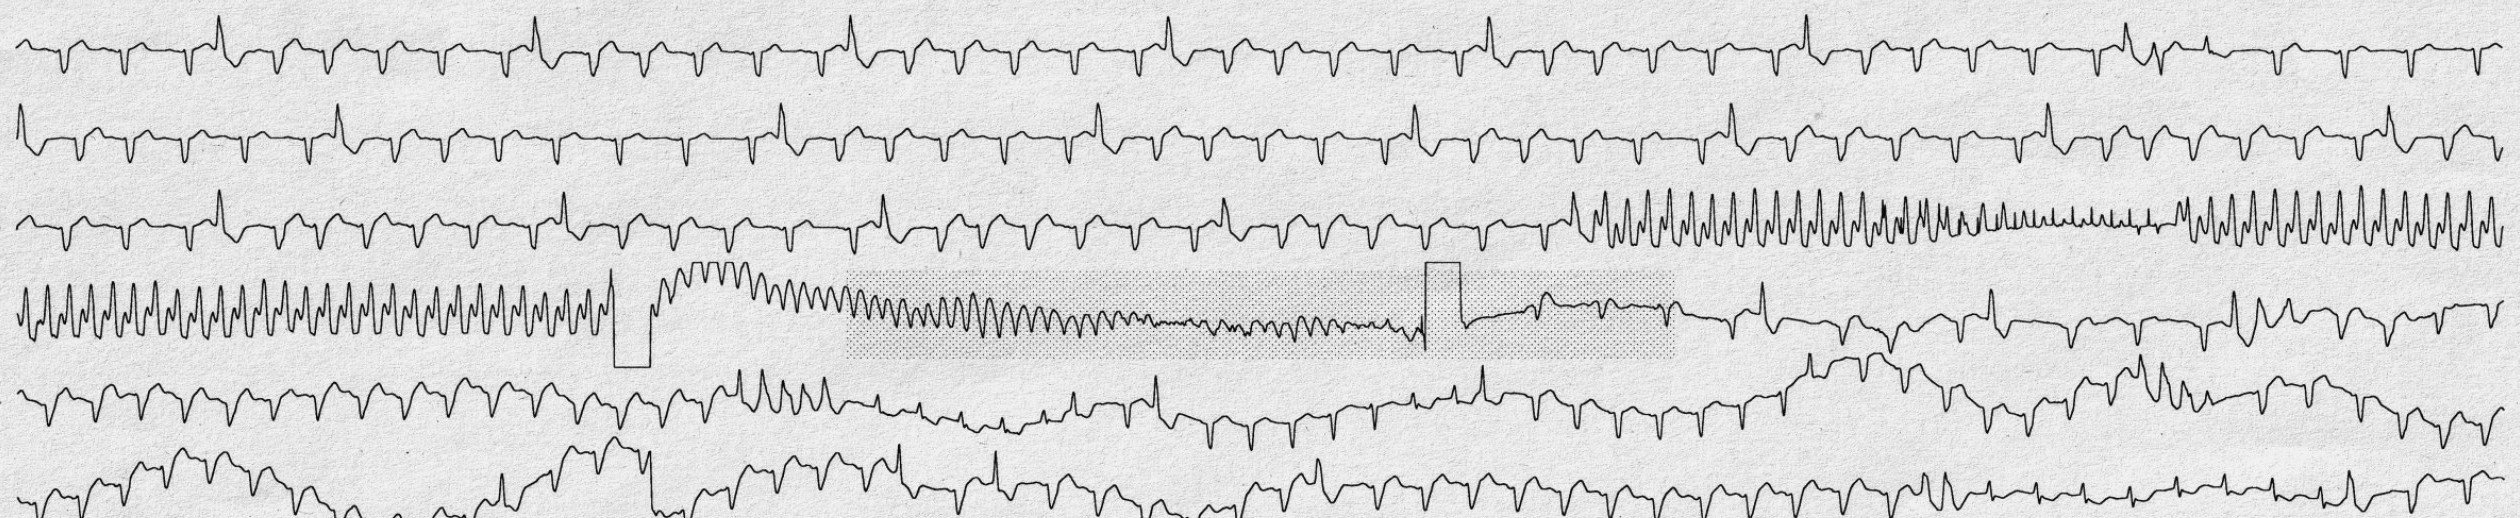
Sometimes a single Holter ECG can tell a whole story. Here we see a single-channel ECG, each line representing about 30 seconds.
The ECG is from a 56-year-old man with severe ischemic cardiomyopathy who had an ICD implanted a few months ago due to recurrent ventricular tachycardia.
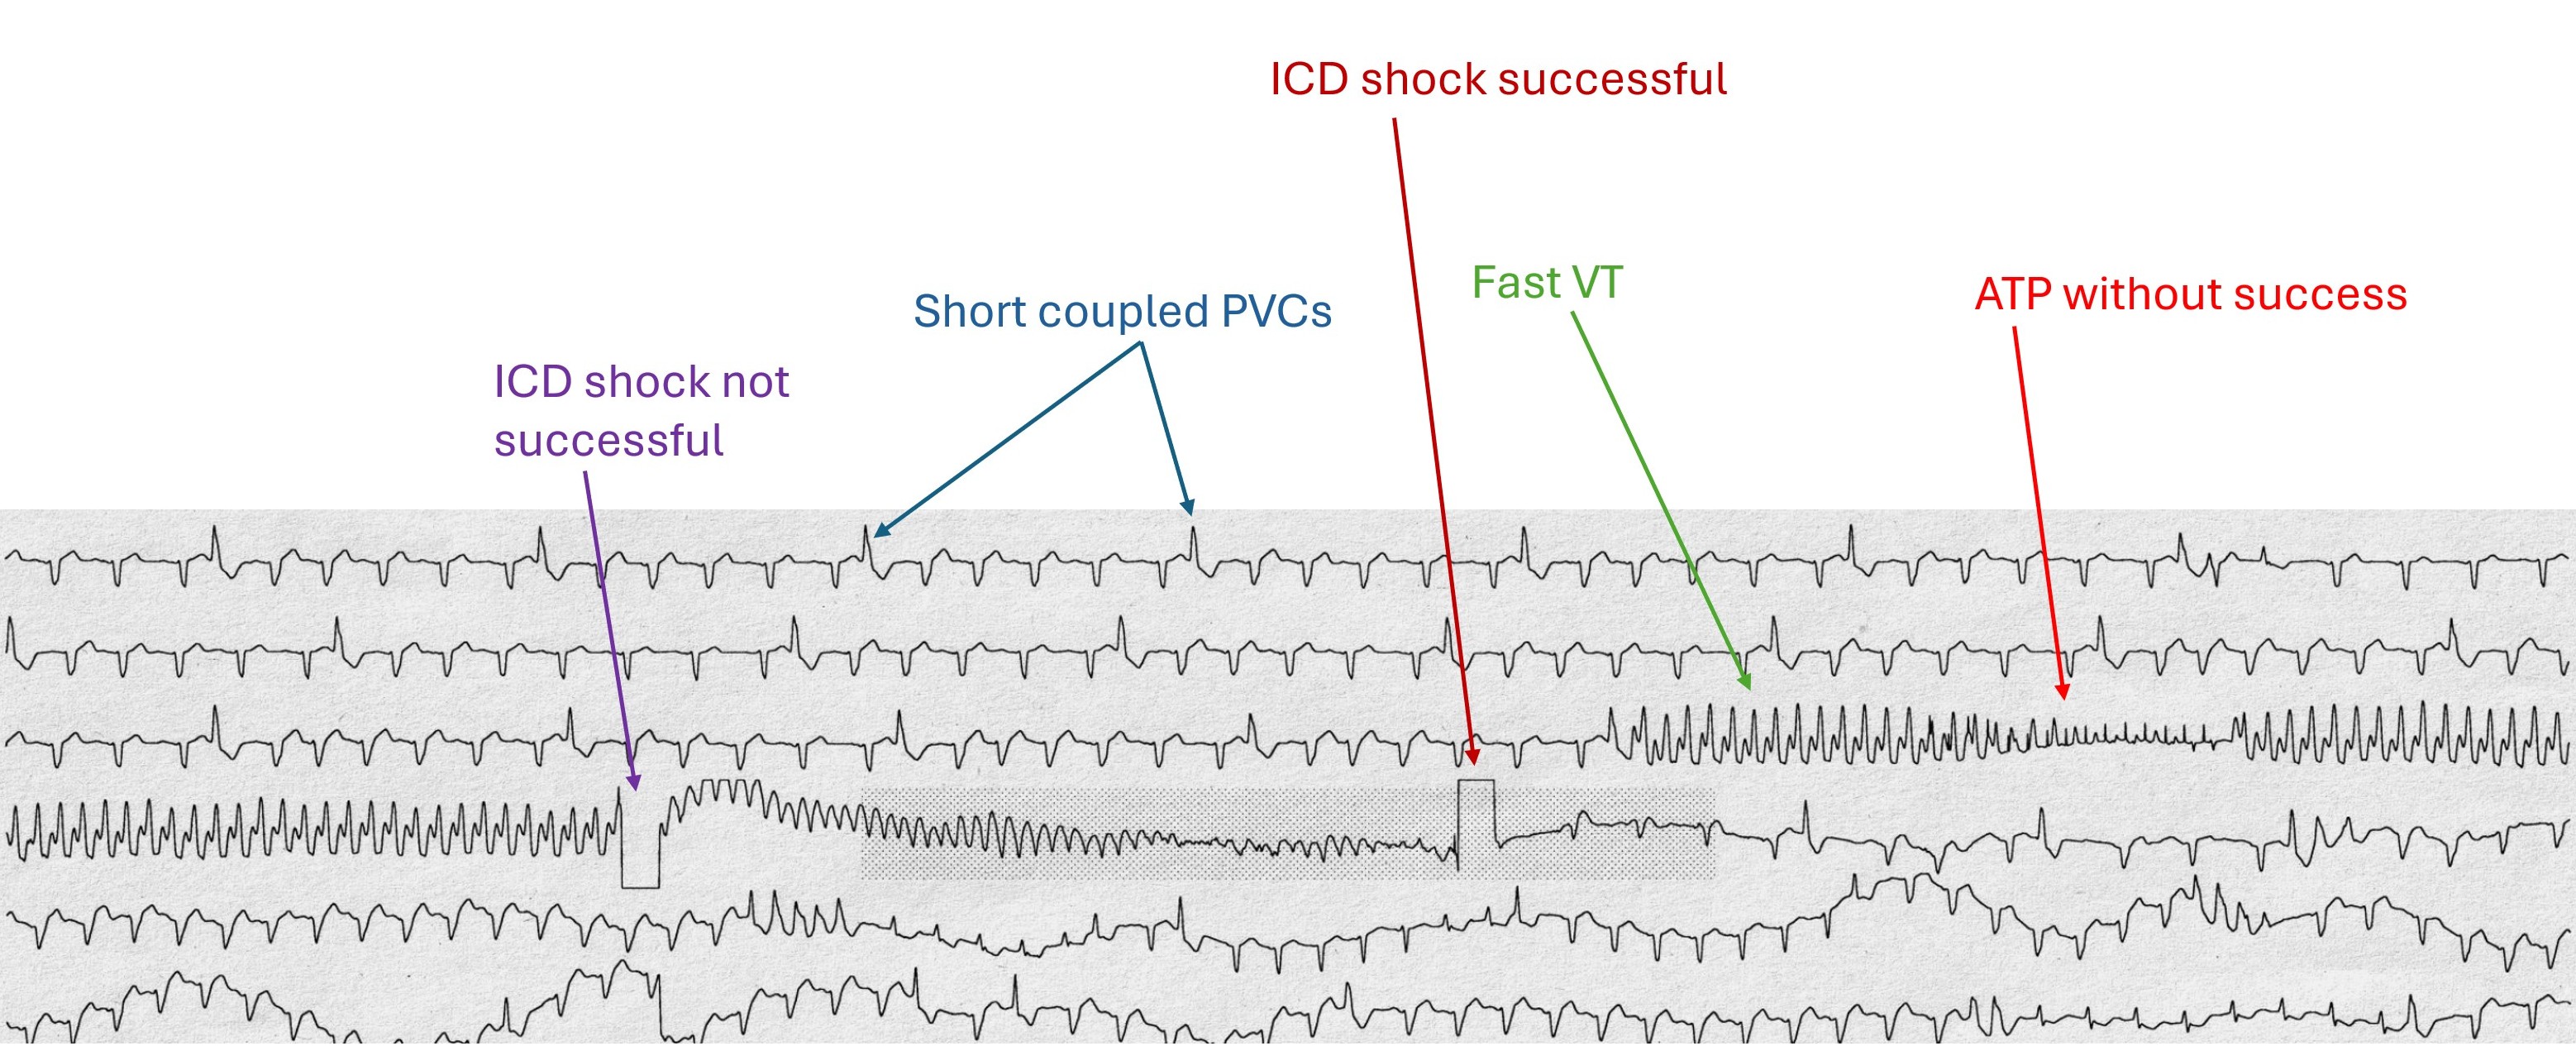
The explanation of what can be seen on this ECG can be found on the 2nd image.
Interestingly, the patient did not notice these events, they had occurred at night during sleep.